Cited by 150

The DOI matches its Crossref record; 6 of the 6 references it cites were found in a registry or an index.

Inhalation Exposure to Carbon Nanotubes (CNT) and Carbon Nanofibers (CNF): Methodology and Dosimetry

Oberdörster, Günter, Castranova, Vincent, Asgharian, Bahman, Sayre, Phil·2015·Journal of Toxicology and Environmental Health, Part B

Overview

The claims and statistics of this paper haven’t been checked yet.

Run the check — free, no account needed. It reads the open-access text and checks the sources it cites.

A few free checks a day · papers already verified open instantly · results are public

Integrity signals

Registry

Crossref · 10.1080/10937404.2015.1051611

Cites

6 of 6 references verified0 citation errors · 0 not checkable

Statistics

Figures

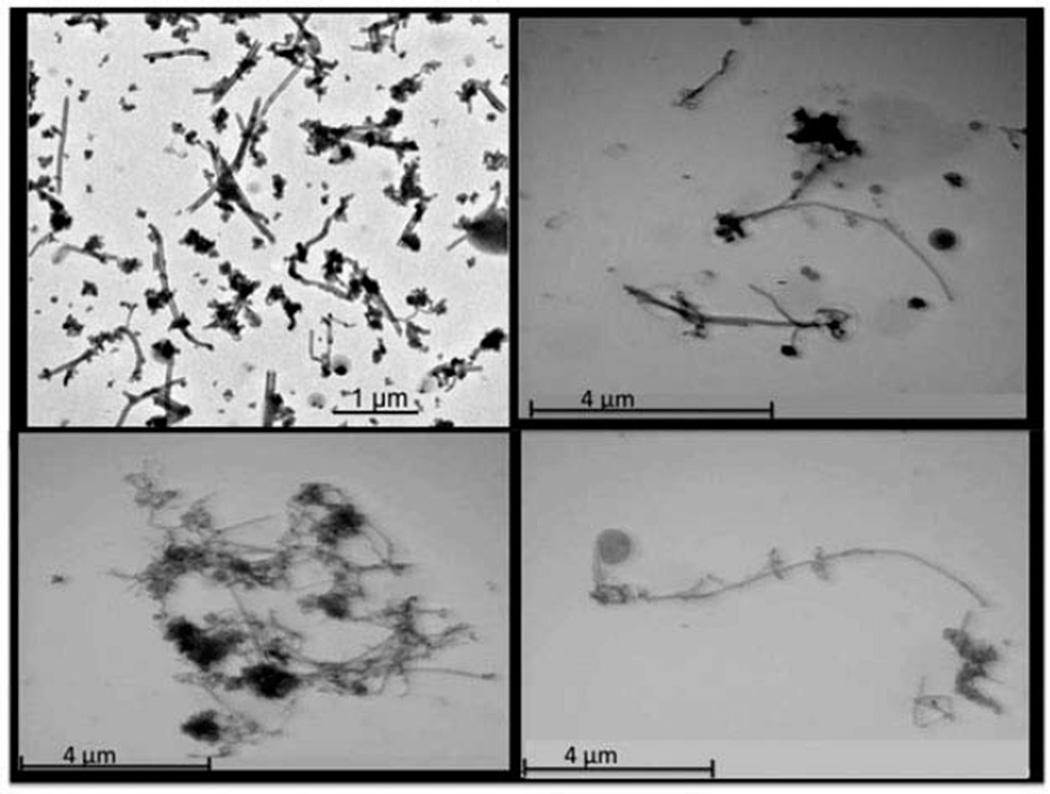
FIGURE 1 a. MWCNT aerosols at a research facility. Aerosols collected at a research facility during manufacture of MWCNT revealing a multiplicity of structures. (Han et al. 2008). Shown are samples collected in the facility after opening the furnace, demonstrating many non-fibrous structures in addition to some single fibers but mostly agglomerates of different sizes. Initially high concentrations could be significantly reduced following installation of proper enclosure and ventilation systems. b. MWCNT aerosols collected at a research facility. Aerosols collected at a research laboratory generating MWCNT by chemical vapor deposition (A: Tsai et al. 2009) and several commercial and research facilities manufacturing MWCNT (B, C, D: Methner et al. 2010). In the research facility, mostly agglomerates were seen and only some single filaments with numerous attached clusters of nanoparticles were found that consisted of carbon and included Fe from the catalyst (A). The aerosol in a commercial facility was described as “various forms like agglomerates, clusters, bundles, or nests rather than individual fibers or spherical particles” (B, C, D). These were collected under different working tasks (e.g., sawing, dumping). An example of the appearance of the few individual fibers and spherical particles is shown in (C). Total carbon concentrations measured on filters according to NIOSH NMAM Method 5040 (Issue 2, 1998) were equivalent to 1.8 mg/m3. In general, samples from both facilities indicate that long and individual fibers were hardly seen, in contrast to clusters/tangles of different sizes. The MWCNT aerosol generated experimentally for use in animal inhalation studies seems to be much better dispersed.
FIGURE 1 a. MWCNT aerosols at a research facility. Aerosols collected at a research facility during manufacture of MWCNT revealing a multiplicity of structures. (Han et al. 2008). Shown are samples collected in the facility after opening the furnace, demonstrating many non-fibrous structures in addition to some single fibers but mostly agglomerates of different sizes. Initially high concentrations could be significantly reduced following installation of proper enclosure and ventilation systems. b. MWCNT aerosols collected at a research facility. Aerosols collected at a research laboratory generating MWCNT by chemical vapor deposition (A: Tsai et al. 2009) and several commercial and research facilities manufacturing MWCNT (B, C, D: Methner et al. 2010). In the research facility, mostly agglomerates were seen and only some single filaments with numerous attached clusters of nanoparticles were found that consisted of carbon and included Fe from the catalyst (A). The aerosol in a commercial facility was described as “various forms like agglomerates, clusters, bundles, or nests rather than individual fibers or spherical particles” (B, C, D). These were collected under different working tasks (e.g., sawing, dumping). An example of the appearance of the few individual fibers and spherical particles is shown in (C). Total carbon concentrations measured on filters according to NIOSH NMAM Method 5040 (Issue 2, 1998) were equivalent to 1.8 mg/m3. In general, samples from both facilities indicate that long and individual fibers were hardly seen, in contrast to clusters/tangles of different sizes. The MWCNT aerosol generated experimentally for use in animal inhalation studies seems to be much better dispersed.CC BY-NC · PubMed Central
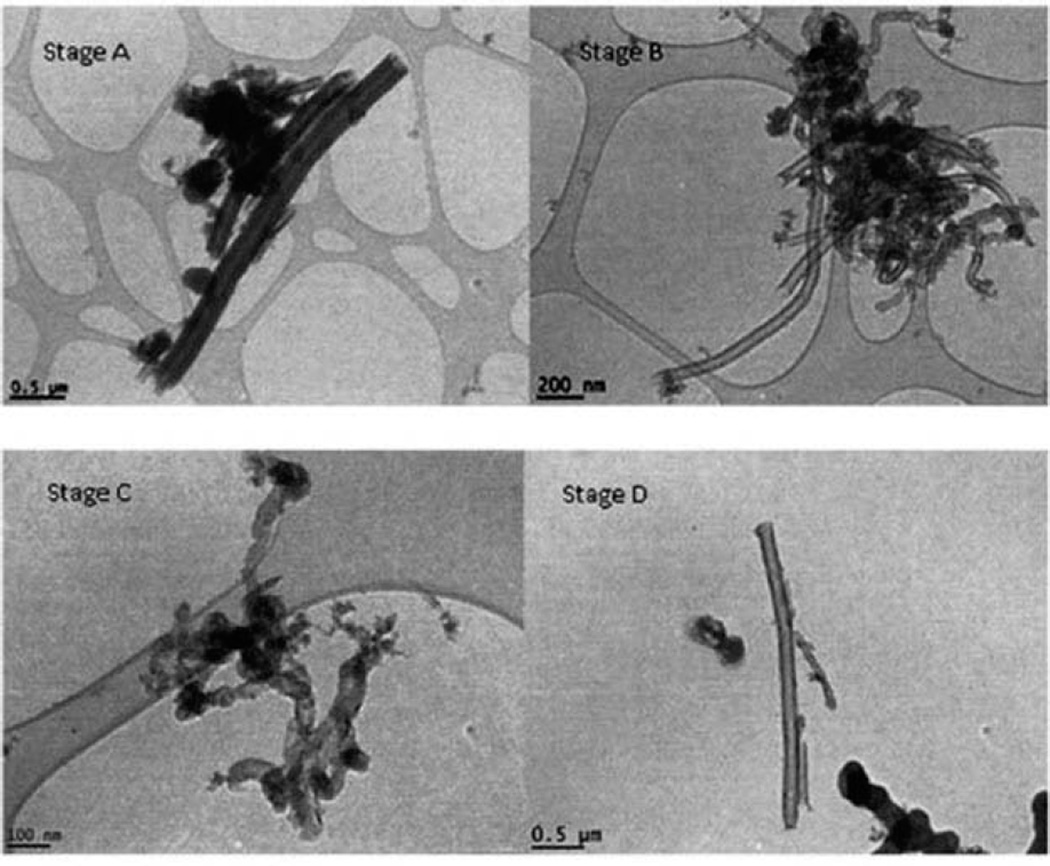
FIGURE 2 CNF aerosols collected on impactor stages during thermal treatment Transmission electron microscopy images of airborne CNF size selected by impactors located in a thermal treatment processing area for CNF. Impactor Stage A: 2.5–10 µm; Impactor Stage B: 1.0–2.5 µm; Impactor Stage C: 0.5–1.0 µm; Impactor Stage D: 0.25–0.5. Lacey carbon-coated Ni and SiO-coated Ni grids were used in impactors. (From: Birch et al. 2011).
FIGURE 2 CNF aerosols collected on impactor stages during thermal treatment Transmission electron microscopy images of airborne CNF size selected by impactors located in a thermal treatment processing area for CNF. Impactor Stage A: 2.5–10 µm; Impactor Stage B: 1.0–2.5 µm; Impactor Stage C: 0.5–1.0 µm; Impactor Stage D: 0.25–0.5. Lacey carbon-coated Ni and SiO-coated Ni grids were used in impactors. (From: Birch et al. 2011).CC BY-NC · PubMed Central
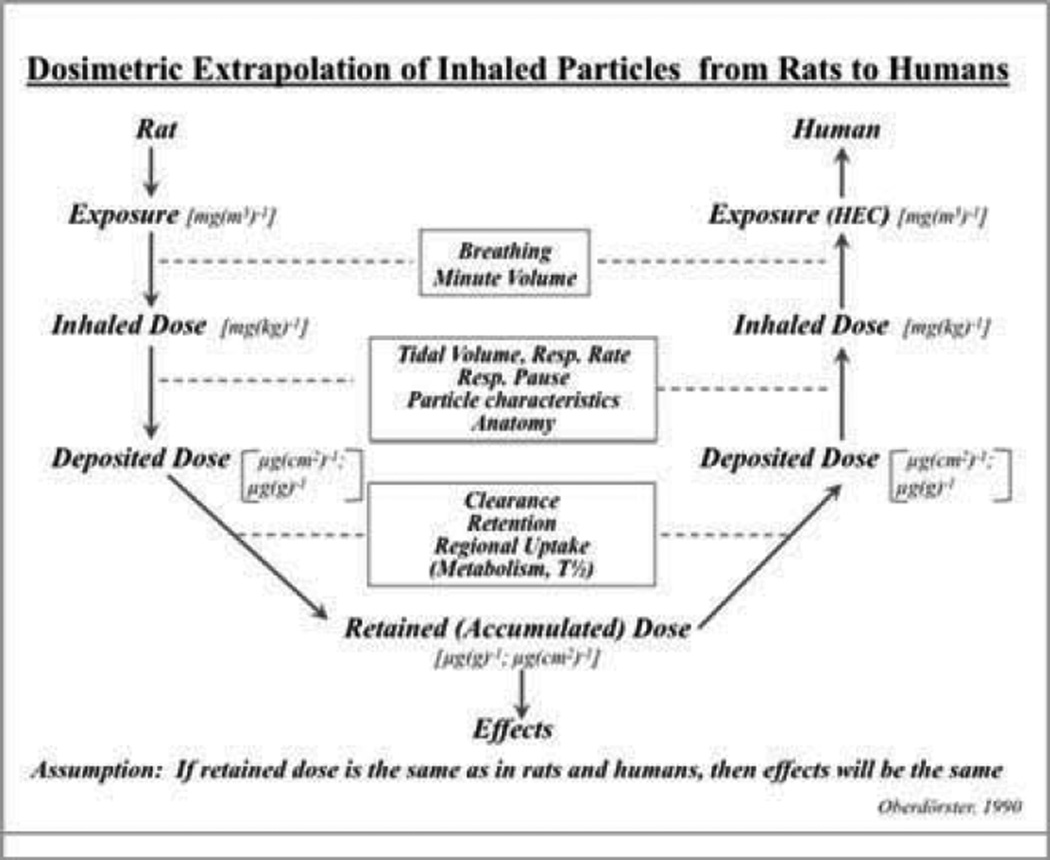
FIGURE 3 Dosimetric Extrapolation of Inhaled Particles from Rats to Humans Concept of dosimetric extrapolation of effects of inhaled materials in experimental animals to humans. A Human Equivalent Concentration (HEC) is derived based on study in rats (scenario 2 described in text) by using the MPPD model for rats to estimate the inhaled (delivered) and daily deposited dose in rats resulting from the specific experimental exposure concentrations. Knowing the material rat-specific clearance rates or retention halftime (T1/2) in the lung, the retained dose that has accumulated over the duration in the lung can be calculated, but may also be determined by analytical methods at the end of exposure. Using then human-specific clearance rates—if available—and breathing scenarios as inputs to the MPPD model for humans the HEC can be estimated for either the MMAD and GSD of the experimental aerosol, or for an aerosol size distribution that is known to be present for the human exposure scenario. The HEC is equivalent to the rat exposure in terms of resulting in the same deposited dose—or retained dose—in both species. Through using the MPPD model human and rat inhalability and respirability differences are taken into consideration. Deposited and retained dose can be expressed either per unit of epithelial surface in the respiratory tract—tracheobronchial or alveolar—, or per unit mass of the lung. In addition, the material based dosemetric can be mass (as indicated in the scheme), or surface area or number of CNT/CNF, if respective information is available. [From: (Oberdörster 1989)]
FIGURE 3 Dosimetric Extrapolation of Inhaled Particles from Rats to Humans Concept of dosimetric extrapolation of effects of inhaled materials in experimental animals to humans. A Human Equivalent Concentration (HEC) is derived based on study in rats (scenario 2 described in text) by using the MPPD model for rats to estimate the inhaled (delivered) and daily deposited dose in rats resulting from the specific experimental exposure concentrations. Knowing the material rat-specific clearance rates or retention halftime (T1/2) in the lung, the retained dose that has accumulated over the duration in the lung can be calculated, but may also be determined by analytical methods at the end of exposure. Using then human-specific clearance rates—if available—and breathing scenarios as inputs to the MPPD model for humans the HEC can be estimated for either the MMAD and GSD of the experimental aerosol, or for an aerosol size distribution that is known to be present for the human exposure scenario. The HEC is equivalent to the rat exposure in terms of resulting in the same deposited dose—or retained dose—in both species. Through using the MPPD model human and rat inhalability and respirability differences are taken into consideration. Deposited and retained dose can be expressed either per unit of epithelial surface in the respiratory tract—tracheobronchial or alveolar—, or per unit mass of the lung. In addition, the material based dosemetric can be mass (as indicated in the scheme), or surface area or number of CNT/CNF, if respective information is available. [From: (Oberdörster 1989)]CC BY-NC · PubMed Central
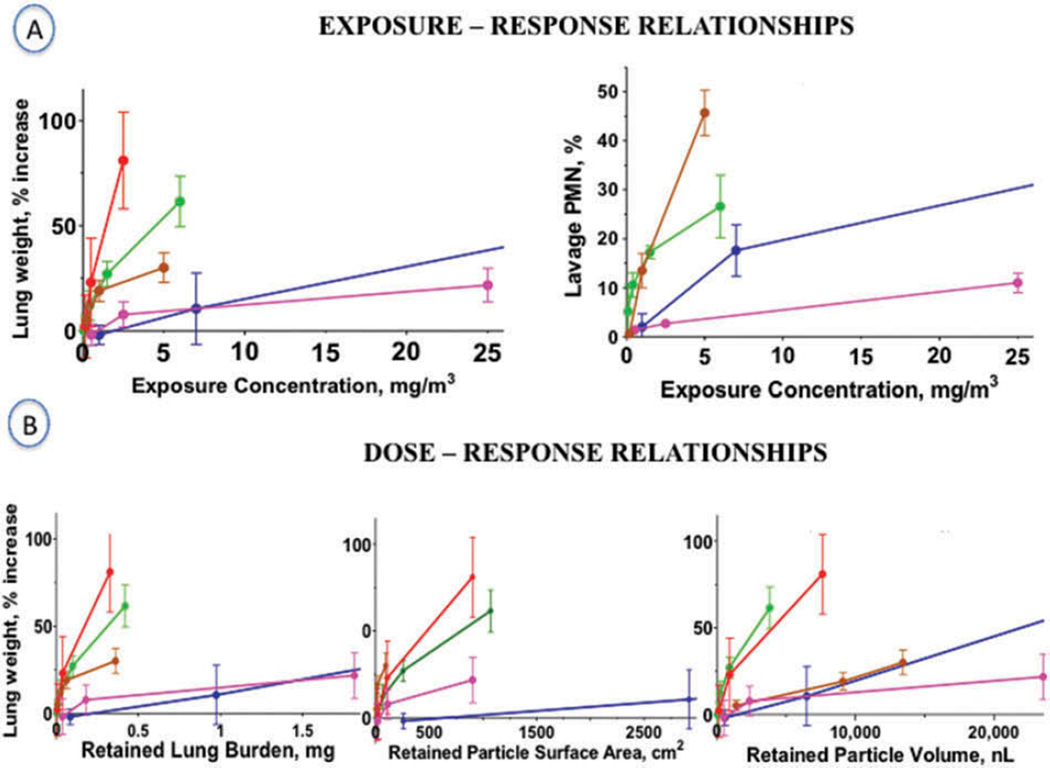
FIGURE 4 Exposure-Response and Dose-Response Exposure-Response and Dose-Response relationships of five 3-month inhalation studies in rats with MWCNT, CNF and CB. The carbon black (CB) study is added as a well studied low toxicity particle for comparison. Percent increase in lung lavage neutrophils (PMN) and retained lung dose were not reported for all of the five subchronic rat inhalation studies. Thus, to approximate retained lung burden of the MWCNT study by Ma-Hock et al. and for the CNF study by DeLorme et al., deposited and retained doses were calculated with the MPPD model, Version 2.90.3, using MMAD and GSD data and the packing density of the materials provided by the authors and a normal rat-specific pulmonary retention halftime (T1/2) of 70 days as model inputs. This T1/2 is appropriate for the rats exposed to the lower concentrations; for the high concentrations and resulting high lung burdens, a prolongation of T1/2 has to be expected (for example, as determined by Pauluhn et al., 2010, Table 3). Therefore, the lung burdens calculated for the high dose groups of these two studies are likely underestimated. The x-axes have been truncated to better separate the individual MWCNT/CNF data, although as a consequence the high exposure/date points could not be displayed. A: Lung weight and lung lavage neutrophil exposure-responses. B: Lung weight dose-responses based on retained lung burden expressed as mass, surface area and volume of the retained material. - MWCNT (Pauluhn, 2010); - MWCNT (Ma-Hock et al., 2009a); - CNF (DeLorme et al., 2012); - CB (Elder et al., 2005); - MWCNT (Kasai et al., 2015).
FIGURE 4 Exposure-Response and Dose-Response Exposure-Response and Dose-Response relationships of five 3-month inhalation studies in rats with MWCNT, CNF and CB. The carbon black (CB) study is added as a well studied low toxicity particle for comparison. Percent increase in lung lavage neutrophils (PMN) and retained lung dose were not reported for all of the five subchronic rat inhalation studies. Thus, to approximate retained lung burden of the MWCNT study by Ma-Hock et al. and for the CNF study by DeLorme et al., deposited and retained doses were calculated with the MPPD model, Version 2.90.3, using MMAD and GSD data and the packing density of the materials provided by the authors and a normal rat-specific pulmonary retention halftime (T1/2) of 70 days as model inputs. This T1/2 is appropriate for the rats exposed to the lower concentrations; for the high concentrations and resulting high lung burdens, a prolongation of T1/2 has to be expected (for example, as determined by Pauluhn et al., 2010, Table 3). Therefore, the lung burdens calculated for the high dose groups of these two studies are likely underestimated. The x-axes have been truncated to better separate the individual MWCNT/CNF data, although as a consequence the high exposure/date points could not be displayed. A: Lung weight and lung lavage neutrophil exposure-responses. B: Lung weight dose-responses based on retained lung burden expressed as mass, surface area and volume of the retained material. - MWCNT (Pauluhn, 2010); - MWCNT (Ma-Hock et al., 2009a); - CNF (DeLorme et al., 2012); - CB (Elder et al., 2005); - MWCNT (Kasai et al., 2015).CC BY-NC · PubMed Central
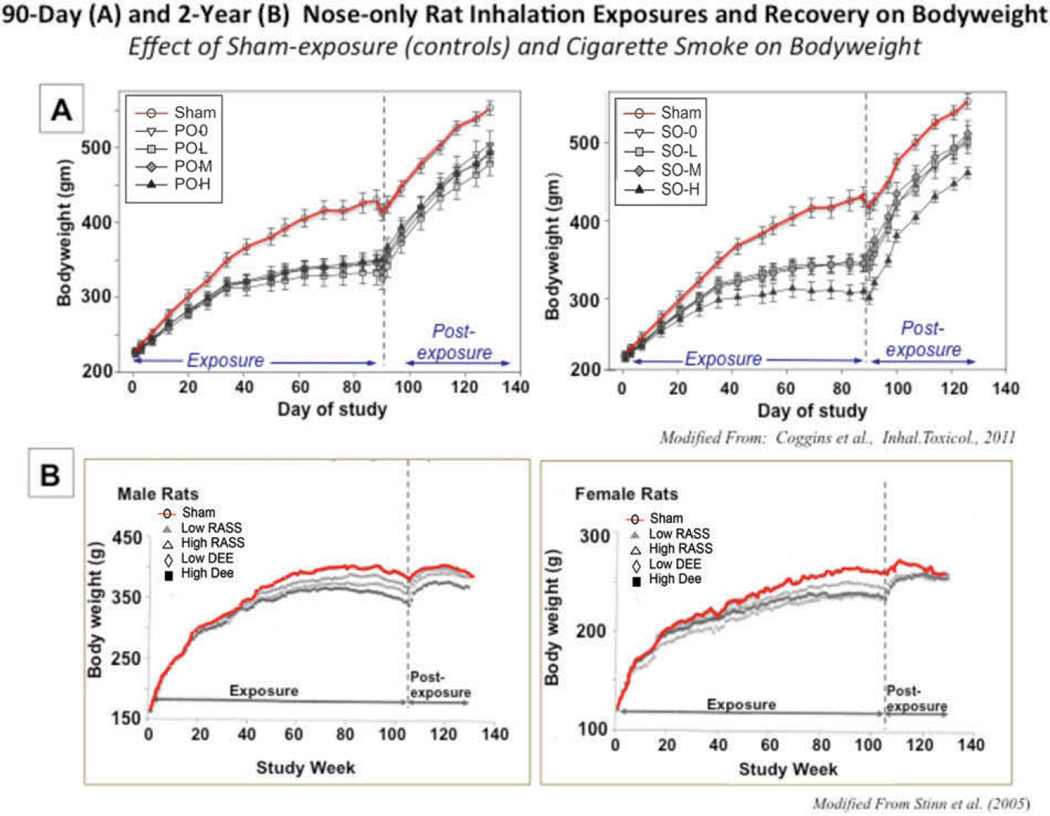
FIGURE 5 MWCNT aerosol size distribution in rodent inhalation study A: Subchronic inhalation of different types of cigarettes and air-exposed controls in nose-only tubes. B: Chronic inhalation of different types of cigarette smoke and diesel engine exhaust and air-exposed controls in nose-only tubes. Note: Effect of restraint stress on bodyweight in sham (clean air) exposed controls, highlighted in red.
FIGURE 5 MWCNT aerosol size distribution in rodent inhalation study A: Subchronic inhalation of different types of cigarettes and air-exposed controls in nose-only tubes. B: Chronic inhalation of different types of cigarette smoke and diesel engine exhaust and air-exposed controls in nose-only tubes. Note: Effect of restraint stress on bodyweight in sham (clean air) exposed controls, highlighted in red.CC BY-NC · PubMed Central
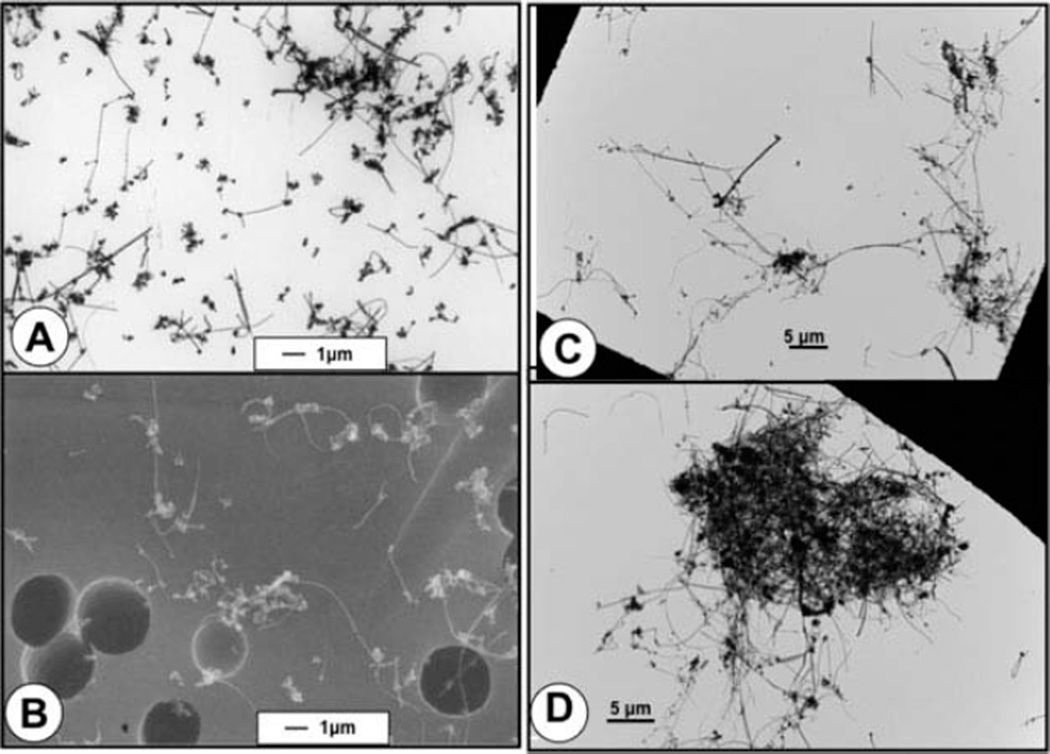
FIGURE 6 MWCNT aerosols collected in rodent inhalation study Aerosolized MWCNT collected on filter (A, B) and carbon-coated 200 mesh N: grids (C, D). The MWCNT were aerosolized using an acoustic aerosol generation system (McKinney, Chen, and Frazer 2009) for dry powder generation. Large variations of the airborne structures were observed, ranging from a few single tubes to differently-sized structures of agglomerated CNT to larger tangles resulting in an airborne size distribution as shown in Figure 5. The aerodynamic, settling and diffusional behavior cannot be inferred from these pictures; the large tangle in section D may not be inhalable by rodents and is likely not respirable, but can be estimated from their aerodynamic size distribution. Such experimentally generated MWCNT aerosol for rodent exposures needs to be compared to atmospheres found at workplaces. (See Figures 1, 2).
FIGURE 6 MWCNT aerosols collected in rodent inhalation study Aerosolized MWCNT collected on filter (A, B) and carbon-coated 200 mesh N: grids (C, D). The MWCNT were aerosolized using an acoustic aerosol generation system (McKinney, Chen, and Frazer 2009) for dry powder generation. Large variations of the airborne structures were observed, ranging from a few single tubes to differently-sized structures of agglomerated CNT to larger tangles resulting in an airborne size distribution as shown in Figure 5. The aerodynamic, settling and diffusional behavior cannot be inferred from these pictures; the large tangle in section D may not be inhalable by rodents and is likely not respirable, but can be estimated from their aerodynamic size distribution. Such experimentally generated MWCNT aerosol for rodent exposures needs to be compared to atmospheres found at workplaces. (See Figures 1, 2).CC BY-NC · PubMed Central
FIGURE 7 MWCNT aerosols collected in rodent inhalation study Aerosolized MWCNT collected on filter (A, B) and carbon-coated 200 mesh N: grids (C, D). The MWCNT were aerosolized using an acoustic aerosol generation system (McKinney et al., 2009) for dry powder generation. Large variations of the airborne structures were observed, ranging from a few single tubes to differently-sized structures of agglomerated CNT to larger tangles resulting in an airborne size distribution as shown in Figure 8. The aerodynamic, settling and diffusional behavior cannot be inferred from these pictures; the large tangle in section D may not be inhalable by rodents and is likely not respirable, but the aerodynamic behavior can be estimated from their aerodynamic size distribution. Such experimentally generated MWCNT aerosol for rodent exposures needs to be compared to atmospheres found at workplaces. (See Figures 1, 2).
FIGURE 7 MWCNT aerosols collected in rodent inhalation study Aerosolized MWCNT collected on filter (A, B) and carbon-coated 200 mesh N: grids (C, D). The MWCNT were aerosolized using an acoustic aerosol generation system (McKinney et al., 2009) for dry powder generation. Large variations of the airborne structures were observed, ranging from a few single tubes to differently-sized structures of agglomerated CNT to larger tangles resulting in an airborne size distribution as shown in Figure 8. The aerodynamic, settling and diffusional behavior cannot be inferred from these pictures; the large tangle in section D may not be inhalable by rodents and is likely not respirable, but the aerodynamic behavior can be estimated from their aerodynamic size distribution. Such experimentally generated MWCNT aerosol for rodent exposures needs to be compared to atmospheres found at workplaces. (See Figures 1, 2).CC BY-NC · PubMed Central
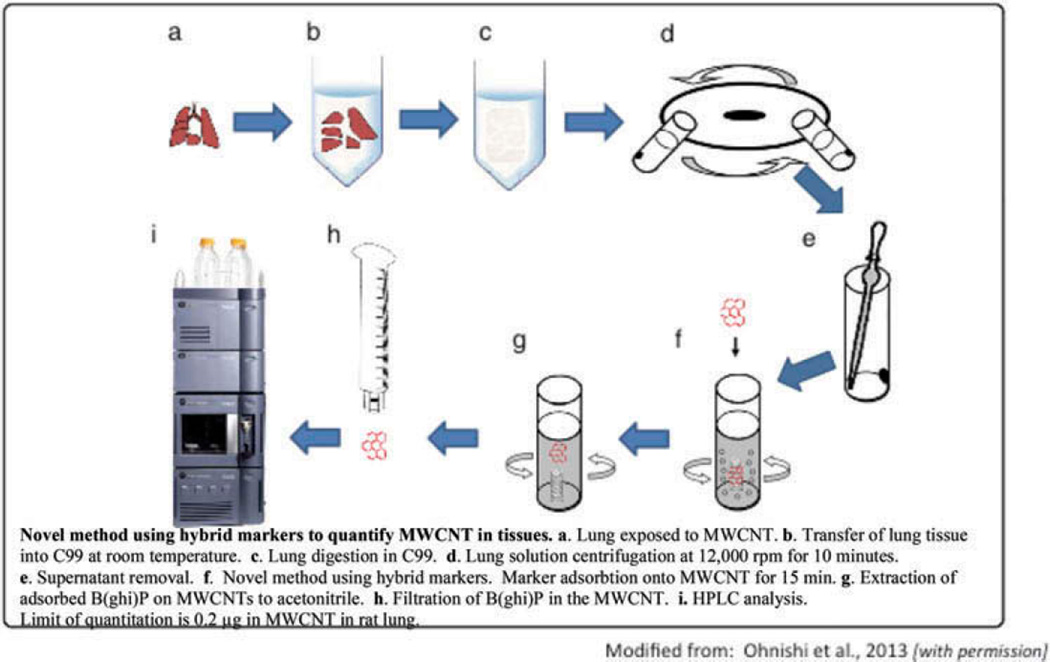
FIGURE 8 Novel method using hybrid markers to quantify MWCNT in tissues. a. Lung exposed to MWCNT. b. Transfer of lung tissue into C99 at room temperature. c. Lung digestion in C99. d. Lung solution centrifugation at 12,000 rpm for 10 minutes. e. Supernatant removal. f. Novel method using hybrid markers. Marker adsorbtion onto MWCNT for 15 min. g. Extraction of adsorbed B(ghi)P on MWCNTs to acetonitrile. h. Filtration of B(Ghi)P in the MWCNT. i. HPLC analysis. Limit of quantitation is 0.2 µg in MWCNT in rat lung.
FIGURE 8 Novel method using hybrid markers to quantify MWCNT in tissues. a. Lung exposed to MWCNT. b. Transfer of lung tissue into C99 at room temperature. c. Lung digestion in C99. d. Lung solution centrifugation at 12,000 rpm for 10 minutes. e. Supernatant removal. f. Novel method using hybrid markers. Marker adsorbtion onto MWCNT for 15 min. g. Extraction of adsorbed B(ghi)P on MWCNTs to acetonitrile. h. Filtration of B(Ghi)P in the MWCNT. i. HPLC analysis. Limit of quantitation is 0.2 µg in MWCNT in rat lung.CC BY-NC · PubMed Central
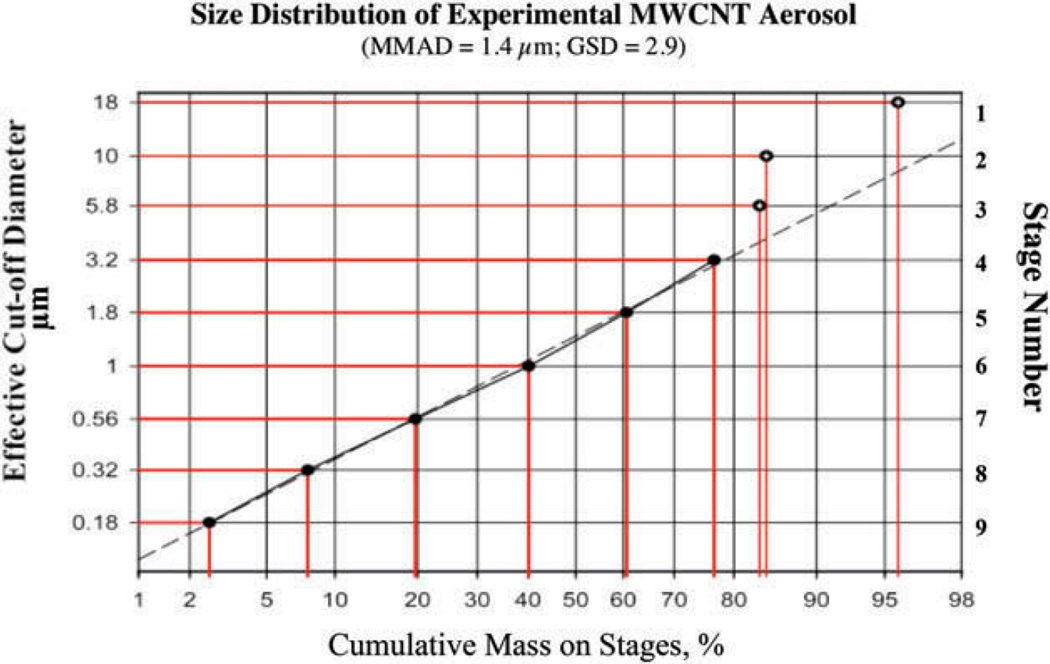
FIGURE 9 MWCNT aerosol size distribution in rodent inhalation study MWCNT aerosol size distribution as determined by a nano-MOUDI through weighing of deposits on the individual stages. The aerosol was generated with an acoustic aerosol generation system (Fig. 6) and collected with a 13-stage nano-MOUDI (NanoMoudi-II™ Model 125A, MSP Corp., Shoreview, MN) for 10 minutes at a flow rate of 10 l/min. Lower stages (10–13) were removed because deposits could not be reliably weighed; they contained less than 2% of the total mass. Larger structures with aerodynamic sizes >5 µm contribute much of the total mass concentration of the aerosol, but not to the deposition in the lower respiratory tract of rodents. Thus, describing a CNT/CNF aerosol exposure only by its total airborne mass concentration can be highly misleading when used as comparison to a human exposure concentration. Concepts of dosimetric rodent to human extrapolation discussed in this document have to be taken into consideration. Placing a cyclone separator in line before the aerosol enters the inhalation chamber may eliminate the non-inhalable tangles. On the other hand, if such larger structures are still inhalable by humans and if they are present at the workplace, it could be considered to use intratracheal inhalation (Oberdörster et al., 1997) in rats to circumvent the upper respiratory tract. However, intratracheal inhalation requires anesthesia of rats and is not recommended for day-to- day repeat exposures.
FIGURE 9 MWCNT aerosol size distribution in rodent inhalation study MWCNT aerosol size distribution as determined by a nano-MOUDI through weighing of deposits on the individual stages. The aerosol was generated with an acoustic aerosol generation system (Fig. 6) and collected with a 13-stage nano-MOUDI (NanoMoudi-II™ Model 125A, MSP Corp., Shoreview, MN) for 10 minutes at a flow rate of 10 l/min. Lower stages (10–13) were removed because deposits could not be reliably weighed; they contained less than 2% of the total mass. Larger structures with aerodynamic sizes >5 µm contribute much of the total mass concentration of the aerosol, but not to the deposition in the lower respiratory tract of rodents. Thus, describing a CNT/CNF aerosol exposure only by its total airborne mass concentration can be highly misleading when used as comparison to a human exposure concentration. Concepts of dosimetric rodent to human extrapolation discussed in this document have to be taken into consideration. Placing a cyclone separator in line before the aerosol enters the inhalation chamber may eliminate the non-inhalable tangles. On the other hand, if such larger structures are still inhalable by humans and if they are present at the workplace, it could be considered to use intratracheal inhalation (Oberdörster et al., 1997) in rats to circumvent the upper respiratory tract. However, intratracheal inhalation requires anesthesia of rats and is not recommended for day-to- day repeat exposures.CC BY-NC · PubMed Central
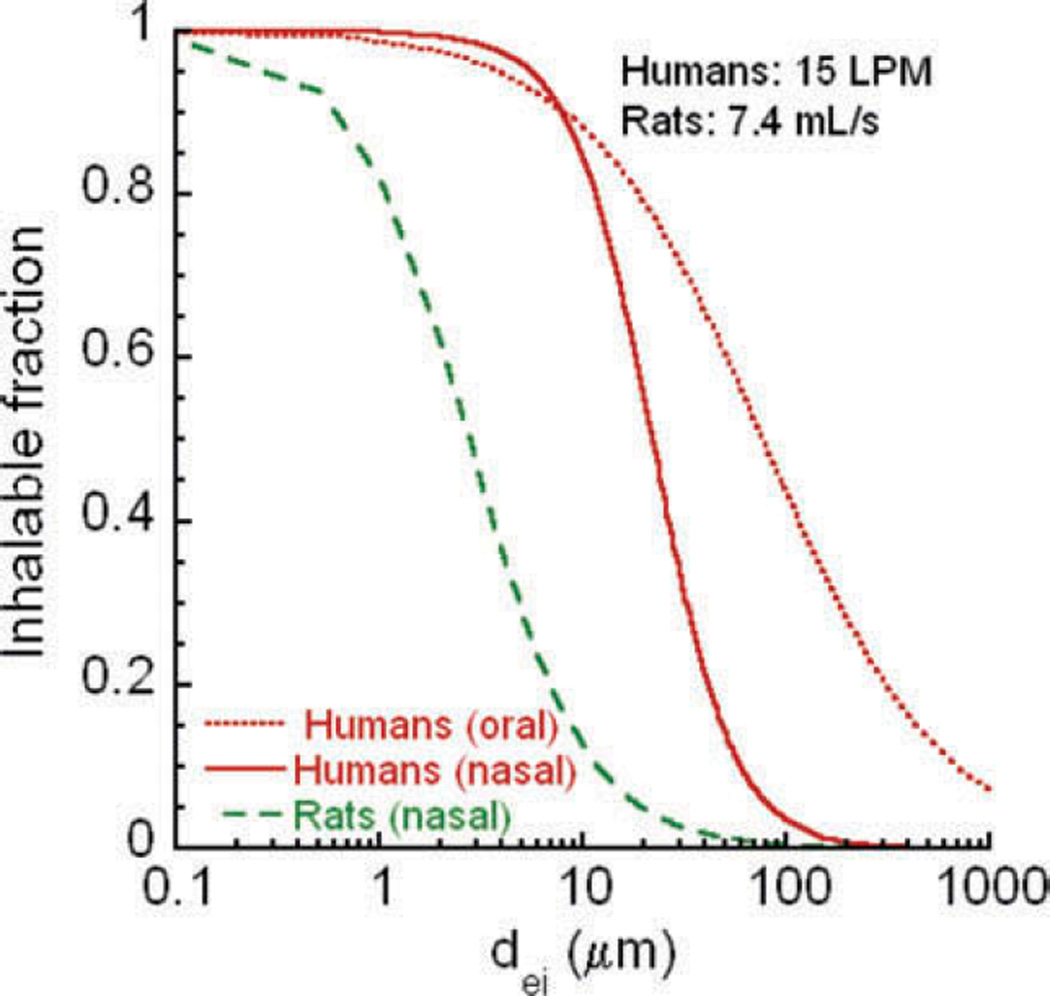
FIGURE A-1 CNT/CNF inhalability for humans and rats CNT/CNF inhalability for humans via oral and nasal, and rats nasal breathings. Equivalent impaction diameter in the figure includes shape and orientation effects. dei is found from Equation (1) for cylindrical shapes. Additional size measurements are needed to develop more realistic models of dei for CNT/CNF which, while being elongated, generally are not cylindrical.
FIGURE A-1 CNT/CNF inhalability for humans and rats CNT/CNF inhalability for humans via oral and nasal, and rats nasal breathings. Equivalent impaction diameter in the figure includes shape and orientation effects. dei is found from Equation (1) for cylindrical shapes. Additional size measurements are needed to develop more realistic models of dei for CNT/CNF which, while being elongated, generally are not cylindrical.CC BY-NC · PubMed Central
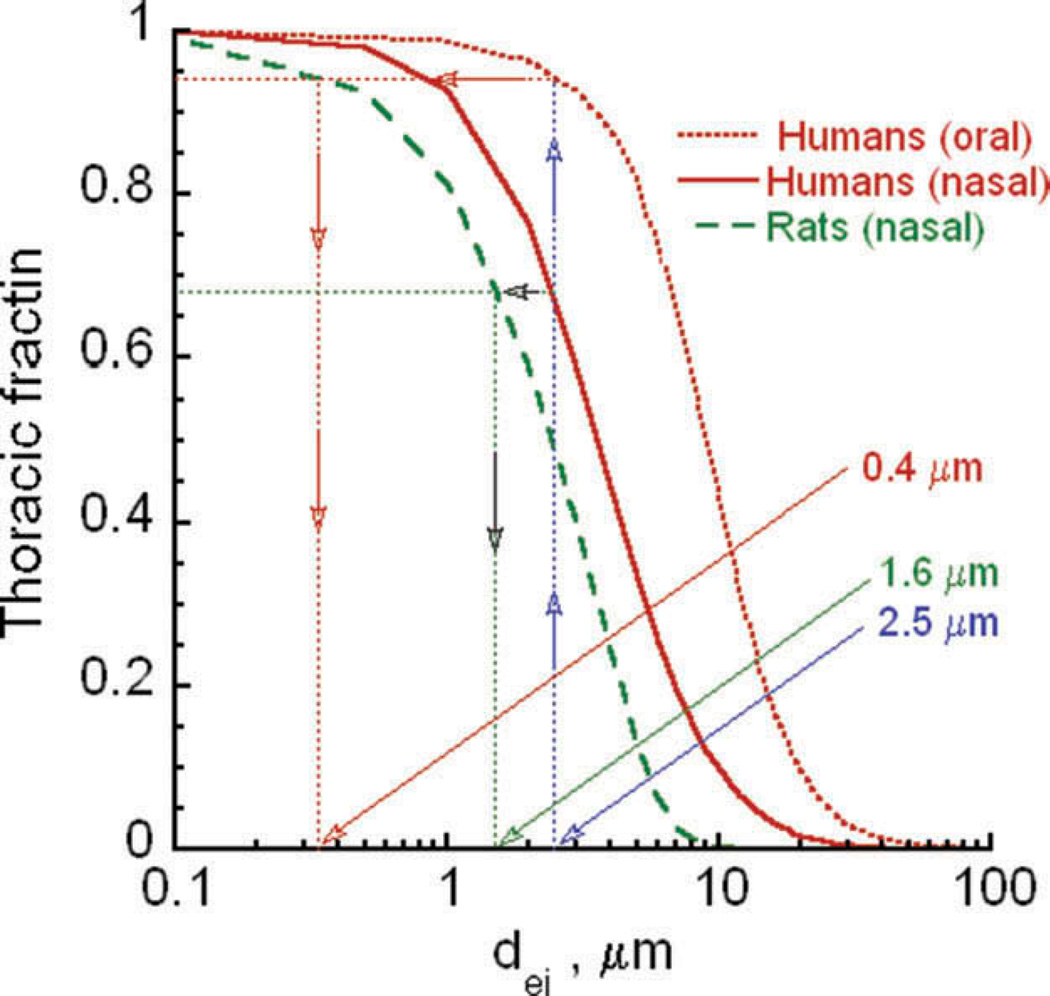
FIGURE B-1 CNT/CNF thoracic fractions for humans and rats CNT/CNF Thoracic fraction for different sizes for humans and rats at minute ventilations of 15 LPM and 7.4 mL/s, respectively.
FIGURE B-1 CNT/CNF thoracic fractions for humans and rats CNT/CNF Thoracic fraction for different sizes for humans and rats at minute ventilations of 15 LPM and 7.4 mL/s, respectively.CC BY-NC · PubMed Central
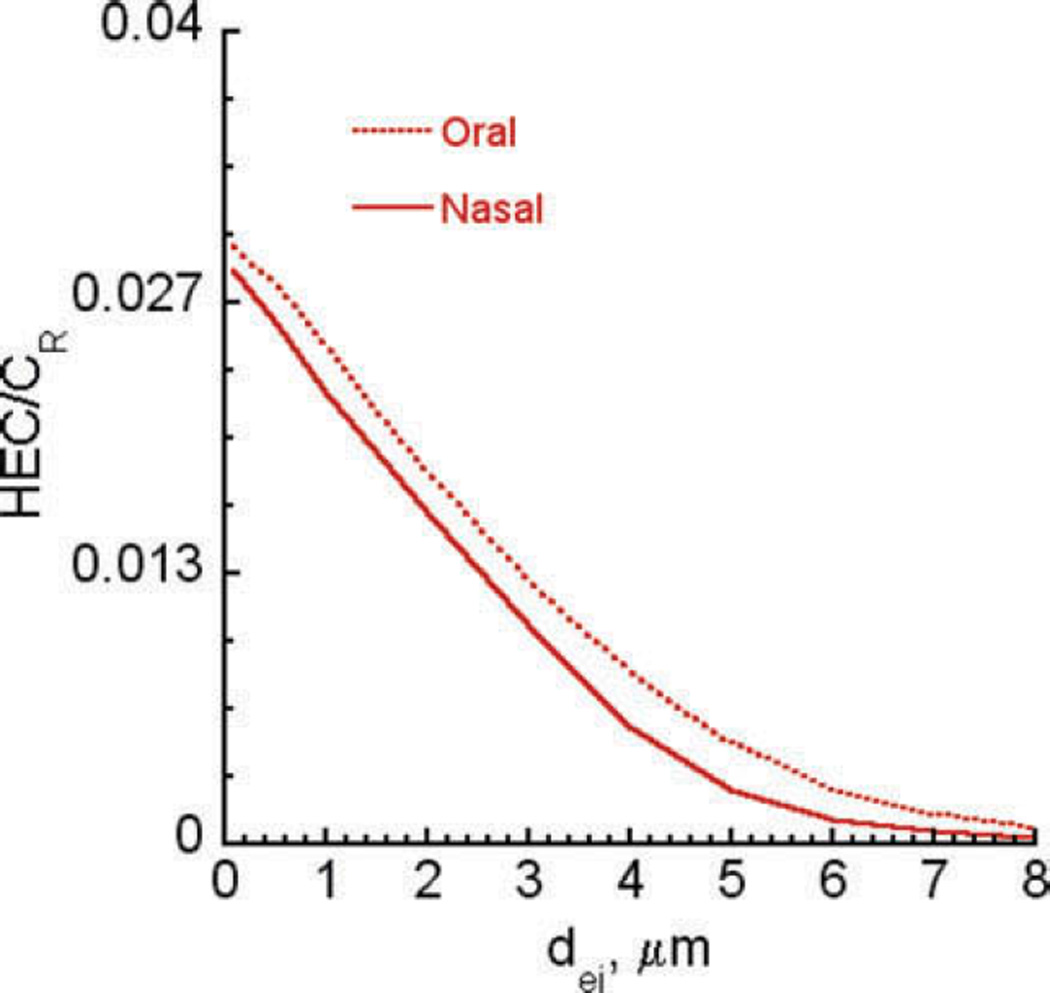
FIGURE B-2 Human to rat ratios for equal thoracic fractions Ratio of human equivalent concentration to rat exposure concentration based on equal thoracic fractions for minute ventilations of 15 LPM and 7.4 mL/s in humans and rats respectively.
FIGURE B-2 Human to rat ratios for equal thoracic fractions Ratio of human equivalent concentration to rat exposure concentration based on equal thoracic fractions for minute ventilations of 15 LPM and 7.4 mL/s in humans and rats respectively.CC BY-NC · PubMed Central
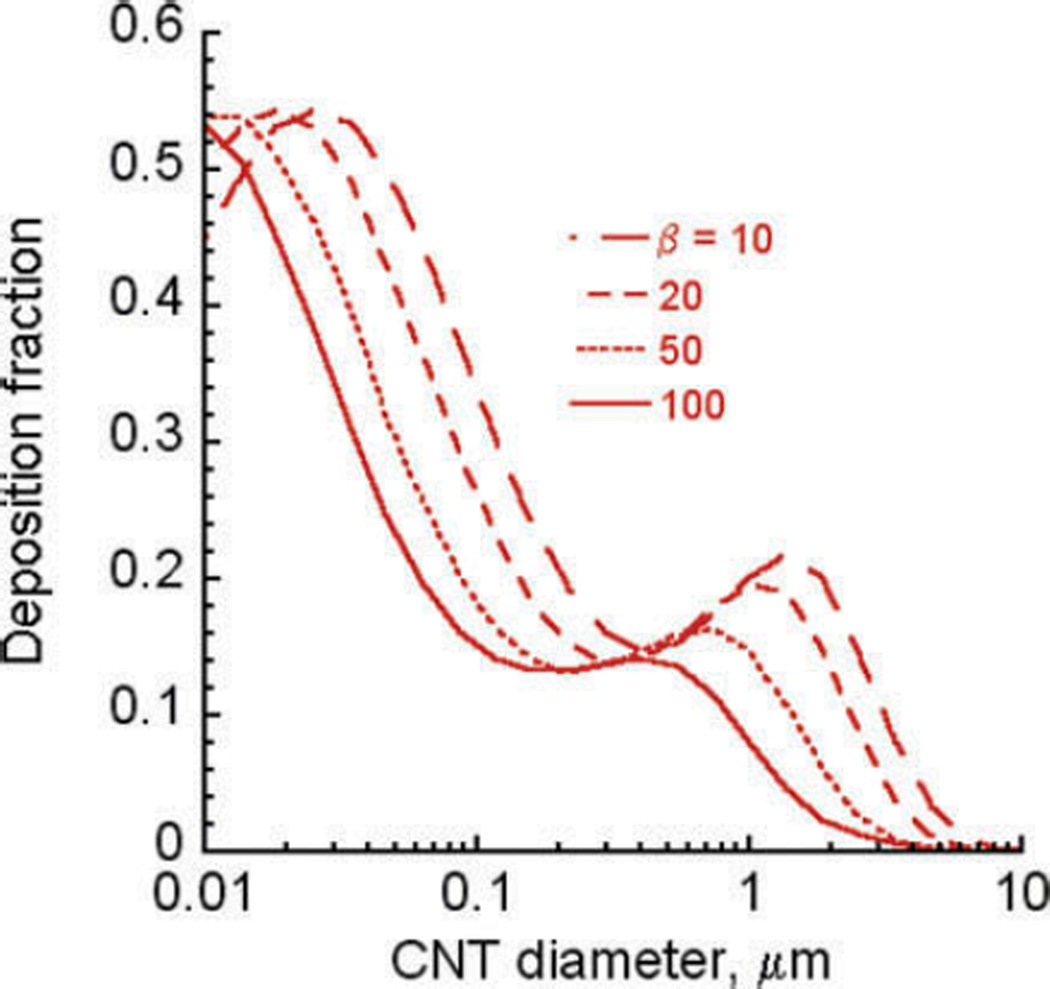
FIGURE B-3 CNT/CNF respiratory fractions for humans at different aspect ratios CNT/CNF deposition fraction in the human lung via nasal breathing for different aspect ratios. A minute ventilation of 7.5 LMP is used in the calculations.
FIGURE B-3 CNT/CNF respiratory fractions for humans at different aspect ratios CNT/CNF deposition fraction in the human lung via nasal breathing for different aspect ratios. A minute ventilation of 7.5 LMP is used in the calculations.CC BY-NC · PubMed Central
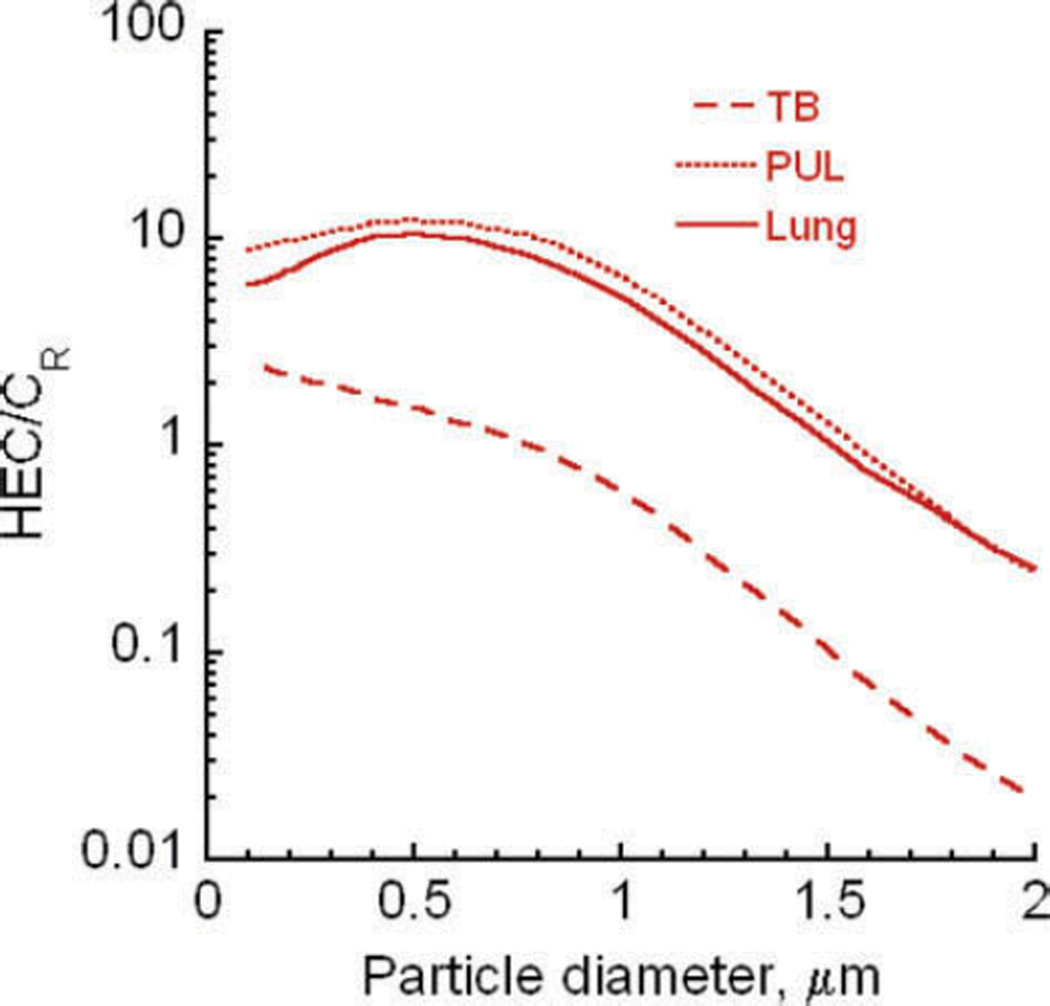
FIGURE B-4 HEC/CR ratios for CNT/CNF (100 nm—2 µm diameter) at aspect ratio of 10 Ratio of HEC/CR for different diameter CNT/CNF and aspect ratio of 10. Minute ventilations for humans and rats were 7.5 LPM and 0.241 LPM respectively.
FIGURE B-4 HEC/CR ratios for CNT/CNF (100 nm—2 µm diameter) at aspect ratio of 10 Ratio of HEC/CR for different diameter CNT/CNF and aspect ratio of 10. Minute ventilations for humans and rats were 7.5 LPM and 0.241 LPM respectively.CC BY-NC · PubMed Central

Verification

Claims the paper makes

The claims and statistics of this paper haven’t been checked yet.

Run the check — free, no account needed. It reads the open-access text and checks the sources it cites.

A few free checks a day · papers already verified open instantly · results are public

Claims other papers make about this one

Each is checked against this paper’s own text: does it say what the citing paper says it does?

Self-check

Percentages, sums and reported differences re-computed from the paper’s own numbers.

The self-check needs the paper’s full text.

Citations

Cites

Research works printed but not linked: 280

  1. ACGIH. 2010. 2010 TLVs® and BEIs®, Threshold limit values for chemical substances and physical agents & biological exposure indices. ACGIH Publications, Cincinnati, OH.
  2. 10.5491/SHAW.2011.2.1.65 · DOI
  3. 10.2486/indhealth.MS1129 · DOI
  4. 10.1016/S0021-8502(98)00762-9 · DOI
  5. 10.1021/nl802315h · DOI
  6. 10.1021/ja9083623 · DOI
  7. Asbach, C., H. Kaminski, D. Von Barany, T. A. J. Kuhlbusch, C. Monz, N. Dziurowitz, J. Pelzer, K. Vossen, K. Berlin, S. Dietrich, U. Götz, H.-J. Kiesling, R. Schierl, and D. Dahmann. 2012. Comparability of portable nanoparticle exposure monitors. Annals of Occupational Hygiene 56:606–21.
  8. 10.3109/10408444.2010.506638 · DOI
  9. 10.1080/02786820119122 · DOI
  10. 10.1093/toxsci/71.1.104 · DOI
  11. 10.1080/08958370600748687 · DOI
  12. Asgharian, B., and O. T. Price 2008. A predictive model of inhaled nanofibers/nanotubes deposition in the human lung. Final report submitted to CDC/NIOSH.
  13. 10.1186/1743-8977-11-5 · DOI
  14. 10.1021/bc034153y · DOI
  15. 10.1080/08958370801975303 · DOI
  16. Baumgartner, H., and C. R. E. Coggins. 1980. Description of a continuous smoking inhalation machine for exposing small animals to tobacco smoke. Beiträge zur Tabakforschung International 10:169–74.
  17. 10.1289/ehp.803447 · DOI
  18. 10.3109/08958378.2011.575413 · DOI · Paper page
  19. 10.1016/0003-4878(94)00108-D · DOI
  20. Berry, R. D., and F. Froude 1989. An investigation of wind conditions in the workplace to assess their effect on the quantity of dust inhaled. HSE Internal Report IR/L/DS/89/3, Health and Safety Executive, London, UK.
  21. 10.1093/annhyg/mer073 · DOI
  22. Bolton, R. E., J. H. Vincent, A. D. Jones, J. Addison, and S. T. Beckett. 1983. An overload hypothesis for pulmonary clearance of UICC amosite fibres inhaled by rats. British Journal of Industrial Medicine 40:264–72.
  23. 10.1289/ehp.1205693 · DOI
  24. 10.1136/oem.2006.029090 · DOI
  25. 10.1016/0013-9351(76)90107-9 · DOI
  26. 10.1080/02786829008959460 · DOI
  27. 10.1080/10937404.2011.556049 · DOI
  28. 10.1080/08958370500241296 · DOI
  29. Brunauer, S., P. H. Emmett, and E. Teller. 1938. Adsorption of gases in multimolecular layers J. Amer. Chem. Soc., 60:309 Contribution From the Bureau of Chemsitry and Soils and George Washington University.
  30. 10.1073/pnas.96.9.5182 · DOI
  31. 10.1080/15298668391405959 · DOI
  32. 10.1021/nl060548p · DOI
  33. CEN ISO/TS 27687. 2008. Nanotechnologies—Terminology and definitions for nano-objects—Nanoparticle, nanofiber and nanoplate. International Organization for Standardization, Geneva, Switzerland.
  34. 10.3109/08958379309034496 · DOI
  35. 10.3109/08958378.2010.543188 · DOI
  36. Coppeta, L., J. Legramante, A. Galante, A. J. Bergamashi, E. Bergamashi, A. Margrini, and A. Pietroiusti. 2007. Interaction between carbon nanotubes and cardiovascular autonomic nervous system regulation: Proposal of an animal model and preliminary findings. Giornale Italiano di Medicina del Lavoro Ergonomics 5:465–67.
  37. 10.1093/annhyg/mes079 · DOI
  38. Dahm, M. M., D. E. Evans, M. K. Schubauer-Berigan, M. E. Birch, and J. E. Fernback. 2012. Occupational exposure assessment in carbon nanotube and nanofiber primary and secondary manufacturers. Annals of Occupational Hygiene 56:542–56.
  39. 10.1126/science.1222453 · DOI
  40. 10.1093/toxsci/kfs172 · DOI
  41. 10.1080/08958370304454 · DOI
  42. 10.1093/toxsci/kfj130 · DOI · Paper page
  43. 10.1016/0378-4274(96)03752-6 · DOI · Paper page
  44. 10.1186/1743-8977-7-5 · DOI · Paper page
  45. 10.1021/ar300092y · DOI
  46. 10.1164/ajrccm/146.4.831 · DOI
  47. Doudrick K. N. Corson G. Oberdörster A. C. Eder P. Herckes R. U. Halden and P. Westerhoff. 2013. Extraction and quantification of carbon nanotubes in biological matrices with application to rat lung tissue. ACS Nano 02 September 2013. http://pubs.acs.org 7:8849–56. doi:10.1021/nn403302s. · DOI
  48. 10.1093/toxsci/55.1.24 · DOI · Paper page
  49. 10.1080/08958370701479323 · DOI · Paper page
  50. 10.1093/toxsci/kfm217 · DOI
  51. 10.1093/toxsci/kfi327 · DOI
  52. 10.1289/ehp.9030 · DOI
  53. 10.1002/(ISSN)1613-6829 · DOI
  54. EPA. 2000. OPPTS 870. 3465, US EPA health effects test guidelines, 90-day inhalation toxicity. EPA 712-C-98-204. Washington, DC: Environmental Protection Agency.
  55. EPA. 2001. OPPTS 870. 8355,US EPA health effects test guidelines, combined chronic toxicity/carcinogenicity testing of repirable fibrous particles. EPA 712-C01-352, July Washington, DC: Environmental Protection Agency.
  56. EPA. 2004. Air quality criteria for particulate matter. EPA/600/P-99/002aF; EPA/600/P-99/002bF, October. Washington, DC: Environmental Protection Agency.
  57. 10.1021/nl801828z · DOI
  58. 10.3109/17435390903428851 · DOI
  59. 10.1093/annhyg/meq015 · DOI
  60. 10.1016/S0021-9258(18)31631-4 · DOI
  61. 10.1021/tx800100s · DOI
  62. 10.1289/ehp.7962 · DOI
  63. 10.3109/17435390.2010.509519 · DOI · Paper page
  64. 10.1080/02786820903002423 · DOI
  65. 10.1186/1477-3155-8-31 · DOI
  66. 10.1186/1743-8977-9-17 · DOI
  67. 10.1016/0034-5687(78)90104-4 · DOI
  68. 10.1016/0959-8049(94)90299-2 · DOI
  69. 10.1021/js960032d · DOI
  70. 10.1016/S0168-3659(97)00194-6 · DOI
  71. Goodglick A. and A. B. Kane 1996. The role of fiber length in crocidolite abestos toxicity in vitro and in vivo. VIIth International Pneumoconioses Conference Pittsburgh Pennsylvania.
  72. 10.1017/CBO9780511565595 · DOI
  73. 10.1093/rpd/ncq314 · DOI
  74. Grosse, Y., K. Z. Guyton, B. Lauby-Secretan, F. El Ghissassi, V. Bouvard, L. Benbrahim-Tallaa, N. Guha, C. Scoccianti, H. Mattock, and K. Straif, on behalf of the IARC Monograph Working Group. 2014. Carcinogenicity of fluoro-edenite, silicon carbide fibres and whiskers, and carbon nanotubes. Lancet/Oncology 15:1427–28.
  75. 10.1080/15287394.2012.699852 · DOI
  76. 10.1080/08958370801942238 · DOI
  77. 10.3109/08958370903359984 · DOI
  78. 10.1080/15287394.2014.958421 · DOI
  79. 10.2147/IJN.S26573 · DOI
  80. 10.1080/10408430500406265 · DOI
  81. 10.1080/15298669091369790 · DOI
  82. 10.1080/15287398509530744 · DOI
  83. 10.1016/S0021-8502(98)00416-9 · DOI
  84. 10.3109/17435390.2011.553689 · DOI
  85. 10.1016/S0021-8502(99)00022-1 · DOI
  86. 10.1021/es061817g · DOI
  87. 10.2131/jts.33.381 · DOI
  88. 10.1080/08958370050029725 · DOI
  89. International Organization for Standardization. 2005b. ISO/IEC 17025. General requirements for the competence of testing and calibration laboratories.
  90. International Organization for Standardization. 2006. ISO guide 35: 2006: Reference materials—General and statistical principles for certification. Geneva, Switzerland: International Organization for Standardization.
  91. International Organization for Standardization. 2007. ISO/TR 27628. Workplace atmospheresUltrafine, nanoparticle and nano-structured aerosols—Inhalation exposure characterization and assessment.
  92. International Organization for Standardization. 2008. ISO/TR12885. Technical Report: Nanotechnologies—Health and safety practices in occupational settings relevant to nanotechnologies.
  93. International Organization for Standardization. 2009. ISO 15900. Determination of particle size distribution—Differential electrical mobility analysis for aerosol particles.
  94. International Organization for Standardization. 2010a. ISO Standard 10808. ISO/TC229—Nanotechnologies—Characterization of nanoparticles in inhalation exposure chambers for inhalation toxicity testing.
  95. International Organization for Standardization. 2010b. ISO/FDIS10801. Nanotechnologies—Generation of metal nanoparticles for inhalation toxicity testing using the evaporation/condensation method.
  96. 10.1080/08958370590929394 · DOI
  97. Johnson, D. R., M. M. Methner, A. J. Kennedy, and J. A. Steevens. 2010. Potential for occupational exposure to engineered carbon-based nanomaterials in environmental laboratory studies. Environmental Health Perspectives 118:44–54. · DOI
  98. 10.1016/j.toxlet.2006.02.001 · DOI
  99. 10.3109/17435390.2011.611915 · DOI
  100. 10.3109/17435390.2013.766277 · DOI
  101. 10.3109/17435390.2014.933903 · DOI
  102. 10.1016/S0021-8502(01)00168-9 · DOI
  103. 10.1016/0021-8502(92)90004-F · DOI
  104. 10.1006/jtbi.1996.0347 · DOI
  105. 10.1161/01.CIR.0000118524.62298.E8 · DOI
  106. 10.3109/08958378.2014.953275 · DOI
  107. 10.1080/15287394.2010.511578 · DOI
  108. 10.3109/17435390903374019 · DOI
  109. Kim, Y. A., T. Hayashi, M. Endo, and M. Dresselhaus. 2013. Carbon nanofibers. In Springer handbook of nanomaterials, R. Vajtai ed., 233–62. Berlin, Germany: Springer-Verlag. · DOI
  110. 10.1006/taap.1997.8206 · DOI
  111. 10.1016/j.carbon.2013.11.042 · DOI
  112. 10.3109/17435390.2011.606926 · DOI
  113. 10.1016/j.tox.2010.07.021 · DOI
  114. 10.1088/0031-9155/30/6/004 · DOI
  115. 10.1016/j.addr.2013.07.007 · DOI
  116. 10.2486/indhealth.47.533 · DOI
  117. 10.1080/08958370902942517 · DOI
  118. 10.1080/02786820802590510 · DOI
  119. 10.1088/0957-4484/17/14/042 · DOI
  120. 10.1016/j.elstat.2006.10.012 · DOI
  121. 10.1007/s11051-012-1029-8 · DOI
  122. 10.1006/rtph.2001.1479 · DOI
  123. Lam, G.-W., J. T. James, R. McCluskey, and R. L. Hunter. 2004. Pulmonary toxicity of single-wall carbon nanotubes in mice 7 and 90 days after intratracheal instillation. Toxicological Sciences 77:125–34.
  124. 10.1080/15287390903232467 · DOI
  125. Lee, K. P., H. J. Trochimowcz, and C. F. Reinhardt 1985. Pulmonary response of rats exposed to titanium dioxide (TiO2) by inhalation for two years. Toxicology and Applied Pharmacology 79: 179–192.
  126. 10.3109/08958370903367359 · DOI
  127. 10.1177/0960327109105150 · DOI
  128. 10.1002/(ISSN)1522-7278 · DOI
  129. 10.1021/nn305567s · DOI
  130. 10.1289/ehp.9688 · DOI
  131. 10.1080/15287390903523378 · DOI
  132. 10.1007/s11051-008-9369-0 · DOI
  133. 10.1166/jnn.2010.2689 · DOI
  134. 10.1016/j.micromeso.2011.11.017 · DOI
  135. 10.1016/j.carbon.2010.02.002 · DOI
  136. 10.1080/08958370802361057 · DOI
  137. 10.1093/toxsci/kfp146 · DOI · Paper page
  138. 10.1186/1743-8977-3-15 · DOI
  139. 10.2131/jts.37.463 · DOI
  140. 10.1002/jat.2550060106 · DOI
  141. 10.1080/17435390701314720 · DOI
  142. Maynard, A. D., P. A. Baron, M. Foley, A. A. Shvedova, E. R. Kisin and V. Castranova. 2004. Exposure to carbon nanotube material: Aerosol release during the handling of unrefined single-walled carbon nanotube material. J. Toxicology & Environmental Health, Part A 67:87–107.
  143. 10.1080/15287390490253688 · DOI
  144. Maynard, A. D., B. K. Ku, M. Emery, M. R. Stolzenburg, and P. H. McMurry. 2006. Measuring particle size-dependent physiochemical structure in airborne single walled carbon nanotube agglomerates. Journal of Nanoparticle Research 9:865–92. · DOI
  145. 10.1080/089583799196754 · DOI · Paper page
  146. 10.1080/08958370802712713 · DOI
  147. 10.1080/02786826.2012.720397 · DOI
  148. 10.1016/0003-4878(95)00002-V · DOI
  149. 10.1186/1743-8977-7-28 · DOI
  150. 10.1186/1743-8977-8-21 · DOI
  151. 10.1152/ajplung.00186.2007 · DOI
  152. 10.1186/1743-8977-10-33 · DOI
  153. 10.1186/1743-8977-10-38 · DOI
  154. Mercer, R. R., J. F. Scabilloni, L. Wang, L. A. Battelli, and V. Castranova. 2009. Use of labeled single walled carbon nanotubes to study translocation from the lungs. Toxicologist 108:A2192.
  155. Mercer, R. R., J. F. Scabilloni, L. Wang, L. A. Battelli, and V. Castranova. 2010. Use of labeled single walled carbon modulates arteriolar sympathetic constriction: Role of nitric oxide, prostanoids, and α-adrenergic receptors. Toxicologist 114:A1728.
  156. 10.1080/15459620903508066 · DOI
  157. 10.3109/08958378.2014.925991 · DOI
  158. 10.3109/08958378.2013.850562 · DOI
  159. 10.3109/08958378.2011.603190 · DOI
  160. 10.1093/toxsci/kfm196 · DOI
  161. Moalli, P. A., J. L. MacDonald, L. A. Goodglick, and A. B. Kane. 1987. Acute injury and regeneration of the mesothelium in response to asbestos fibers. American Journal of Pathology 128:426–45.
  162. 10.1016/j.tube.2009.07.001 · DOI
  163. 10.3109/10915818609141024 · DOI
  164. 10.1016/0272-0590(88)90284-9 · DOI · Paper page
  165. 10.1006/faat.1996.0017 · DOI
  166. 10.1080/08958370500282555 · DOI
  167. 10.3109/08958379009145262 · DOI
  168. 10.1016/j.taap.2005.01.008 · DOI · Paper page
  169. 10.1093/toxsci/kfp100 · DOI
  170. 10.1016/j.ajpath.2011.02.040 · DOI
  171. 10.1186/1743-8977-9-10 · DOI
  172. 10.1007/s11051-008-9450-8 · DOI
  173. 10.1073/pnas.1110013108 · DOI · Paper page
  174. 10.1080/08958370390228592 · DOI · Paper page
  175. National Institute for Occupational Safety and Health. 2003. Elemental carbon (diesel particulate)—Method 5040. NIOSH manual of analytical methods, 4th ed., 2003 issue 3. NIOSH.
  176. National Institute for Occupational Safety and Health. 2013. Current Intelligence Bulletin 65: Occupational exposure to carbon nanotubes and nanofibers. NIOSH/CDC/Department of Health and Human Services. Atlanta: NIOSH/CDC.
  177. National Institute of Standards and Technology. 2012. Presentation, BERM-13 meeting, Vienna, Austria, June 2012: Development of nanoscale reference materials at NIST, presented by Stephen Wise (NIST).
  178. 10.1038/nmat2442 · DOI · Paper page
  179. 10.1006/faat.1997.2297 · DOI
  180. 10.1289/ehp.01109311 · DOI
  181. 10.1016/j.envint.2013.04.003 · DOI
  182. 10.1289/ehp.8413 · DOI
  183. 10.1186/1743-8977-5-1 · DOI
  184. 10.1093/toxsci/kfp051 · DOI
  185. 10.1097/00004032-198907001-00027 · DOI
  186. 10.1289/ehp.97105s51347 · DOI
  187. 10.1289/ehp.1104320 · DOI
  188. 10.3109/01902149709046045 · DOI
  189. 10.1289/ehp.94102s5173 · DOI
  190. 10.1093/annhyg/38.inhaled_particles_VII.295 · DOI
  191. 10.1186/1743-8977-2-8 · DOI · Paper page
  192. 10.1289/ehp.7339 · DOI · Paper page
  193. 10.1080/08958370490439597 · DOI · Paper page
  194. Organization for Economic Cooperation and Development. 2009a. OECD Guideline for the testing of chemicals, section 4: Health effects. Test no. 413: Subchronic inhalation toxicity: 90-Day study. Test Guideline 413 (TG 413), adopted 7 September.
  195. Organization for Economic Cooperation and Development. 2009b. Organization for Economic Cooperation and Development. 2009. Environment, health and safety publications, series on testing and assessment, no. 39: Guidance document on acute inhalation toxicity testing. ENV/JM/MONO 28. 21 July.
  196. Organization for Economic Cooperation and Development. 2010. OECD Environment, health and safety publications—Series on the safety of manufactured nanomaterials, no. 14: Guidance manual for the testing of manufactured nanomaterials: OECD’s sponsorship programme.
  197. Organization for Economic Cooperation and Development. 2012. OECD Environment, health and safety publications—Series on the safety of manufactured nanomaterials, no. 36. Guidance on sample preparaiton and dosimetry for the safety testing of manufactured nanomaterials.
  198. 10.1186/1745-6673-8-30 · DOI
  199. 10.3109/08958378.2011.608096 · DOI
  200. 10.1023/B:NANO.0000034657.71309.e6 · DOI

200 of 280 shown

Cited by

Sorted by citations

See all 150

Metadata

Authors
Oberdörster, G., Castranova, V., Asgharian, B., & Sayre, P.
Venue
Journal of Toxicology and Environmental Health, Part B
Published
2015-05-19
Volume
18
Issue
3-4
Pages
121-212
ISSN
  • 1093-7404
  • 1521-6950
Cited by
150
References
6
Language
en

About these checks

Registry, retraction, Cites and statistics results are computed, not judged, with one exception: a printed reference that no index lists is read once by a model before it counts as a citation error. Claims are extracted by a model and kept only when their quote appears verbatim in the text; each cited source is then checked, with a model’s help, for whether it says what the claim relies on. Those verdicts can be wrong — read the claim’s quote and the cited source before relying on one.

Statistics and arithmetic are recomputed, not judged.

Confidence bands are shown only for fields calibrated on our annotated test set. None is calibrated yet, so no band is shown.

What counts as a claim ›How we measure confidence ›How we check this ›

Are you an author, or do you see a problem with this page? Request a review