

The DOI matches its Crossref record; 24 of the 24 references it cites were found in a registry or an index.
Mitophagy is required for mitochondrial biogenesis and myogenic differentiation of C2C12 myoblasts
Open accessAbstract
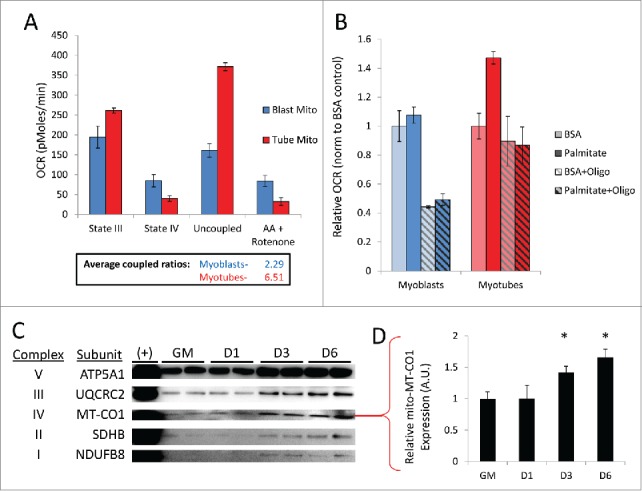
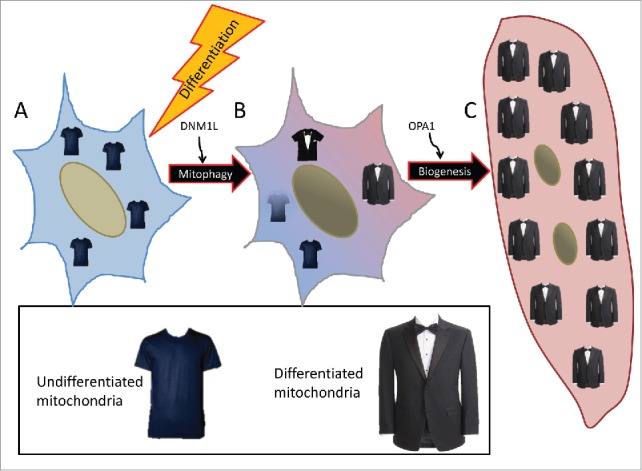
Myogenesis is a crucial process governing skeletal muscle development and homeostasis. Differentiation of primitive myoblasts into mature myotubes requires a metabolic switch to support the increased energetic demand of contractile muscle. Skeletal myoblasts specifically shift from a highly glycolytic state to relying predominantly on oxidative phosphorylation (OXPHOS) upon differentiation. We have found that this phenomenon requires dramatic remodeling of the mitochondrial network involving both mitochondrial clearance and biogenesis. During early myogenic differentiation, autophagy is robustly upregulated and this coincides with DNM1L/DRP1 (dynamin 1-like)-mediated fragmentation and subsequent removal of mitochondria via SQSTM1 (sequestosome 1)-mediated mitophagy. Mitochondria are then repopulated via PPARGC1A/PGC-1α (peroxisome proliferator-activated receptor gamma, coactivator 1 alpha)-mediated biogenesis. Mitochondrial fusion protein OPA1 (optic atrophy 1 [autosomal dominant]) is then briskly upregulated, resulting in the reformation of mitochondrial networks. The final product is a myotube replete with new mitochondria. Respirometry reveals that the constituents of these newly established mitochondrial networks are better primed for OXPHOS and are more tightly coupled than those in myoblasts. Additionally, we have found that suppressing autophagy with various inhibitors during differentiation interferes with myogenic differentiation. Together these data highlight the integral role of autophagy and mitophagy in myogenic differentiation.
Overview
The claims and statistics of this paper haven’t been checked yet.
Run the check — free, no account needed. It reads the open-access text and checks the sources it cites.
Integrity signals
Registry
Cites
Statistics
Figures
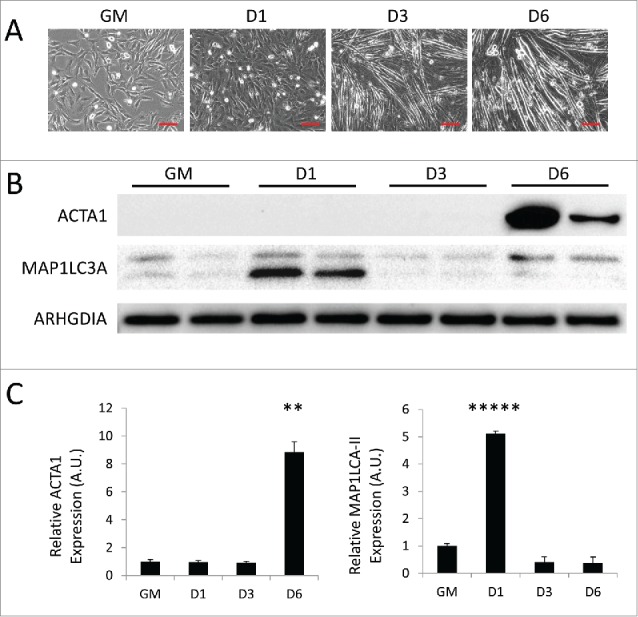
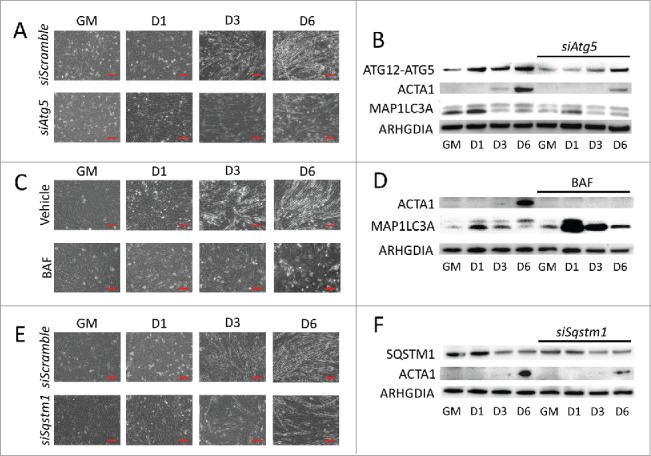
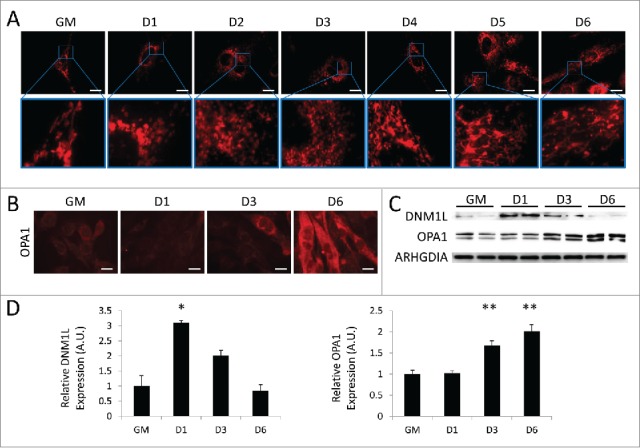
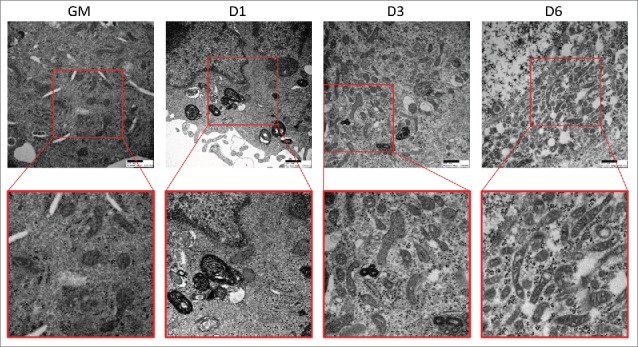
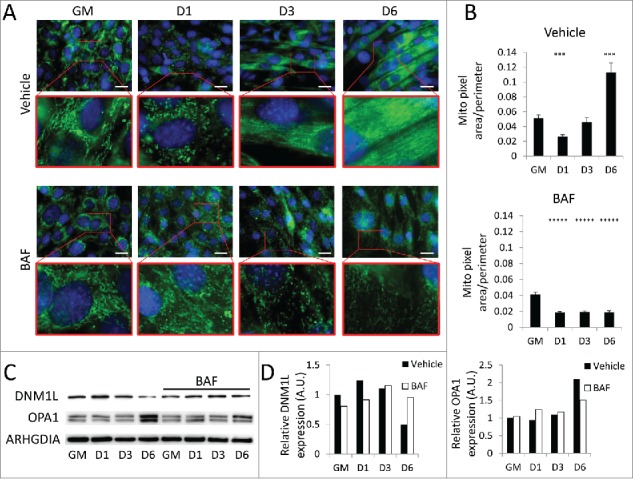
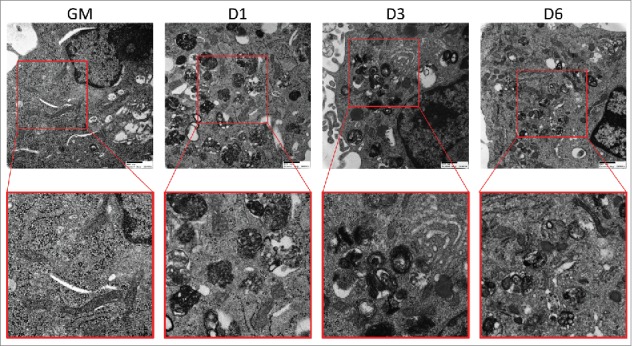
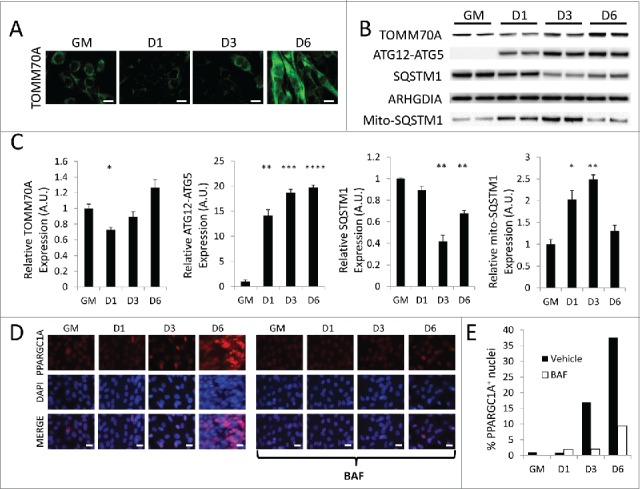
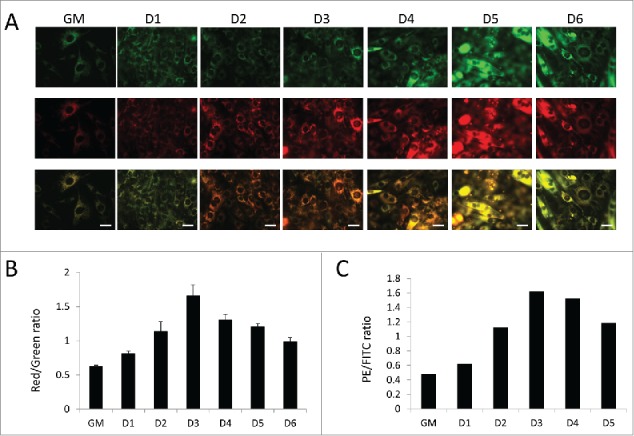
Verification
Claims the paper makes
The claims and statistics of this paper haven’t been checked yet.
Run the check — free, no account needed. It reads the open-access text and checks the sources it cites.
Claims other papers make about this one
Each is checked against this paper’s own text: does it say what the citing paper says it does?
The cited source says what the claim attributes to it.
In the citing paper
“autophagy is critical for mitochondrial remodeling and function in skeletal muscle cells in vitro (Sin et al., 2016)”
From Skeletal Muscle Ribosome and Mitochondrial Biogenesis in Response to Different Exercise Training Modalities (2021) · cites this paper as Sin et al., 2016
Self-check
Percentages, sums and reported differences re-computed from the paper’s own numbers.
The self-check needs the paper’s full text.
Citations
Cites
Autophagy in mammalian development and differentiation
Mizushima, N., & Levine, B. (2010) · Nature Cell Biology · doi:10.1038/ncb0910-823 · Cited by 1,555
Defective Hepatic Autophagy in Obesity Promotes ER Stress and Causes Insulin Resistance
Yang, L., Li, P., Fu, S., Calay, E. S., & Hotamisligil, G. S. (2010) · Cell Metabolism · doi:10.1016/j.cmet.2010.04.005 · Cited by 1,274
Notch-Mediated Restoration of Regenerative Potential to Aged Muscle
Conboy, I. M., Conboy, M. J., Smythe, G. M., & Rando, T. A. (2003) · Science · doi:10.1126/science.1087573 · Cited by 1,121
Folmes, C. D. L., Nelson, T. J., Martinez‐Fernandez, A., Arrell, D. K., Lindor, J. Z., Dzeja, P. P., Ikeda, Y., Pérez-Terzic, C. M., & Terzic, A. (2011) · Cell Metabolism · doi:10.1016/j.cmet.2011.06.011 · Cited by 980
AGE‐RELATED CHANGES IN THE STRUCTURE AND FUNCTION OF SKELETAL MUSCLES
Faulkner, J. A., Larkin, L. M., Claflin, D. R., & Brooks, S. V. (2007) · Clinical and Experimental Pharmacology and Physiology · doi:10.1111/j.1440-1681.2007.04752.x · Cited by 802
Endogenous Drp1 Mediates Mitochondrial Autophagy and Protects the Heart Against Energy Stress
Ikeda, Y., Shirakabe, A., Maejima, Y., Zhai, P., Sciarretta, S., Toli, J., Nomura, M., Mihara, K., Egashira, K., Ohishi, M., et al. (2015) · Circulation Research · doi:10.1161/circresaha.116.303356 · Cited by 571
Autophagy and aging: keeping that old broom working
Cuervo, A. M. (2008) · Trends in Genetics · doi:10.1016/j.tig.2008.10.002 · Cited by 527
In vivo satellite cell activation via Myf5 and MyoD in regenerating mouse skeletal muscle
Cooper, R. N., Tajbakhsh, S., Mouly, V., Cossu, G., BUCKINGHAM, M. E., & Butler-Browne, G. S. (1999) · Journal of Cell Science · doi:10.1242/jcs.112.17.2895 · Cited by 457
Burattini, S., Ferri, P., Battistelli, M., Curci, R., Luchetti, F., & Falcieri, E. (2004) · PubMed · doi:10.4081/891 · Cited by 353
Shefer, G., Rauner, G., Yablonka‐Reuveni, Z., & Benayahu, D. (2010) · PLoS ONE · doi:10.1371/journal.pone.0013307 · Cited by 220
Research works printed but not linked: 2
- Dedieu S, 2002, Int J Dev Biol, 46, 235
- Burattini S, 2004, Eur J Histochem, 48, 223
Cited by
Sorted by citations
Molecular mechanisms and physiological functions of mitophagy
Onishi, M., Yamano, K., Sato, M., Matsuda, N., & Okamoto, K. (2021) · The EMBO Journal · doi:10.15252/embj.2020104705 · Cited by 1,469
The mitophagy pathway and its implications in human diseases
Wang, S., Long, H., Hou, L., Feng, B., Ma, Z., Wu, Y., Zeng, Y., Cai, J., Zhang, D., & Zhao, G. (2023) · Signal Transduction and Targeted Therapy · doi:10.1038/s41392-023-01503-7 · Cited by 991
Mitophagy in human health, ageing and disease
Picca, A., Faitg, J., Auwerx, J., Ferrucci, L., & D’Amico, D. (2023) · Nature Metabolism · doi:10.1038/s42255-023-00930-8 · Cited by 635
Autophagy: The spotlight for cellular stress responses
Ravanan, P., Florance, I., & Talwar, P. (2017) · Life Sciences · doi:10.1016/j.lfs.2017.08.029 · Cited by 595
The Role of Autophagy in the Heart
Sciarretta, S., Maejima, Y., Zablocki, D., & Sadoshima, J. (2018) · Annual Review of Physiology · doi:10.1146/annurev-physiol-021317-121427 · Cited by 547
Control of satellite cell function in muscle regeneration and its disruption in ageing
Sousa-Victor, P., García-Prat, L., & Muñoz-Cánoves, P. (2022) · Nature Reviews Molecular Cell Biology · doi:10.1038/s41580-021-00421-2 · Cited by 476
Zhou, H., Zhu, P., Wang, J., Zhu, H., Ren, J. T., & Chen, Y. (2018) · Cell Death and Differentiation · doi:10.1038/s41418-018-0086-7 · Cited by 417
The emerging, multifaceted role of mitophagy in cancer and cancer therapeutics
Panigrahi, D. P., Praharaj, P. P., Bhol, C. S., Mahapatra, K. K., Patra, S., Behera, B. P., Mishra, S. R., & Bhutia, S. K. (2019) · Seminars in Cancer Biology · doi:10.1016/j.semcancer.2019.07.015 · Cited by 379
Autophagy, cancer stem cells and drug resistance
Smith, A. G., & Macleod, K. F. (2018) · The Journal of Pathology · doi:10.1002/path.5222 · Cited by 369
Tissue Stem Cells: Architects of Their Niches
Fuchs, E., & Blau, H. M. (2020) · Cell Stem Cell · doi:10.1016/j.stem.2020.09.011 · Cited by 332
Lampert, M. A., Orogo, A. M., Najor, R. H., Hammerling, B. C., Leon, L. J., Wang, B. J., Kim, T.-Y., Sussman, M. A., & Gustafsson, Å. B. (2019) · Autophagy · doi:10.1080/15548627.2019.1580095 · Cited by 316
Baechler, B. L., Bloemberg, D., & Quadrilatero, J. (2019) · Autophagy · doi:10.1080/15548627.2019.1591672 · Cited by 308
Crosstalk between mitochondrial biogenesis and mitophagy to maintain mitochondrial homeostasis
Liu, L., Li, Y., Chen, G., & Chen, Q. (2023) · Journal of Biomedical Science · doi:10.1186/s12929-023-00975-7 · Cited by 322
Mick, E., Titov, D. V., Skinner, O. S., Sharma, R., Jourdain, A. A., & Mootha, V. K. (2020) · eLife · doi:10.7554/elife.49178 · Cited by 252
Doblado, L., Lueck, C., Rey, C., Samhan-Arias, A. K., Priéto, I., Stacchiotti, A., & Monsalve, M. (2021) · International Journal of Molecular Sciences · doi:10.3390/ijms22083903 · Cited by 238
Functions of autophagy in the tumor microenvironment and cancer metastasis
Mowers, E. E., Sharifi, M. N., & Macleod, K. F. (2018) · FEBS Journal · doi:10.1111/febs.14388 · Cited by 224
Role of Oxidative Stress as Key Regulator of Muscle Wasting during Cachexia
Ábrigo, J., Elorza, Á. A., Riedel, C. A., Vilos, C., Simón, F., Cabrera, D., Estrada, L. D., & Cabello‐Verrugio, C. (2018) · Oxidative Medicine and Cellular Longevity · doi:10.1155/2018/2063179 · Cited by 225
Outstanding Questions in Mitophagy: What We Do and Do Not Know
Montava‐Garriga, L., & Ganley, I. G. (2019) · Journal of Molecular Biology · doi:10.1016/j.jmb.2019.06.032 · Cited by 218
Mitochondrial Dynamics in Stem Cells and Differentiation
Seo, B. J., Yoon, S. H., & Tae, J. (2018) · International Journal of Molecular Sciences · doi:10.3390/ijms19123893 · Cited by 208
Autophagy in stem cells: repair, remodelling and metabolic reprogramming
Boya, P., Codogno, P., & Rodriguez-Muela, N. (2018) · Development · doi:10.1242/dev.146506 · Cited by 197
Expanding perspectives on the significance of mitophagy in cancer
Drake, L. E., Springer, M. Z., Poole, L. P., Kim, C., & Macleod, K. F. (2017) · Seminars in Cancer Biology · doi:10.1016/j.semcancer.2017.04.008 · Cited by 194
Emerging role of mitophagy in human diseases and physiology
Um, J., & Yun, J. (2017) · BMB Reports · doi:10.5483/bmbrep.2017.50.6.056 · Cited by 185
Is Mitochondrial Dysfunction a Common Root of Noncommunicable Chronic Diseases?
Díaz‐Vegas, A., Sánchez-Aguilera, P., Krycer, J. R., Morales, P. E., Monsalves‐Álvarez, M., Cifuentes, M., Rothermel, B. A., & Lavandero, S. (2020) · Endocrine Reviews · doi:10.1210/endrev/bnaa005 · Cited by 179
Li, Y., Chen, H., Xie, X., Yang, B., Wang, X., Zhang, J., Qiao, T., Guan, J., Qiu, Y., Huang, Y., et al. (2022) · Cancer Research · doi:10.1158/0008-5472.can-22-2370 · Cited by 177
Xian, H., & Liou, Y. (2020) · Cell Death and Differentiation · doi:10.1038/s41418-020-00657-z · Cited by 177
Yucel, N., Wang, Y. X., Mai, T., Porpiglia, E., Lund, P. J., Markov, G., Garcia, B. A., Bendall, S. C., Angelo, M., & Blau, H. M. (2019) · Cell Reports · doi:10.1016/j.celrep.2019.05.092 · Cited by 159
Fu, W., Liu, Y., & Yin, H. (2019) · Stem Cells International · doi:10.1155/2019/9757201 · Cited by 165
Mitochondrial morphology regulates organellar Ca 2+ uptake and changes cellular Ca 2+ homeostasis
Kowaltowski, A. J., Menezes‐Filho, S. L., Assali, E. A., Gonçalves, I. G., Cabral‐Costa, J. V., Abreu, P., Miller, N., Nolasco, P., Laurindo, F. R. M., Bruni‐Cardoso, A., et al. (2019) · The FASEB Journal · doi:10.1096/fj.201901136r · Cited by 137
Mitophagy-driven metabolic switch reprograms stem cell fate
Naik, P. P., Birbrair, A., & Bhutia, S. K. (2018) · Cellular and Molecular Life Sciences · doi:10.1007/s00018-018-2922-9 · Cited by 134
Mitochondria—hubs for regulating cellular biochemistry: emerging concepts and networks
Anderson, A. J., Jackson, T. D., Stroud, D. A., & Stojanovski, D. (2019) · Open Biology · doi:10.1098/rsob.190126 · Cited by 138
Exercise-induced skeletal muscle signaling pathways and human athletic performance
Camera, D. M., Smiles, W. J., & Hawley, J. A. (2016) · Free Radical Biology and Medicine · doi:10.1016/j.freeradbiomed.2016.02.007 · Cited by 128
Zhou, J., Chong, S. Y., Lim, A., Singh, B. K., Sinha, R. A., Salmon, A. B., & Yen, P. M. (2017) · Aging · doi:10.18632/aging.101181 · Cited by 126
Mammalian mitophagy – from in vitro molecules to in vivo models
Rodger, C. E., McWilliams, T. G., & Ganley, I. G. (2017) · FEBS Journal · doi:10.1111/febs.14336 · Cited by 127
Mitochondrial Biogenesis, Mitochondrial Dynamics, and Mitophagy in the Maturation of Cardiomyocytes
Ding, Q., Qi, Y., & Tsang, S. Y. (2021) · Cells · doi:10.3390/cells10092463 · Cited by 128
Sestrins are evolutionarily conserved mediators of exercise benefits
Kim, M., Sujkowski, A. L., Namkoong, S., Gu, B., Cobb, T., Kim, B. Y., Kowalsky, A. H., Cho, C., Semple, I. A., Ro, S., et al. (2020) · Nature Communications · doi:10.1038/s41467-019-13442-5 · Cited by 119
Arribat, Y., Broskey, N. T., Greggio, C., Boutant, M., Conde Alonso, S., Kulkarni, S. S., Lagarrigue, S., Carnero, E. A., Besson, C., Cantó, C., et al. (2019) · Acta Physiologica · doi:10.1111/apha.13179 · Cited by 112
Jaśkiewicz, A., Pająk, B., & Orzechowski, A. (2018) · International Journal of Molecular Sciences · doi:10.3390/ijms19102848 · Cited by 109
Sirtuins' control of autophagy and mitophagy in cancer
Aventaggiato, M., Vernucci, E., Barreca, F., Russo, M. A., & Tafani, M. (2020) · Pharmacology & Therapeutics · doi:10.1016/j.pharmthera.2020.107748 · Cited by 103
Lei, Y., Gan, M., Qiu, Y., Chen, Q., Wang, X., Liao, T., Zhao, M., Chen, L., Zhang, S., Zhao, Y., et al. (2024) · Cellular & Molecular Biology Letters · doi:10.1186/s11658-024-00572-y · Cited by 111
Mitochondrial-Shaping Proteins in Cardiac Health and Disease – the Long and the Short of It!
Ong, S., Kalkhoran, S. B., Hernández‐Reséndiz, S., Samangouei, P., Ong, S., & Hausenloy, D. J. (2017) · Cardiovascular Drugs and Therapy · doi:10.1007/s10557-016-6710-1 · Cited by 103
Yazdankhah, M., Ghosh, S., Shang, P., Stepicheva, N. A., Hose, S., Liu, H., Chamling, X., Tian, S., Sullivan, M. L. G., Calderon, M. J., et al. (2021) · Autophagy · doi:10.1080/15548627.2020.1871204 · Cited by 99
Bloemberg, D., & Quadrilatero, J. (2019) · American Journal of Physiology-Cell Physiology · doi:10.1152/ajpcell.00261.2018 · Cited by 100
Mechanisms, pathophysiological roles and methods for analyzing mitophagy – recent insights
Williams, J. A. R., & Ding, W. (2017) · Biological Chemistry · doi:10.1515/hsz-2017-0228 · Cited by 92
Mitochondrial Function in Muscle Stem Cell Fates
Bhattacharya, D., & Scimè, A. (2020) · Frontiers in Cell and Developmental Biology · doi:10.3389/fcell.2020.00480 · Cited by 95
Dai, W., Wu, G., Liu, K., Chen, Q., Tao, J., Liu, H., & Shen, M. (2023) · Journal of Cachexia Sarcopenia and Muscle · doi:10.1002/jcsm.13363 · Cited by 90
Kim, Y. Y., Um, J., Yoon, J.-H., Kim, H.-J., Lee, D., Lee, Y. J., Jee, H. J., Kim, Y. M., Jang, J. S., Jang, Y., et al. (2019) · The FASEB Journal · doi:10.1096/fj.201900073r · Cited by 87
Martorana, F., Gaglio, D., Bianco, M. R., Aprea, F., Virtuoso, A., Bonanomi, M., Alberghina, L., Papa, M., & Colangelo, A. M. (2018) · Cell Death and Disease · doi:10.1038/s41419-018-0429-9 · Cited by 81
Weil, R., Laplantine, E., Curic, S., & Génin, P. (2018) · Frontiers in Immunology · doi:10.3389/fimmu.2018.01243 · Cited by 83
Preliminary Techno-Economic Assessment of Animal Cell-Based Meat
Risner, D., Li, F., Fell, J. S., Pace, S. A., Siegel, J. B., Tagkopoulos, I., & Spang, E. S. (2020) · Foods · doi:10.3390/foods10010003 · Cited by 83
Goljanek‐Whysall, K., Soriano‐Arroquia, A., McCormick, R., Chinda, C., & McDonagh, B. (2020) · Aging Cell · doi:10.1111/acel.13140 · Cited by 81
“It has also been demonstrated that during the myogenic differentiation of C2C12 myoblasts, there is an induction of mitophagy with a corresponding increase in mitochondrial biogenesis (Sin et al., 2016).”
BackgroundAutophagy in muscle regeneration: potential therapies for myopathies
Chen, W., Chen, Y., Liu, Y., & Wang, X. (2022) · Journal of Cachexia Sarcopenia and Muscle · doi:10.1002/jcsm.13000 · Cited by 80
Morris, G., Puri, B. K., Walder, K. R., Berk, M., Stubbs, B., Maes, M. H. J., & Carvalho, A. F. (2018) · Molecular Neurobiology · doi:10.1007/s12035-018-1028-6 · Cited by 80
FTO-mediated demethylation of GADD45B promotes myogenesis through the activation of p38 MAPK pathway
Deng, K., Fan, Y., Liang, Y., Cai, Y., Zhang, G., Deng, M., Wang, Z., Lu, J., Shi, J., Wang, F., et al. (2021) · Molecular Therapy — Nucleic Acids · doi:10.1016/j.omtn.2021.06.013 · Cited by 77
Exercise‐mediated modulation of autophagy in skeletal muscle
Martín-Rincón, M., Morales‐Álamo, D., & Calbet, J. A. L. (2017) · Scandinavian Journal of Medicine and Science in Sports · doi:10.1111/sms.12945 · Cited by 79
Krishna, S., Arrojo e Drigo, R., Capitanio, J. S., Ramachandra, R., Ellisman, M., & Hetzer, M. W. (2021) · Developmental Cell · doi:10.1016/j.devcel.2021.10.008 · Cited by 73
Yap, J. L. Y., Tai, Y. K., Fröhlich, J., Fong, C. H. H., Yin, J. N., Foo, Z. L., Ramanan, S., Beyer, C., Toh, S. J., Casarosa, M., et al. (2019) · The FASEB Journal · doi:10.1096/fj.201900057r · Cited by 74
Rahman, F. A., & Quadrilatero, J. (2021) · Cellular and Molecular Life Sciences · doi:10.1007/s00018-021-03807-9 · Cited by 77
Mitochondrial autophagy in cardiomyopathy
Tong, M., & Sadoshima, J. (2016) · Current Opinion in Genetics & Development · doi:10.1016/j.gde.2016.02.006 · Cited by 75
Lin, Y.-F., Xiao, M.-H., Chen, H.-X., Meng, Y., Zhao, N., Yang, L., Tang, H., Wang, J.-L., Liu, X., Zhu, Y., et al. (2019) · Cell Death and Disease · doi:10.1038/s41419-019-1767-y · Cited by 73
Crupi, A. N., Nunnelee, J. S., Taylor, D. J., Thomas, A., Vit, J., Riera, C. E., Gottlieb, R. A., & Goodridge, H. S. (2018) · Aging · doi:10.18632/aging.101643 · Cited by 72
Hydroxytyrosol Promotes the Mitochondrial Function through Activating Mitophagy
Dong, Y., Yu, M., Wu, Y., Xia, T., Wang, L., Song, K., Zhang, C., Lu, K., & Rahimnejad, S. (2022) · Antioxidants · doi:10.3390/antiox11050893 · Cited by 70
Selvaraj, S., Mondragón-González, R., Xu, B., Magli, A., Kim, H., Lainé, J., Kiley, J., McKee, H., Rinaldi, F., Aho, J., et al. (2019) · eLife · doi:10.7554/elife.47970 · Cited by 66
Dong, Y., Li, L., Espe, M., Lu, K., & Rahimnejad, S. (2020) · Journal of Agricultural and Food Chemistry · doi:10.1021/acs.jafc.0c03310 · Cited by 66
Heher, P., Ganassi, M., Weidinger, A., Engquist, E. N., Prüller, J., Nguyen, T. H., Tassin, A., Declèves, A., Mamchaoui, K., Banerji, C. R. S., et al. (2022) · Redox Biology · doi:10.1016/j.redox.2022.102251 · Cited by 70
Zhang, M., Liu, F.-R., Zhou, P., Wang, Q., Xu, C., Li, Y., Bian, L., Liu, Y., Zhou, J., Wang, F., et al. (2019) · Autophagy · doi:10.1080/15548627.2019.1578040 · Cited by 61
Spurlock, B., Tullet, J. M. A., Hartman, J. L., & Mitra, K. (2020) · Experimental Gerontology · doi:10.1016/j.exger.2020.110919 · Cited by 60
Mesquita, P. H. C., Vann, C. G., Phillips, S. M., McKendry, J., Young, K. C., Kavazis, A. N., & Roberts, M. D. (2021) · Frontiers in Physiology · doi:10.3389/fphys.2021.725866 · Cited by 62
Sestrins in Physiological Stress Responses
Kim, M., Kowalsky, A. H., & Lee, J. H. (2020) · Annual Review of Physiology · doi:10.1146/annurev-physiol-031620-092317 · Cited by 66
Elorza, Á. A., & Soffia, J. P. (2021) · Frontiers in Cell and Developmental Biology · doi:10.3389/fcell.2021.625020 · Cited by 64
Sarcopenia targeting with autophagy mechanism by exercise
Park, S. S., Seo, Y., & Kwon, K. (2019) · BMB Reports · doi:10.5483/bmbrep.2019.52.1.292 · Cited by 64
Mechanisms and Functions of Mitophagy and Potential Roles in Renal Disease
Zuo, Z., Jing, K., Wu, H.-L., Wang, S., Ye, L., Li, Z., Yang, C., Pan, Q., Liu, W. J., & Liu, H. (2020) · Frontiers in Physiology · doi:10.3389/fphys.2020.00935 · Cited by 62
HIF1α-dependent mitophagy facilitates cardiomyoblast differentiation
Zhao, J.-F., Rodger, C. E., Allen, G. F. G., Weidlich, S., & Ganley, I. G. (2020) · Cell Stress · doi:10.15698/cst2020.05.220 · Cited by 61
Mitochondria orchestrate macrophage effector functions in atherosclerosis
Dumont, A., Lee, M., Barouillet, T., Murphy, A. J., & Yvan‐Charvet, L. (2020) · Molecular Aspects of Medicine · doi:10.1016/j.mam.2020.100922 · Cited by 60
Wang, X., Zhang, X., Cao, K. J., Zeng, M., Fu, X., Zheng, A., Zhang, F., Gao, F., Zou, X., Li, H., et al. (2022) · Nature Communications · doi:10.1038/s41467-022-31548-1 · Cited by 58
Vantaggiato, C., Castelli, M., Giovarelli, M., Orso, G., Bassi, M. T., Clementi, E., & Palma, C. D. (2019) · Frontiers in Cellular Neuroscience · doi:10.3389/fncel.2019.00120 · Cited by 57
Proline restores mitochondrial function and reverses aging hallmarks in senescent cells
Choudhury, D., Rong, N., Kumar, H. V. S., Swedick, S., Samuel, R. Z., Mehrotra, P., Toftegaard, J., Rajabian, N., Thiyagarajan, R., Podder, A. K., et al. (2024) · Cell Reports · doi:10.1016/j.celrep.2024.113738 · Cited by 58
Livshits, G., & Kalinkovich, A. (2023) · Ageing Research Reviews · doi:10.1016/j.arr.2023.101852 · Cited by 56
Zecchini, S., Giovarelli, M., Perrotta, C., Morisi, F., Touvier, T., Renzo, I. D., Moscheni, C., Bassi, M. T., Cervia, D., Sandri, M., et al. (2018) · Autophagy · doi:10.1080/15548627.2018.1507439 · Cited by 54
Mammalian Mitophagosome Formation: A Focus on the Early Signals and Steps
Zachari, M., & Ktistakis, N. T. (2020) · Frontiers in Cell and Developmental Biology · doi:10.3389/fcell.2020.00171 · Cited by 54
Relevance of Autophagy and Mitophagy Dynamics and Markers in Neurodegenerative Diseases
Giorgi, C., Bouhamida, E., Danese, A., Previati, M., Pinton, P., & Patergnani, S. (2021) · Biomedicines · doi:10.3390/biomedicines9020149 · Cited by 51
Mitochondrial Quality Control in Health and Disease
Ye, L., Fu, X., & Li, Q. (2025) · MedComm · doi:10.1002/mco2.70319 · Cited by 60
The Role of Lonp1 on Mitochondrial Functions during Cardiovascular and Muscular Diseases
Zanini, G., Selleri, V., Malerba, M., Solodka, K., Sinigaglia, G., Nasi, M., Mattioli, A. V., & Pinti, M. (2023) · Antioxidants · doi:10.3390/antiox12030598 · Cited by 50
Plummer, J. D., & Johnson, J. E. (2019) · Frontiers in Cell and Developmental Biology · doi:10.3389/fcell.2019.00301 · Cited by 48
Giraud, S., Kerforne, T., Zely, J., Ameteau, V., Couturier, P., Tauc, M., & Hauet, T. (2020) · American Journal of Transplantation · doi:10.1111/ajt.15994 · Cited by 51
Mitochondrial fission/fusion and cardiomyopathy
Dorn, G. W. (2016) · Current Opinion in Genetics & Development · doi:10.1016/j.gde.2016.03.001 · Cited by 50
Calcium Homeostasis in the Control of Mitophagy
Perrone, M., Patergnani, S., Mambro, T. D., Palumbo, L., Wieckowski, M. R., Giorgi, C., & Pinton, P. (2022) · Antioxidants and Redox Signaling · doi:10.1089/ars.2022.0122 · Cited by 52
Apoptosome-dependent myotube formation involves activation of caspase-3 in differentiating myoblasts
Dehkordi, M. H., Tashakor, A., O’Connell, E., & Fearnhead, H. O. (2020) · Cell Death and Disease · doi:10.1038/s41419-020-2502-4 · Cited by 48
Song, H., Tian, X., Liu, D., Liu, M., Liu, Y., Liu, J., Mei, Z., Yan, C., & Han, Y. (2021) · Autophagy · doi:10.1080/15548627.2021.1904488 · Cited by 46
Energy Metabolism on Mitochondrial Maturation and Its Effects on Cardiomyocyte Cell Fate
Persad, K. L., & Lopaschuk, G. D. (2022) · Frontiers in Cell and Developmental Biology · doi:10.3389/fcell.2022.886393 · Cited by 49
Acute Endurance Exercise Induces Nuclear p53 Abundance in Human Skeletal Muscle
Tachtsis, B., Smiles, W. J., Lane, S. C., Hawley, J. A., & CAMERA, D. M. (2016) · Frontiers in Physiology · doi:10.3389/fphys.2016.00144 · Cited by 45
Hsu, S. P. C., Kuo, J. S., Chiang, H.-C., Wang, H.-E., Wang, Y., Huang, C.-C., Huang, Y.-C., Chi, M., Mehta, M. P., & Chi, K.-H. (2018) · Oncotarget · doi:10.18632/oncotarget.23855 · Cited by 44
Ludikhuize, M. C., & Colman, M. J. R. (2020) · Antioxidants and Redox Signaling · doi:10.1089/ars.2020.8126 · Cited by 45
Gatta, L., Vitiello, L., Gorini, S., Chiandotto, S., Costelli, P., Giammarioli, A. M., Malorni, W., Rosano, G. M. C., & Ferraro, E. (2017) · Oncotarget · doi:10.18632/oncotarget.23044 · Cited by 45
Geng, J., Wei, M., Yuan, X. N., Liu, Z., Wang, X., Zhang, D., Luo, L., Wu, J., Guo, W., & Qin, Z. (2019) · The FASEB Journal · doi:10.1096/fj.201802209r · Cited by 43
De, R., Mazumder, S., & Bandyopadhyay, U. (2020) · Cell Biology and Toxicology · doi:10.1007/s10565-020-09561-1 · Cited by 47
Antoun, E., Garratt, E. S., Taddei, A., Burton, M. A., Barton, S. J., Titcombe, P., Westbury, L. D., Baczynska, A., Migliavacca, E., Feige, J. N., et al. (2021) · Journal of Cachexia Sarcopenia and Muscle · doi:10.1002/jcsm.12876 · Cited by 47
Agerholm, M., Dall, M., Jensen, B. A. H., Prats, C., Madsen, S., Basse, A. L., Graae, A.-S., Risis, S., Goldenbaum, J., Quistorff, B., et al. (2017) · American Journal of Physiology-Endocrinology and Metabolism · doi:10.1152/ajpendo.00213.2017 · Cited by 42
Luo, N., Yue, F., Jia, Z., Chen, J., Deng, Q., Zhao, Y., & Kuang, S. (2021) · The FASEB Journal · doi:10.1096/fj.202002464r · Cited by 42
Lv, J., Yi, Y., Qi, Y., Yan, C., Jin, W., Meng, L., Zhang, D., & Jiang, W. (2022) · Cell Death Discovery · doi:10.1038/s41420-022-00867-z · Cited by 42
Mitochondrial Function and Reactive Oxygen/Nitrogen Species in Skeletal Muscle
Chen, M., Li, Y., Deng, S., Zhao, Y., Lian, Z., & Yu, K. (2022) · Frontiers in Cell and Developmental Biology · doi:10.3389/fcell.2022.826981 · Cited by 49
Metadata
- Authors
- Sin, J., Andres, A. M., Taylor, D. J. R., Weston, T., Hiraumi, Y., Stotland, A., Kim, B. J., Huang, C., Doran, K. S., & Gottlieb, R. A.
- Affiliations
- Cedars-Sinai Medical Center (US)
- San Diego State University (US)
- Corresponding author
- Gottlieb, Roberta A.
- ORCID
- Venue
- Autophagy
- Publisher
- Informa UK Limited
- Published
- 2016-02-01
- Volume
- 12
- Issue
- 2
- Pages
- 369-380
- ISSN
- 1554-8627 (ISSN-L)
- 1554-8635
- PMC
- PMC4836019
- OpenAlex
- W2280853449
- Cited by
- 385
- References
- 24
- Citations by year
- 2026: 27 · 2025: 27 · 2024: 50 · 2023: 39 · 2022: 38 · 2021: 46 · 2020: 48 · 2019: 45 · 2018: 30 · 2017: 25 · 2016: 8
- FWCI
- 16.75
- Type
- journal article
- Language
- en
- Open access
- hybrid
- doi.org
- Licence
- Locations
- Autophagy (publishedVersion, cc-by-nc)
- PubMed Central (publishedVersion, cc-by-nc)
- PubMed (publishedVersion)
- Funders
- National Heart, Lung, and Blood Institute (P01HL112730, T32HL116273)
- Topics
- Life Sciences › Biochemistry, Genetics and Molecular Biology › Cell Biology › Autophagy in Disease and Therapy
- Life Sciences › Biochemistry, Genetics and Molecular Biology › Molecular Biology › Muscle Physiology and Disorders
- Life Sciences › Biochemistry, Genetics and Molecular Biology › Molecular Biology › Mitochondrial Function and Pathology
- Keywords
- mitophagy, mitochondrial biogenesis, myogenesis, C2C12 myoblasts, Drp1, mitochondrial fragmentation, p62, PGC-1α, OPA1, mitochondrial fusion, oxidative phosphorylation, mitochondrial network remodeling, myotube formation, skeletal muscle development
- MeSH terms
- Animals, Organelle Biogenesis, Cell Differentiation, Cell Line, Mitochondria, Models, Biological, Oxidative Phosphorylation, Muscle Fibers, Skeletal, Macrolides, Muscle Development, Myoblasts, Mice, Mitophagy
About these checks
Registry, retraction, Cites and statistics results are computed, not judged, with one exception: a printed reference that no index lists is read once by a model before it counts as a citation error. Claims are extracted by a model and kept only when their quote appears verbatim in the text; each cited source is then checked, with a model’s help, for whether it says what the claim relies on. Those verdicts can be wrong — read the claim’s quote and the cited source before relying on one.
Statistics and arithmetic are recomputed, not judged.
Confidence bands are shown only for fields calibrated on our annotated test set. None is calibrated yet, so no band is shown.
What counts as a claim ›How we measure confidence ›How we check this ›
Are you an author, or do you see a problem with this page? Request a review
