Cited by 10

The DOI matches its Crossref record; 2 of the 2 references it cites were found in a registry or an index.

Alterations of autophagy in the peripheral neuropathy Charcot-Marie-Tooth type 2B

Colecchia, David, Stasi, Mariangela, Leonardi, Margherita, Manganelli, Fiore, Nolano, Maria, Veneziani, Bianca Maria, Santoro, Lucio, Eskelinen, Eeva-Liisa, Chiariello, Mario, Bucci, Cecilia·2018·Autophagy

Overview

The claims and statistics of this paper haven’t been checked yet.

Run the check — free, no account needed. It reads the open-access text and checks the sources it cites.

A few free checks a day · papers already verified open instantly · results are public

Integrity signals

Registry

Crossref · 10.1080/15548627.2017.1388475

Cites

2 of 2 references verified0 citation errors · 0 not checkable

Statistics

Figures

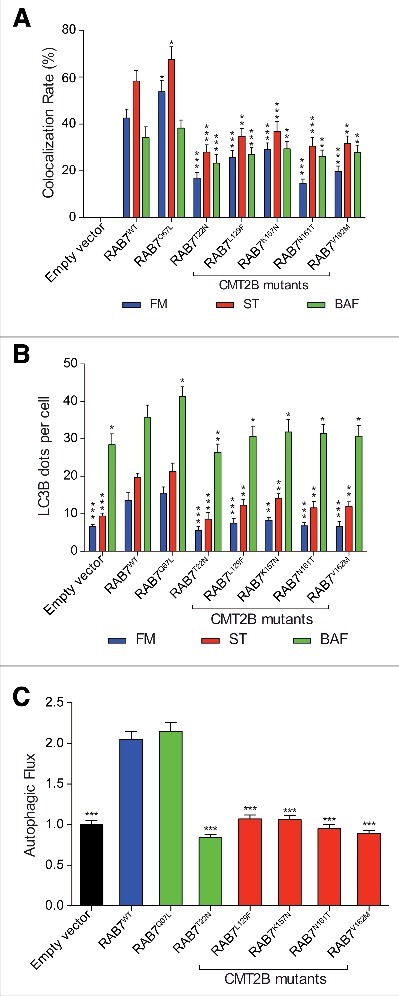
Figure 1. Analysis of autophagy in HeLa cells expressing CMT2B-causing RAB7 mutant proteins. HeLa cells transfected for 48 h with empty vector or plasmids encoding HA-tagged RAB7WT, RAB7Q67L, RAB7T22N and CMT2B-causing RAB7 mutants (RAB7L129F, RAB7K157N, RAB7N161T, RAB7V162M), were incubated in full medium (FM) or starvation medium (ST) for 30 min, or in the presence of 100 nM bafilomycin A1 (BAF) for 3 h. (A) The colocalization rate between RAB7 and LC3B was analyzed for the each different RAB7 isoform and for each condition (FM, ST, BAF). (B) The number of LC3B-positive dots per cell was evaluated for each sample. (C) The autophagic flux was calculated as the ratio of LC3B dots between BAF and FM of the same sample and normalized on empty vector. Quantification of results was performed by unbiased intensitometric analysis of fluorescence using the Quantitation Module of Volocity software.69 Statistical analysis one-way ANOVA test was performed between the same conditions (FM, ST and BAF) selecting RAB7WT as the referring sample. All statistical comparisons are from the sample indicated with asterisks and RAB7WT. Means ± SEM for each value are shown in the graphs (n = 3). * = p < 0.05; ** = p < 0.01; *** = p < 0.001.
Figure 1. Analysis of autophagy in HeLa cells expressing CMT2B-causing RAB7 mutant proteins. HeLa cells transfected for 48 h with empty vector or plasmids encoding HA-tagged RAB7WT, RAB7Q67L, RAB7T22N and CMT2B-causing RAB7 mutants (RAB7L129F, RAB7K157N, RAB7N161T, RAB7V162M), were incubated in full medium (FM) or starvation medium (ST) for 30 min, or in the presence of 100 nM bafilomycin A1 (BAF) for 3 h. (A) The colocalization rate between RAB7 and LC3B was analyzed for the each different RAB7 isoform and for each condition (FM, ST, BAF). (B) The number of LC3B-positive dots per cell was evaluated for each sample. (C) The autophagic flux was calculated as the ratio of LC3B dots between BAF and FM of the same sample and normalized on empty vector. Quantification of results was performed by unbiased intensitometric analysis of fluorescence using the Quantitation Module of Volocity software.69 Statistical analysis one-way ANOVA test was performed between the same conditions (FM, ST and BAF) selecting RAB7WT as the referring sample. All statistical comparisons are from the sample indicated with asterisks and RAB7WT. Means ± SEM for each value are shown in the graphs (n = 3). * = p < 0.05; ** = p < 0.01; *** = p < 0.001.CC BY-NC-ND · PubMed Central
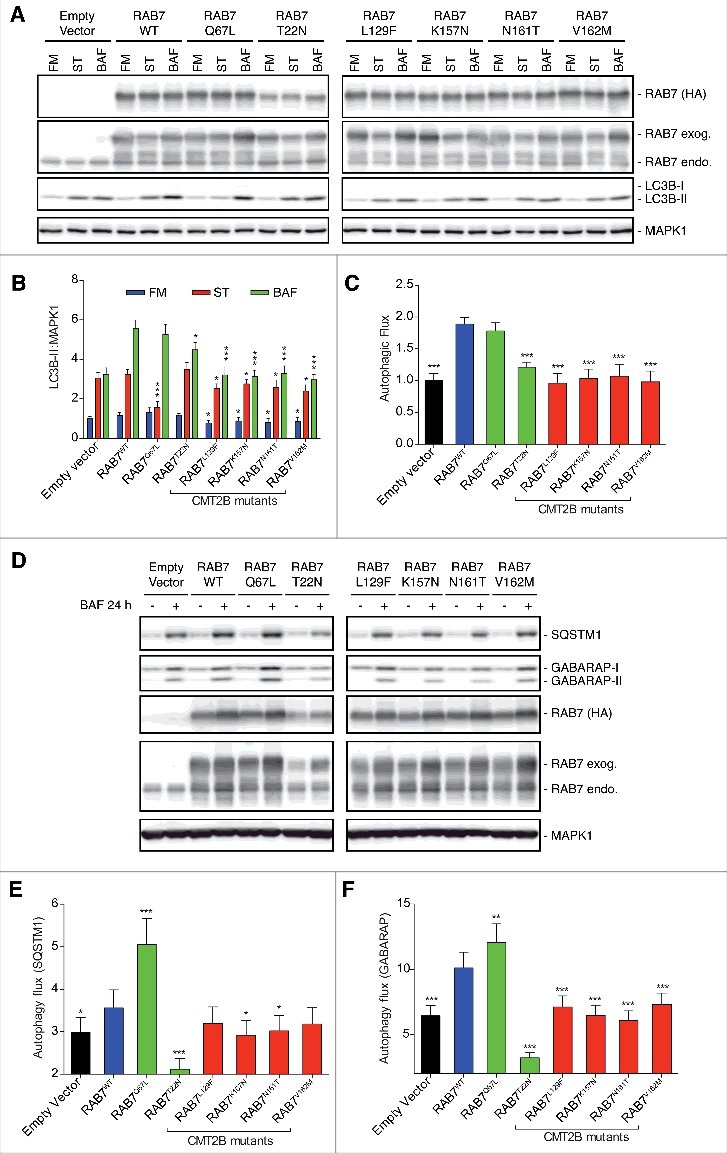
Figure 2. Analysis of autophagy in HeLa cells expressing CMT2B-causing RAB7 mutant proteins. HeLa cells transfected for 48 h with empty vector or plasmids encoding HA-tagged RAB7WT, RAB7Q67L, RAB7T22N and CMT2B-causing RAB7 mutants (RAB7L129F, RAB7K157N, RAB7N161T, RAB7V162M). Cells were incubated in full medium (FM) or starvation medium (ST) for 30 min, or in the presence of 100 nM bafilomycin A1 (BAF) for 3 h. (A) Cells were incubated in full medium or starvation medium for 30 min, or in the presence of BAF for 3 h. Immunoblot of LC3B, HA-RAB7, endogenous RAB7 and MAPK1. Representative images from 3 independent experiments are shown (n = 3). (B) Intensitometric analysis of LC3B and MAPK1 immunoblots shown in (A) were performed with NIH ImageJ. (C) The autophagic flux was calculated as the ratio of normalized LC3B-II between BAF and FM of the same sample. (D) Cells were incubated in full medium or in the presence of BAF for 24 h and next immunobloted for SQSTM1, GABARAP, HA-RAB7, endogenous RAB7 and MAPK1 proteins. Representative images from 3 independent experiments are shown (n = 3). (E) Intensitometric analysis of SQSTM1, GABARAP and MAPK1 immunoblots was used to calculate the autophagic flux as the ratio of LC3B dots between BAF and FM of the same sample. Statistical analysis one-way ANOVA test was performed between the same conditions (FM, ST and BAF) selecting RAB7WT as the referring sample. All statistical comparisons are from the sample indicated with asterisks and RAB7WT. Means ± SEM for each value are shown in the graphs. * = p < 0.05; ** = p < 0.01; *** = p < 0.001.
Figure 2. Analysis of autophagy in HeLa cells expressing CMT2B-causing RAB7 mutant proteins. HeLa cells transfected for 48 h with empty vector or plasmids encoding HA-tagged RAB7WT, RAB7Q67L, RAB7T22N and CMT2B-causing RAB7 mutants (RAB7L129F, RAB7K157N, RAB7N161T, RAB7V162M). Cells were incubated in full medium (FM) or starvation medium (ST) for 30 min, or in the presence of 100 nM bafilomycin A1 (BAF) for 3 h. (A) Cells were incubated in full medium or starvation medium for 30 min, or in the presence of BAF for 3 h. Immunoblot of LC3B, HA-RAB7, endogenous RAB7 and MAPK1. Representative images from 3 independent experiments are shown (n = 3). (B) Intensitometric analysis of LC3B and MAPK1 immunoblots shown in (A) were performed with NIH ImageJ. (C) The autophagic flux was calculated as the ratio of normalized LC3B-II between BAF and FM of the same sample. (D) Cells were incubated in full medium or in the presence of BAF for 24 h and next immunobloted for SQSTM1, GABARAP, HA-RAB7, endogenous RAB7 and MAPK1 proteins. Representative images from 3 independent experiments are shown (n = 3). (E) Intensitometric analysis of SQSTM1, GABARAP and MAPK1 immunoblots was used to calculate the autophagic flux as the ratio of LC3B dots between BAF and FM of the same sample. Statistical analysis one-way ANOVA test was performed between the same conditions (FM, ST and BAF) selecting RAB7WT as the referring sample. All statistical comparisons are from the sample indicated with asterisks and RAB7WT. Means ± SEM for each value are shown in the graphs. * = p < 0.05; ** = p < 0.01; *** = p < 0.001.CC BY-NC-ND · PubMed Central
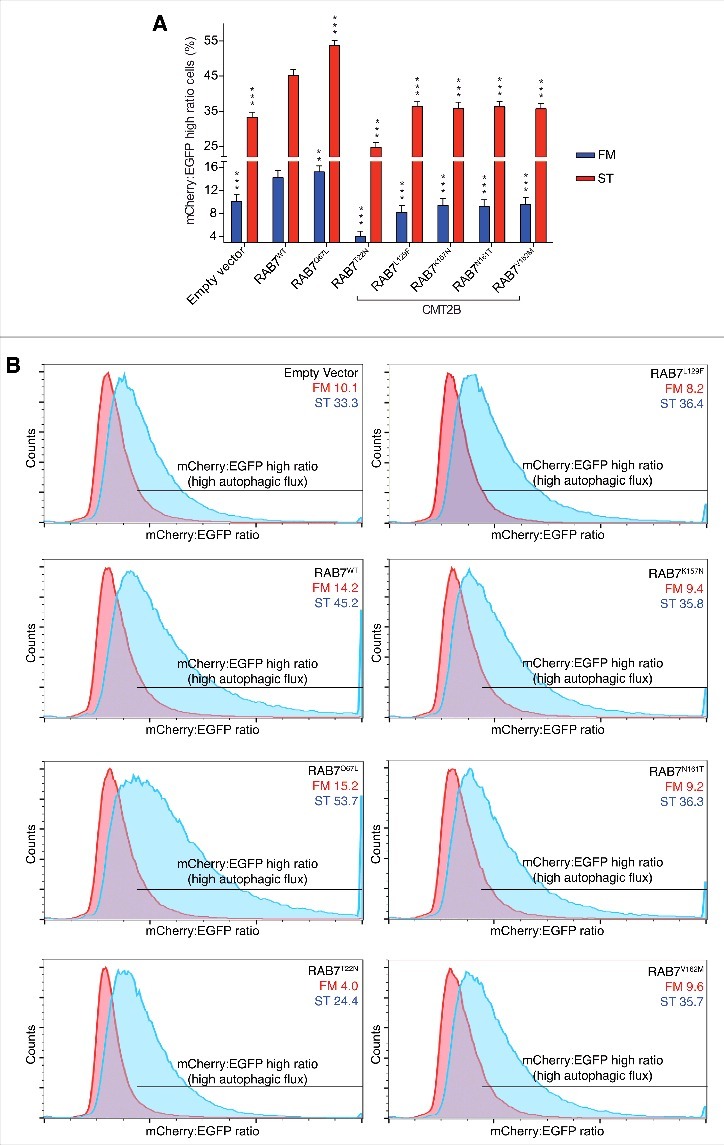
Figure 3. Analysis of autophagic flux in EGFP-mCherry-LC3B HeLa cells expressing CMT2B-causing RAB7 mutant proteins. HeLa cells transfected for 48 h with empty vector or plasmids encoding HA-tagged RAB7WT, RAB7Q67L, RAB7T22N and CMT2B-causing RAB7 mutants (RAB7L129F, RAB7K157N, RAB7N161T, RAB7V162M), were incubated in full medium (FM) or starvation medium (ST) for 4 h. Scatter and singlet gates were used to eliminate debris, dead cells, and mitotic cells. For each experiment, voltages and gain on EGFP and mCherry detectors are set empirically on negative and positive controls to allow the best plot fit on the mCherry:EGFP ratio histogram. Statistical analysis one-way ANOVA test was performed between the same conditions (FM and ST) selecting RAB7WT as the referring sample. All statistical comparisons are from the sample indicated with asterisks and the corresponding RAB7WT. Means ± SEM for each value are shown in the graphs. * = p < 0.05; ** = p < 0.01; *** = p < 0.001. (A) Graph shows the percentage of cells with high autophagic flux (measured as mCherry:EGFP ratio) in FM and ST for each sample. (B) Histograms plotting cell counts versus mCherry:EGFP ratio with a bar indicating the gate for high autophagic flux cell population. Representative images from 3 independent experiments are shown (n = 3).
Figure 3. Analysis of autophagic flux in EGFP-mCherry-LC3B HeLa cells expressing CMT2B-causing RAB7 mutant proteins. HeLa cells transfected for 48 h with empty vector or plasmids encoding HA-tagged RAB7WT, RAB7Q67L, RAB7T22N and CMT2B-causing RAB7 mutants (RAB7L129F, RAB7K157N, RAB7N161T, RAB7V162M), were incubated in full medium (FM) or starvation medium (ST) for 4 h. Scatter and singlet gates were used to eliminate debris, dead cells, and mitotic cells. For each experiment, voltages and gain on EGFP and mCherry detectors are set empirically on negative and positive controls to allow the best plot fit on the mCherry:EGFP ratio histogram. Statistical analysis one-way ANOVA test was performed between the same conditions (FM and ST) selecting RAB7WT as the referring sample. All statistical comparisons are from the sample indicated with asterisks and the corresponding RAB7WT. Means ± SEM for each value are shown in the graphs. * = p < 0.05; ** = p < 0.01; *** = p < 0.001. (A) Graph shows the percentage of cells with high autophagic flux (measured as mCherry:EGFP ratio) in FM and ST for each sample. (B) Histograms plotting cell counts versus mCherry:EGFP ratio with a bar indicating the gate for high autophagic flux cell population. Representative images from 3 independent experiments are shown (n = 3).CC BY-NC-ND · PubMed Central
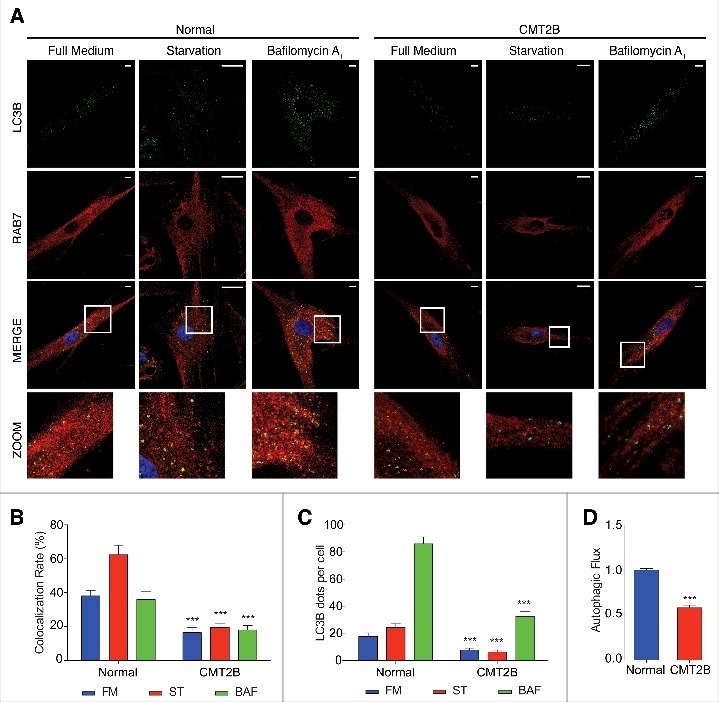
Figure 4. Analysis of autophagy in CMT2B fibroblasts. Normal dermal human fibroblasts (NDHF) and CMT2B patient-derived fibroblasts were incubated with full medium or starvation medium for 30 min, or incubated with 400 nM bafilomycin A1 for 3 h. (A) Representative images (n = 3) for NDHF and CMT2B fibroblasts labeled for LC3B (green), RAB7 (red) and nuclei (blue). White squares indicated the area enlarged in the zoom. (B) Colocalization rate between RAB7 and LC3B was analyzed for each condition (FM, ST, BAF). (C) The number of autophagosomes (scored as LC3B-positive dots) per cell was evaluated for each sample. (D) The autophagic flux was calculated as the ratio of LC3B dots between FM and BAF of the same sample. Statistical analysis was performed using one-way ANOVA test where normal fibroblasts were selected as referring sample for each condition (FM, ST and BAF). Means ± SEM for each value are shown in the graphs. * = p < 0.05; ** = p < 0.01; *** = p < 0.001. Scale bars are 10 μm for FM and BAF and 25 μm for ST.
Figure 4. Analysis of autophagy in CMT2B fibroblasts. Normal dermal human fibroblasts (NDHF) and CMT2B patient-derived fibroblasts were incubated with full medium or starvation medium for 30 min, or incubated with 400 nM bafilomycin A1 for 3 h. (A) Representative images (n = 3) for NDHF and CMT2B fibroblasts labeled for LC3B (green), RAB7 (red) and nuclei (blue). White squares indicated the area enlarged in the zoom. (B) Colocalization rate between RAB7 and LC3B was analyzed for each condition (FM, ST, BAF). (C) The number of autophagosomes (scored as LC3B-positive dots) per cell was evaluated for each sample. (D) The autophagic flux was calculated as the ratio of LC3B dots between FM and BAF of the same sample. Statistical analysis was performed using one-way ANOVA test where normal fibroblasts were selected as referring sample for each condition (FM, ST and BAF). Means ± SEM for each value are shown in the graphs. * = p < 0.05; ** = p < 0.01; *** = p < 0.001. Scale bars are 10 μm for FM and BAF and 25 μm for ST.CC BY-NC-ND · PubMed Central
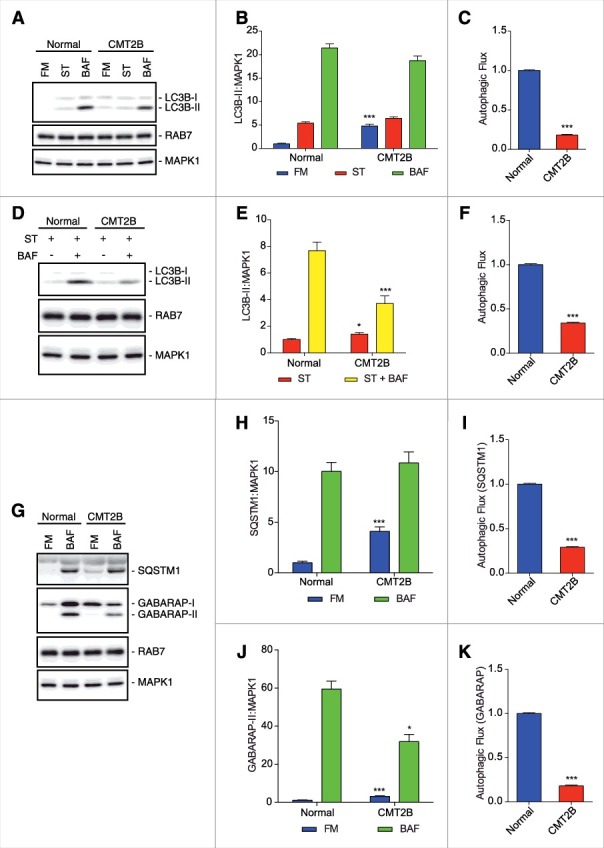
Figure 5. Analysis of autophagy in CMT2B fibroblasts. (A) Normal dermal human fibroblasts and CMT2B patient derived fibroblasts were incubated with full medium (FM) or starvation medium (ST) for 30 min, or incubated with 400 nM bafilomycin A1 (BAF) for 3 h. Immunoblot of LC3B, HA-RAB7 proteins and MAPK1. Representative images from 3 independent experiments are shown (n = 3). (B) Intensitometric analysis of LC3B and MAPK1 immunoblots shown in (A) were performed with NIH ImageJ. (C) The autophagic flux was calculated as the ratio of normalized LC3B-II between BAF and FM of the same sample. (D) Normal dermal human fibroblasts and CMT2B patient-derived fibroblasts were incubated with starvation medium with or without 400 nM BAF for 3 h. Immunoblot of LC3B, RAB7 proteins and MAPK1. Representative images from 3 independent experiments are shown (n = 3). (E) Intensitometric analysis of LC3B and MAPK1 immunoblots shown in (D) were performed with NIH ImageJ. The autophagic flux was calculated as the ratio of LC3B dots between BAF and FM of the same sample. (F) The autophagic flux was calculated as the ratio of normalized LC3B-II between BAF and FM of the same sample. (G) Normal dermal human fibroblasts and CMT2B patient derived fibroblasts were incubated with full medium or incubated with 400 nM BAF for 24 h. Immunoblot of SQSTM1, GABARAP, RAB7 and MAPK1 proteins. Representative images from 3 independent experiments are shown (n = 3). (H) Intensitometric analysis of SQSTM1 and MAPK1 immunoblots shown in (G) were performed with NIH ImageJ. (I) The autophagic flux was calculated as the ratio of normalized SQSTM1 between BAF and FM of the same sample. (J) Intensitometric analysis of GABARAP-II and MAPK1 immunoblots shown in (G) were performed with NIH ImageJ. (K) The autophagic flux was calculated as the ratio of normalized GABARAP-II between BAF and FM of the same sample. Statistical analysis was performed using one-way ANOVA test where normal fibroblasts were selected as referring sample for each condition (FM, ST and BAF). Means ± SEM for each value are shown in the graphs. * = p < 0.05; ** = p < 0.01; *** = p < 0.001.
Figure 5. Analysis of autophagy in CMT2B fibroblasts. (A) Normal dermal human fibroblasts and CMT2B patient derived fibroblasts were incubated with full medium (FM) or starvation medium (ST) for 30 min, or incubated with 400 nM bafilomycin A1 (BAF) for 3 h. Immunoblot of LC3B, HA-RAB7 proteins and MAPK1. Representative images from 3 independent experiments are shown (n = 3). (B) Intensitometric analysis of LC3B and MAPK1 immunoblots shown in (A) were performed with NIH ImageJ. (C) The autophagic flux was calculated as the ratio of normalized LC3B-II between BAF and FM of the same sample. (D) Normal dermal human fibroblasts and CMT2B patient-derived fibroblasts were incubated with starvation medium with or without 400 nM BAF for 3 h. Immunoblot of LC3B, RAB7 proteins and MAPK1. Representative images from 3 independent experiments are shown (n = 3). (E) Intensitometric analysis of LC3B and MAPK1 immunoblots shown in (D) were performed with NIH ImageJ. The autophagic flux was calculated as the ratio of LC3B dots between BAF and FM of the same sample. (F) The autophagic flux was calculated as the ratio of normalized LC3B-II between BAF and FM of the same sample. (G) Normal dermal human fibroblasts and CMT2B patient derived fibroblasts were incubated with full medium or incubated with 400 nM BAF for 24 h. Immunoblot of SQSTM1, GABARAP, RAB7 and MAPK1 proteins. Representative images from 3 independent experiments are shown (n = 3). (H) Intensitometric analysis of SQSTM1 and MAPK1 immunoblots shown in (G) were performed with NIH ImageJ. (I) The autophagic flux was calculated as the ratio of normalized SQSTM1 between BAF and FM of the same sample. (J) Intensitometric analysis of GABARAP-II and MAPK1 immunoblots shown in (G) were performed with NIH ImageJ. (K) The autophagic flux was calculated as the ratio of normalized GABARAP-II between BAF and FM of the same sample. Statistical analysis was performed using one-way ANOVA test where normal fibroblasts were selected as referring sample for each condition (FM, ST and BAF). Means ± SEM for each value are shown in the graphs. * = p < 0.05; ** = p < 0.01; *** = p < 0.001.CC BY-NC-ND · PubMed Central
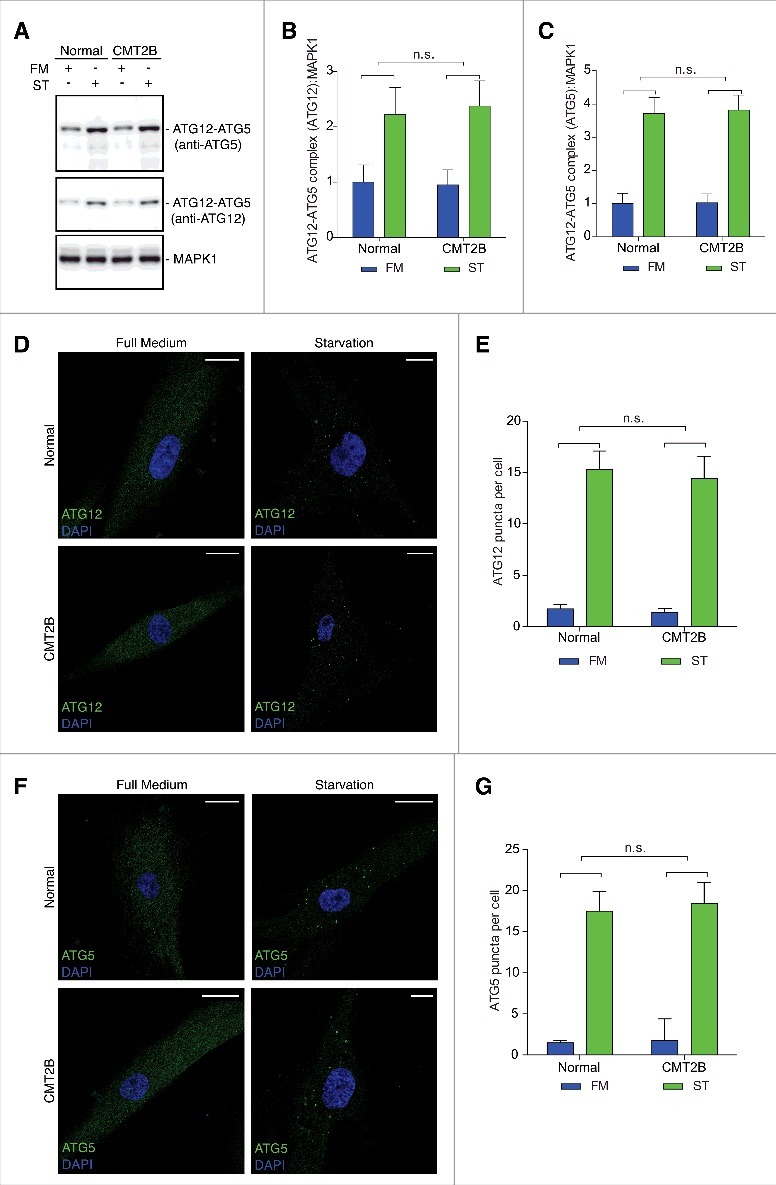
Figure 6. Analysis of autophagosome biogenesis in CMT2B fibroblasts. Statistical analysis was performed using one-way ANOVA test where normal fibroblasts were selected as referring sample for each condition (full medium [FM] and serum starved [ST]). Means ± SEM for each value are shown in the graphs. (A) Normal dermal human fibroblasts and CMT2B patient-derived fibroblasts were incubated with full medium or serum starved medium for 6 sec. Immunoblots of ATG5, ATG12 and MAPK1 proteins. Representative images from 3 independent experiments are shown (n = 3). (B) Intensitometric analysis of ATG12–ATG5 complex (labeled with ATG5) and MAPK1 immunoblots shown in (A) were performed with NIH ImageJ. (C) Intensitometric analysis of ATG12–ATG5 complex (labeled with ATG12) and MAPK1 immunoblots shown in (A) were performed with NIH ImageJ. (D) Representative images (n = 3) for NDHF and CMT2B fibroblasts labeled for ATG12 (green) and nuclei (blue). Scale bars are 25 μm. (E) The number of ATG12 puncta per cell was evaluated for each sample. (F) Representative images (n = 3) for NDHF and CMT2B fibroblasts labeled for ATG5 (green) and nuclei (blue). (G) The number of ATG5 puncta per cell was evaluated for each sample. Scale bars are 25 μm except for starved CMT2B where they are 10 μm.
Figure 6. Analysis of autophagosome biogenesis in CMT2B fibroblasts. Statistical analysis was performed using one-way ANOVA test where normal fibroblasts were selected as referring sample for each condition (full medium [FM] and serum starved [ST]). Means ± SEM for each value are shown in the graphs. (A) Normal dermal human fibroblasts and CMT2B patient-derived fibroblasts were incubated with full medium or serum starved medium for 6 sec. Immunoblots of ATG5, ATG12 and MAPK1 proteins. Representative images from 3 independent experiments are shown (n = 3). (B) Intensitometric analysis of ATG12–ATG5 complex (labeled with ATG5) and MAPK1 immunoblots shown in (A) were performed with NIH ImageJ. (C) Intensitometric analysis of ATG12–ATG5 complex (labeled with ATG12) and MAPK1 immunoblots shown in (A) were performed with NIH ImageJ. (D) Representative images (n = 3) for NDHF and CMT2B fibroblasts labeled for ATG12 (green) and nuclei (blue). Scale bars are 25 μm. (E) The number of ATG12 puncta per cell was evaluated for each sample. (F) Representative images (n = 3) for NDHF and CMT2B fibroblasts labeled for ATG5 (green) and nuclei (blue). (G) The number of ATG5 puncta per cell was evaluated for each sample. Scale bars are 25 μm except for starved CMT2B where they are 10 μm.CC BY-NC-ND · PubMed Central

Verification

Claims the paper makes

The claims and statistics of this paper haven’t been checked yet.

Run the check — free, no account needed. It reads the open-access text and checks the sources it cites.

A few free checks a day · papers already verified open instantly · results are public

Claims other papers make about this one

Each is checked against this paper’s own text: does it say what the citing paper says it does?

Self-check

Percentages, sums and reported differences re-computed from the paper’s own numbers.

The self-check needs the paper’s full text.

Citations

Cites

Show all 2 references

Research works printed but not linked: 67

  1. 10.1016/j.pneurobio.2012.03.003 · DOI
  2. 10.3390/genes5010013 · DOI
  3. 10.1212/01.wnl.0000240068.21499.f5 · DOI
  4. 10.1002/ana.20281 · DOI
  5. 10.1086/367847 · DOI
  6. 10.1016/j.gene.2013.10.023 · DOI
  7. 10.1042/BST20120197 · DOI
  8. 10.1042/BST0371027 · DOI
  9. 10.1111/j.1529-8027.2012.00415.x · DOI
  10. 10.1091/mbc.11.2.467 · DOI
  11. 10.1016/j.cellsig.2010.09.012 · DOI
  12. 10.1016/j.bbamcr.2012.11.018 · DOI
  13. 10.1074/jbc.272.7.4391 · DOI
  14. 10.1523/JNEUROSCI.3677-07.2008 · DOI
  15. 10.1016/j.bbrc.2008.05.060 · DOI
  16. 10.1093/hmg/ddp567 · DOI
  17. 10.7554/eLife.01064 · DOI
  18. 10.1016/j.nbd.2014.01.021 · DOI
  19. 10.1186/s13064-016-0058-x · DOI
  20. 10.1523/JNEUROSCI.2029-05.2005 · DOI
  21. 10.1016/j.neuron.2010.07.007 · DOI
  22. 10.1007/s00401-010-0696-8 · DOI
  23. 10.1016/j.neuron.2006.08.018 · DOI
  24. 10.1002/jnr.22460 · DOI
  25. 10.1002/jnr.490360108 · DOI
  26. 10.1002/jnr.20146 · DOI
  27. 10.1016/j.bbamcr.2013.02.024 · DOI
  28. 10.1007/s00401-012-1063-8 · DOI
  29. 10.1371/journal.pone.0002014 · DOI
  30. 10.1016/j.bbamcr.2016.11.020 · DOI
  31. 10.3390/cells5020020 · DOI
  32. 10.1038/cr.2013.161 · DOI
  33. 10.1007/s00401-014-1361-4 · DOI
  34. 10.1038/cdd.2014.204 · DOI
  35. 10.1242/jcs.01370 · DOI
  36. 10.4161/auto.1.1.1270 · DOI · Paper page
  37. 10.1016/j.devcel.2013.03.005 · DOI
  38. 10.1016/j.febslet.2014.06.015 · DOI
  39. 10.4161/auto.29394 · DOI
  40. 10.1002/jnr.24034 · DOI
  41. 10.3390/cells5030034 · DOI
  42. 10.4161/auto.25529 · DOI
  43. 10.1038/nsmb.2527 · DOI
  44. 10.1242/jcs.141036 · DOI
  45. 10.1091/mbc.E16-03-0205 · DOI
  46. 10.4161/auto.24468 · DOI
  47. 10.4161/auto.24893 · DOI
  48. 10.1534/g3.113.005777 · DOI
  49. 10.4161/auto.7.11.17651 · DOI
  50. 10.1016/j.molcel.2011.04.024 · DOI
  51. 10.1016/j.brainres.2016.03.047 · DOI
  52. 10.1016/j.mam.2006.08.009 · DOI
  53. 10.1038/nm.3232 · DOI · Paper page
  54. 10.1007/s00018-012-1201-4 · DOI
  55. 10.1016/j.tins.2013.04.001 · DOI
  56. 10.1016/j.expneurol.2013.09.017 · DOI
  57. 10.1111/bpa.12170 · DOI · Paper page
  58. 10.1007/s00401-014-1378-8 · DOI
  59. 10.1038/srep09185 · DOI
  60. 10.1038/sc.2013.52 · DOI
  61. 10.1007/s10561-009-9124-5 · DOI
  62. 10.1002/cyto.a.22095 · DOI
  63. 10.4161/auto.21857 · DOI
  64. 10.1074/jbc.M110.179523 · DOI
  65. 10.1038/embor.2008.238 · DOI · Paper page
  66. 10.1371/journal.pone.0052011 · DOI
  67. 10.18632/oncotarget.8044 · DOI

Cited by

Sorted by citations

See all 10

Metadata

Authors
Colecchia, D., Stasi, M., Leonardi, M., Manganelli, F., Nolano, M., Veneziani, B. M., Santoro, L., Eskelinen, E.-L., Chiariello, M., & Bucci, C.
Affiliations
  • Consiglio Nazionale delle Ricerche, Istituto di Fisiologia Clinica and Istituto Toscano Tumori-Core Research Laboratory, Signal Transduction Unit, AOU Senese, Siena, Italy
  • Department of Biological and Environmental Sciences and Technologies (DiSTeBA), University of Salento, Lecce, Italy
  • Department of Neurosciences, University of Naples “Federico II”, Naples, Italy
  • Salvatore Maugeri Foundation, Institute of Telese Terme, Benevento, Italy
  • Department of Molecular Medicine and Medical Biotechnologies, University of Naples “Federico II”, Naples, Italy
  • Department of Biosciences, Division of Biochemistry and Biotechnology, University of Helsinki, Helsinki, Finland
Venue
Autophagy
Published
2018-05-04
Pages
1-12
ISSN
  • 1554-8627
  • 1554-8635
Cited by
10
References
2
Language
en
Funders
  • Italian Association for Cancer Research (AIRC) (IG2016 N.19068)
  • Telethon Italy (GGP16037)

About these checks

Registry, retraction, Cites and statistics results are computed, not judged, with one exception: a printed reference that no index lists is read once by a model before it counts as a citation error. Claims are extracted by a model and kept only when their quote appears verbatim in the text; each cited source is then checked, with a model’s help, for whether it says what the claim relies on. Those verdicts can be wrong — read the claim’s quote and the cited source before relying on one.

Statistics and arithmetic are recomputed, not judged.

Confidence bands are shown only for fields calibrated on our annotated test set. None is calibrated yet, so no band is shown.

What counts as a claim ›How we measure confidence ›How we check this ›

Are you an author, or do you see a problem with this page? Request a review

How to cite

Cite CoChat for the checks on this page, and the paper for its own findings.

This page
CoChat. (2026). Citation check: Alterations of autophagy in the peripheral neuropathy Charcot-Marie-Tooth type 2B. https://app.cochat.ai/papers/10.1080/15548627.2017.1388475
The paper
Colecchia, D., Stasi, M., Leonardi, M., Manganelli, F., Nolano, M., Veneziani, B. M., Santoro, L., Eskelinen, E.-L., Chiariello, M., & Bucci, C. (2018). Alterations of autophagy in the peripheral neuropathy Charcot-Marie-Tooth type 2B. Autophagy. https://doi.org/10.1080/15548627.2017.1388475