Cited by 218

The DOI matches its Crossref record; 6 of the 6 references it cites were found in a registry or an index.

Transcription factor NFE2L2/NRF2 modulates chaperone-mediated autophagy through the regulation of LAMP2A

Pajares, Marta, Rojo, Ana I, Arias, Esperanza, Díaz-Carretero, Antonio, Cuervo, Ana María, Cuadrado, Antonio·2018·Autophagy

Overview

The claims and statistics of this paper haven’t been checked yet.

Run the check — free, no account needed. It reads the open-access text and checks the sources it cites.

A few free checks a day · papers already verified open instantly · results are public

Integrity signals

Registry

Crossref · 10.1080/15548627.2018.1474992

Cites

6 of 6 references verified0 citation errors · 0 not checkable

Statistics

Figures

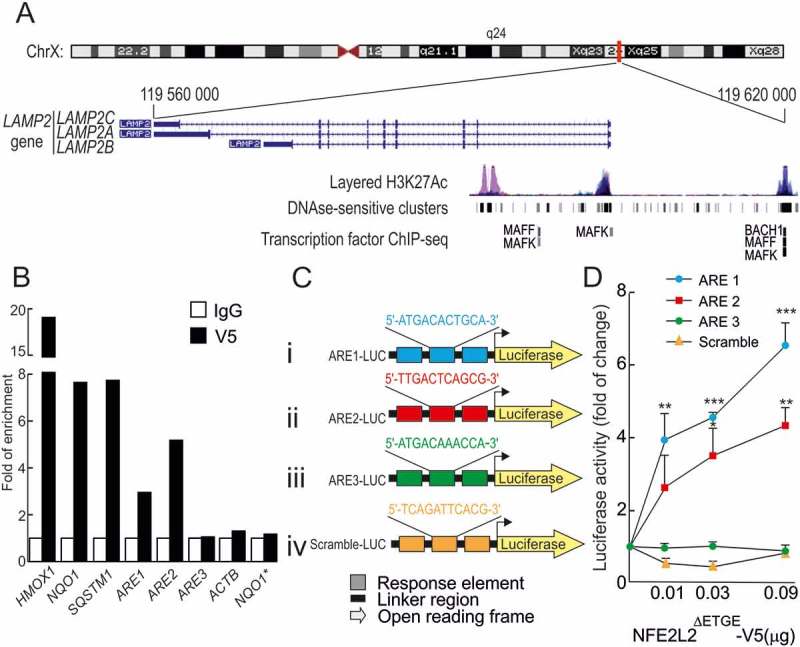
Figure 1. NFE2L2 binds to 2 functional antioxidant response elements (AREs) in the LAMP2 gene. (a) Scheme of the LAMP2 gene showing the 3 splice variants: LAMP2A, LAMP2B and LAMP2C, from The Encyclopedia of DNA Elements at UCSC (ENCODE) for human genome. Putative AREs in the LAMP2 gene were identified taking as reference the available information from ChIP of ARE-binding factors MAFK, MAFF and BACH1. These regions were localized in 200–400 base-pair-long DNAse-sensitive and H3K27Ac-rich regions, i.e. most likely regulatory promoter regions. (b) HEK293T cells were transfected with an expression vector for NFE2L2ΔETGE-V5 (lacking the KEAP1 regulatory domain). ChIP analysis was performed with anti-IgG or anti-V5 antibodies and the potential AREs with the highest score, termed ARE1, ARE2 and ARE3 (Table 1), were analyzed by qRT-PCR. The figure shows representative data normalized as the fold of enrichment with the anti-V5 antibody vs. the IgG antibody. The presence of already known AREs in HMOX1, NQO1 and SQSTM1 was analyzed as positive control and ACTB, and a region of NQO1 that does not contain an ARE (NQO1*) were amplified as negative controls. (c), Luciferase reporter constructs carrying 3 tandem putative ARE sequences from the LAMP2 gene (i-iii) or a scramble sequence as negative control (iv) controlling the expression of luciferase. (d) nfe2l2-KO mouse embryo fibroblasts were co-transfected with the reporters in C and increasing amounts of NFE2L2ΔETGE-V5 construct. Values were normalized to pTK-Renilla activity and presented as fold of change. Data are mean ± SD (n = 3). Statistical analysis was performed using Student’s t test. *p < 0.05, ** p < 0.01 and *** p < 0.001 vs. basal levels.
Figure 1. NFE2L2 binds to 2 functional antioxidant response elements (AREs) in the LAMP2 gene. (a) Scheme of the LAMP2 gene showing the 3 splice variants: LAMP2A, LAMP2B and LAMP2C, from The Encyclopedia of DNA Elements at UCSC (ENCODE) for human genome. Putative AREs in the LAMP2 gene were identified taking as reference the available information from ChIP of ARE-binding factors MAFK, MAFF and BACH1. These regions were localized in 200–400 base-pair-long DNAse-sensitive and H3K27Ac-rich regions, i.e. most likely regulatory promoter regions. (b) HEK293T cells were transfected with an expression vector for NFE2L2ΔETGE-V5 (lacking the KEAP1 regulatory domain). ChIP analysis was performed with anti-IgG or anti-V5 antibodies and the potential AREs with the highest score, termed ARE1, ARE2 and ARE3 (Table 1), were analyzed by qRT-PCR. The figure shows representative data normalized as the fold of enrichment with the anti-V5 antibody vs. the IgG antibody. The presence of already known AREs in HMOX1, NQO1 and SQSTM1 was analyzed as positive control and ACTB, and a region of NQO1 that does not contain an ARE (NQO1*) were amplified as negative controls. (c), Luciferase reporter constructs carrying 3 tandem putative ARE sequences from the LAMP2 gene (i-iii) or a scramble sequence as negative control (iv) controlling the expression of luciferase. (d) nfe2l2-KO mouse embryo fibroblasts were co-transfected with the reporters in C and increasing amounts of NFE2L2ΔETGE-V5 construct. Values were normalized to pTK-Renilla activity and presented as fold of change. Data are mean ± SD (n = 3). Statistical analysis was performed using Student’s t test. *p < 0.05, ** p < 0.01 and *** p < 0.001 vs. basal levels.CC BY-NC-ND · PubMed Central
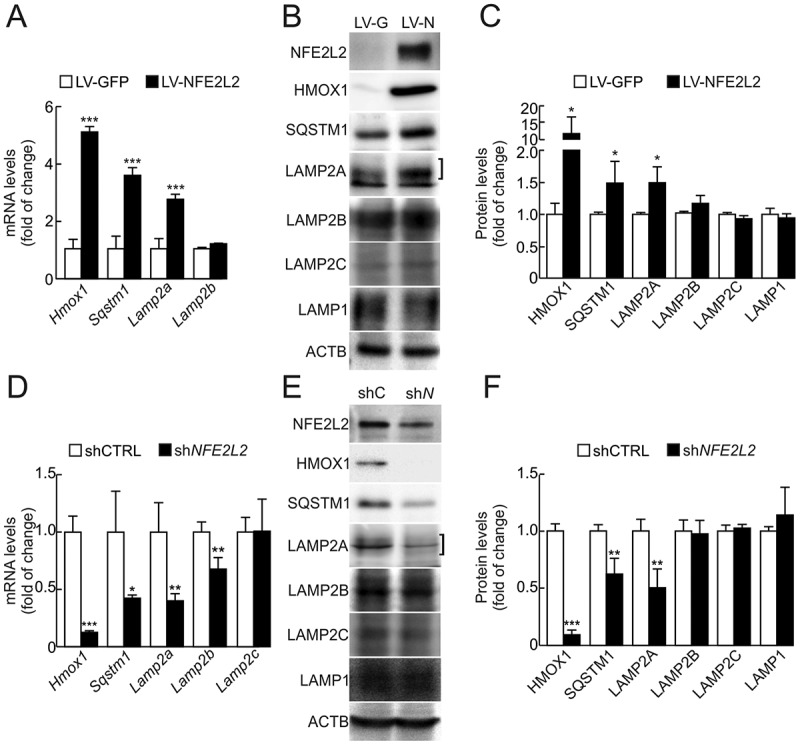
Figure 2. LAMP2A levels are modified upon genetic manipulation of NFE2L2. (a) HEK293T cells were transduced with GFP- or NFE2L2ΔETGE-V5-expressing lentivirus (LV-GFP or LV-NFE2L2, respectively). Expression levels of Hmox1, Sqstm1, Lamp2a, Lamp2b and Lamp2c were determined 3 days post-infection by qRT-PCR and normalized by Actb levels. Lamp2c levels were barely detectable in this cell type (data not shown). Data are mean ± SD (n = 4). Statistical analysis was performed with Student’s t test. ***p < 0.001 vs. LV-GFP-infected cells. (b) Representative immunoblots for the indicated proteins in cell lysates from cells transduced as in A. The bracket indicates the band corresponding to LAMP2A. (c) Densitometric quantification of representative immunoblots from B relative to ACTB protein levels. Data are mean ± SD (n = 4). Statistical analysis was performed using Student’s t test. *p < 0.05 vs. LV-GFP-infected cells. (d) A549 cells were transduced with lentivirus carrying shRNA against a scramble sequence (shCTRL) or against NFE2L2 (shNFE2L2). Expression levels of Hmox1, Sqstm1, Lamp2a, Lamp2b and Lamp2c were determined 3 days post-infection by qRT-PCR and normalized to Actb levels. Data are mean ± SD (n = 4). Statistical analysis was performed with Student’s t test. *p < 0.05, **p < 0.01 and ***p < 0.001 vs. shCTRL infected cells. (e) Representative immunoblots for the indicated proteins in cell lysates from cells transduced as in D. (f) Densitometric quantification of representative immunoblots from E relative to ACTB protein levels. Data are mean ± SD (n = 4). Statistical analysis was performed using Student’s t test. **p < 0.01 and ***p < 0.001 vs. shCTRL infected cells.
Figure 2. LAMP2A levels are modified upon genetic manipulation of NFE2L2. (a) HEK293T cells were transduced with GFP- or NFE2L2ΔETGE-V5-expressing lentivirus (LV-GFP or LV-NFE2L2, respectively). Expression levels of Hmox1, Sqstm1, Lamp2a, Lamp2b and Lamp2c were determined 3 days post-infection by qRT-PCR and normalized by Actb levels. Lamp2c levels were barely detectable in this cell type (data not shown). Data are mean ± SD (n = 4). Statistical analysis was performed with Student’s t test. ***p < 0.001 vs. LV-GFP-infected cells. (b) Representative immunoblots for the indicated proteins in cell lysates from cells transduced as in A. The bracket indicates the band corresponding to LAMP2A. (c) Densitometric quantification of representative immunoblots from B relative to ACTB protein levels. Data are mean ± SD (n = 4). Statistical analysis was performed using Student’s t test. *p < 0.05 vs. LV-GFP-infected cells. (d) A549 cells were transduced with lentivirus carrying shRNA against a scramble sequence (shCTRL) or against NFE2L2 (shNFE2L2). Expression levels of Hmox1, Sqstm1, Lamp2a, Lamp2b and Lamp2c were determined 3 days post-infection by qRT-PCR and normalized to Actb levels. Data are mean ± SD (n = 4). Statistical analysis was performed with Student’s t test. *p < 0.05, **p < 0.01 and ***p < 0.001 vs. shCTRL infected cells. (e) Representative immunoblots for the indicated proteins in cell lysates from cells transduced as in D. (f) Densitometric quantification of representative immunoblots from E relative to ACTB protein levels. Data are mean ± SD (n = 4). Statistical analysis was performed using Student’s t test. **p < 0.01 and ***p < 0.001 vs. shCTRL infected cells.CC BY-NC-ND · PubMed Central
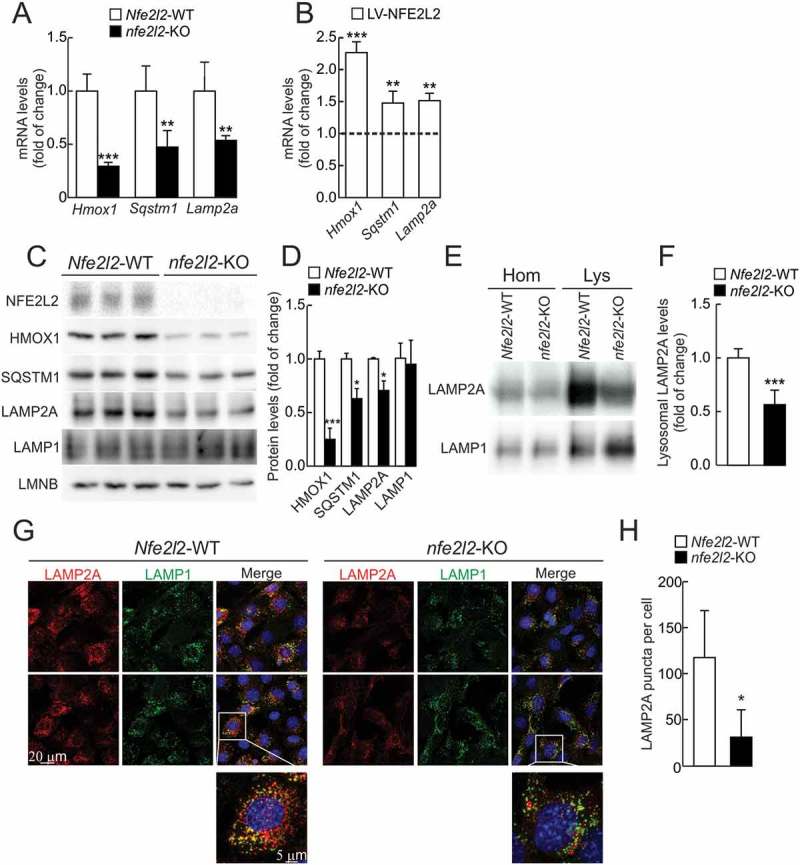
Figure 3. LAMP2A levels are reduced in the absence of NFE2L2. (a) Expression levels of Hmox1, Sqstm1 and Lamp2a from Nfe2l2-WT and nfe2l2-KO immortalized hepatocytes were determined by qRT-PCR and normalized to Actb levels. Data are mean ± SD (n = 4). Statistical analysis was performed with Student’s t test. **p < 0.01 and ***p < 0.001 vs. Nfe2l2-WT cells. (b) nfe2l2-KO immortalized hepatocytes were rescued with an NFE2L2ΔETGE-V5-expressing lentivirus (LV-NFE2L2). Expression levels of Hmox1, Sqstm1 and Lamp2a was analyzed 3 days post-infection by qRT-PCR and normalized to Tbp levels. The dotted line represents expression levels of nfe2l2-KO hepatocytes transduced with a control lentivirus (LV-GFP). Data are mean ± SD (n = 4). Statistical analysis was performed with Student’s t test. **p < 0.01 and ***p < 0.001 vs. LV-CTRL infected cells. (c) Representative immunoblots for the indicated proteins in cell lysates from Nfe2l2-WT and nfe2l2-KO immortalized hepatocytes. (d) Densitometric quantification of representative immunoblots from C relative to LMNB (lamin B) protein levels. Data are mean ± SD (n = 3). Statistical analysis was performed using Student’s t test. **p < 0.01 and ***p < 0.001 vs. Nfe2l2-WT cells. (e) Representative immunoblots of LAMP2A and LAMP1 in homogenates (Hom) and isolated lysosomes (Lys) from Nfe2l2-WT and nfe2l2-KO immortalized hepatocytes. (f) Densitometric quantification of representative immunoblots from E relative to LAMP1 levels. Data are mean ± SD (n = 6). Statistical analysis was performed using Student’s t test. ***p < 0.001 vs. Nfe2l2-WT levels. (g) Confocal analysis of double immunofluorescence with anti-LAMP2A (red) and anti-LAMP1 (green) antibodies in immortalized Nfe2l2-WT and nfe2l2-KO hepatocytes. The insert shows a higher magnification of the indicated cell. (h) Quantification of the total number of LAMP2A-positive puncta per cell. Values are mean ± SD (n = 3, with > 50 cells counted per experiment). Statistical analysis was performed using Student’s t test. *p < 0.05 vs. Nfe2l2-WT cells.
Figure 3. LAMP2A levels are reduced in the absence of NFE2L2. (a) Expression levels of Hmox1, Sqstm1 and Lamp2a from Nfe2l2-WT and nfe2l2-KO immortalized hepatocytes were determined by qRT-PCR and normalized to Actb levels. Data are mean ± SD (n = 4). Statistical analysis was performed with Student’s t test. **p < 0.01 and ***p < 0.001 vs. Nfe2l2-WT cells. (b) nfe2l2-KO immortalized hepatocytes were rescued with an NFE2L2ΔETGE-V5-expressing lentivirus (LV-NFE2L2). Expression levels of Hmox1, Sqstm1 and Lamp2a was analyzed 3 days post-infection by qRT-PCR and normalized to Tbp levels. The dotted line represents expression levels of nfe2l2-KO hepatocytes transduced with a control lentivirus (LV-GFP). Data are mean ± SD (n = 4). Statistical analysis was performed with Student’s t test. **p < 0.01 and ***p < 0.001 vs. LV-CTRL infected cells. (c) Representative immunoblots for the indicated proteins in cell lysates from Nfe2l2-WT and nfe2l2-KO immortalized hepatocytes. (d) Densitometric quantification of representative immunoblots from C relative to LMNB (lamin B) protein levels. Data are mean ± SD (n = 3). Statistical analysis was performed using Student’s t test. **p < 0.01 and ***p < 0.001 vs. Nfe2l2-WT cells. (e) Representative immunoblots of LAMP2A and LAMP1 in homogenates (Hom) and isolated lysosomes (Lys) from Nfe2l2-WT and nfe2l2-KO immortalized hepatocytes. (f) Densitometric quantification of representative immunoblots from E relative to LAMP1 levels. Data are mean ± SD (n = 6). Statistical analysis was performed using Student’s t test. ***p < 0.001 vs. Nfe2l2-WT levels. (g) Confocal analysis of double immunofluorescence with anti-LAMP2A (red) and anti-LAMP1 (green) antibodies in immortalized Nfe2l2-WT and nfe2l2-KO hepatocytes. The insert shows a higher magnification of the indicated cell. (h) Quantification of the total number of LAMP2A-positive puncta per cell. Values are mean ± SD (n = 3, with > 50 cells counted per experiment). Statistical analysis was performed using Student’s t test. *p < 0.05 vs. Nfe2l2-WT cells.CC BY-NC-ND · PubMed Central
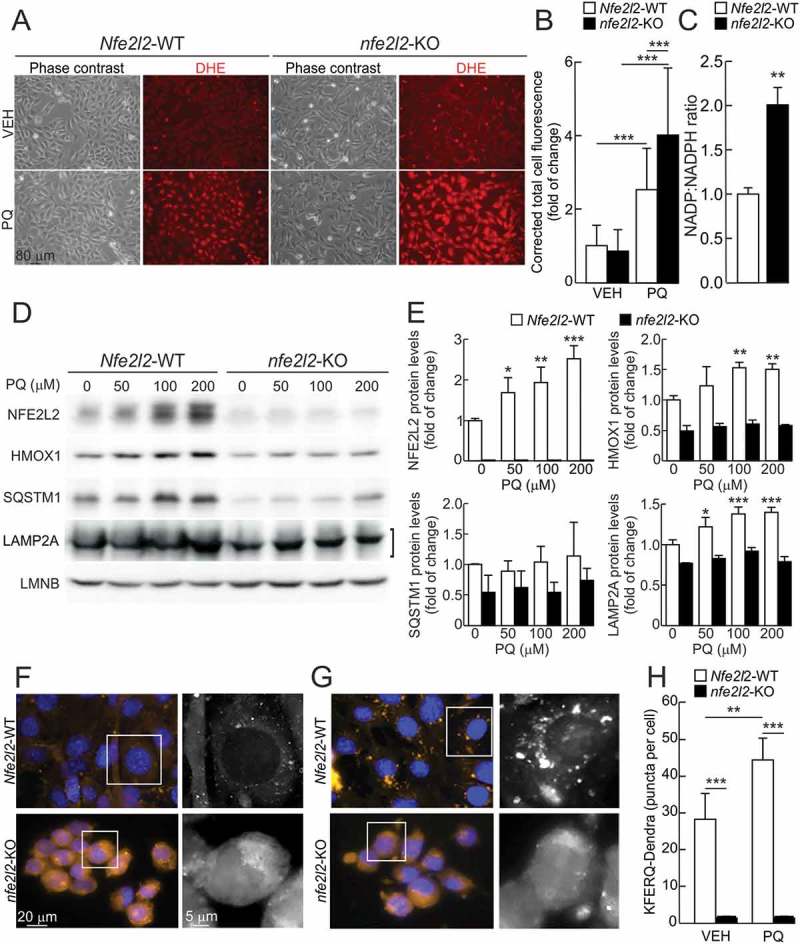
Figure 4. The oxidant agent paraquat (PQ) induces LAMP2A expression and CMA activity in an NFE2L2-dependent manner. (a) Representative images of ROS levels determined with the dihydroethidium probe (DHE) in immortalized Nfe2l2-WT and nfe2l2-KO hepatocytes in basal conditions or after treatment with 200 µM PQ for 16 h. The probe was added to a final concentration of 5 µM in the culture medium 1 h before in vivo imaging of the cells. (b) Corrected total cell fluorescence of representative images from A. Values are mean ± SD (n = 100 cells, derived from at least 3 different fields). Statistical analysis was performed using Student t test. ***p < 0.001 vs. untreated conditions. (c) NADP:NADPH ratio in immortalized Nfe2l2-WT and nfe2l2-KO hepatocytes. Data are mean ± SD (n = 4). Statistical analysis was performed using Student’s t test. **p < 0.01 vs. Nfe2l2-WT cells. (d) Immortalized hepatocytes from Nfe2l2-WT and nfe2l2-KO mice were submitted to the indicated concentrations of PQ for 16 h. Representative immunoblots for the indicated proteins in cell lysates. Note that anti-NFE2L2 antibody recognizes a nonspecific band in nfe2l2-KO cells. (e) Densitometric quantification of representative immunoblots from D relative to LMNB protein levels. Data are mean ± SD (n = 3). Statistical analysis was performed using Student’s t test. *p < 0.05, **p < 0.01 and ***p < 0.001 vs. untreated conditions. (f and g) Nfe2l2-WT and nfe2l2-KO hepatocytes were transduced with lentivirus carrying the CMA reporter KFERQ-PS-Dendra and, after photoswitching, were cultured without additions (f) or in the presence of 100 µM paraquat (PQ) (g) for 16 h. CMA was analyzed as the number of fluorescent puncta per cell at the end of the incubation time. Representative full-field images and insert showing black and white high magnification of the boxed regions in the Dendra channel. (h) Quantification of the number of puncta per cell after the indicated treatment. Values are mean ± SD (n = 3, with > 75 cells per experiment). Statistical analysis was performed using Student’s t test. **p < 0.01 and ***p < 0.001 vs. Nfe2l2-WT cells or untreated conditions.
Figure 4. The oxidant agent paraquat (PQ) induces LAMP2A expression and CMA activity in an NFE2L2-dependent manner. (a) Representative images of ROS levels determined with the dihydroethidium probe (DHE) in immortalized Nfe2l2-WT and nfe2l2-KO hepatocytes in basal conditions or after treatment with 200 µM PQ for 16 h. The probe was added to a final concentration of 5 µM in the culture medium 1 h before in vivo imaging of the cells. (b) Corrected total cell fluorescence of representative images from A. Values are mean ± SD (n = 100 cells, derived from at least 3 different fields). Statistical analysis was performed using Student t test. ***p < 0.001 vs. untreated conditions. (c) NADP:NADPH ratio in immortalized Nfe2l2-WT and nfe2l2-KO hepatocytes. Data are mean ± SD (n = 4). Statistical analysis was performed using Student’s t test. **p < 0.01 vs. Nfe2l2-WT cells. (d) Immortalized hepatocytes from Nfe2l2-WT and nfe2l2-KO mice were submitted to the indicated concentrations of PQ for 16 h. Representative immunoblots for the indicated proteins in cell lysates. Note that anti-NFE2L2 antibody recognizes a nonspecific band in nfe2l2-KO cells. (e) Densitometric quantification of representative immunoblots from D relative to LMNB protein levels. Data are mean ± SD (n = 3). Statistical analysis was performed using Student’s t test. *p < 0.05, **p < 0.01 and ***p < 0.001 vs. untreated conditions. (f and g) Nfe2l2-WT and nfe2l2-KO hepatocytes were transduced with lentivirus carrying the CMA reporter KFERQ-PS-Dendra and, after photoswitching, were cultured without additions (f) or in the presence of 100 µM paraquat (PQ) (g) for 16 h. CMA was analyzed as the number of fluorescent puncta per cell at the end of the incubation time. Representative full-field images and insert showing black and white high magnification of the boxed regions in the Dendra channel. (h) Quantification of the number of puncta per cell after the indicated treatment. Values are mean ± SD (n = 3, with > 75 cells per experiment). Statistical analysis was performed using Student’s t test. **p < 0.01 and ***p < 0.001 vs. Nfe2l2-WT cells or untreated conditions.CC BY-NC-ND · PubMed Central
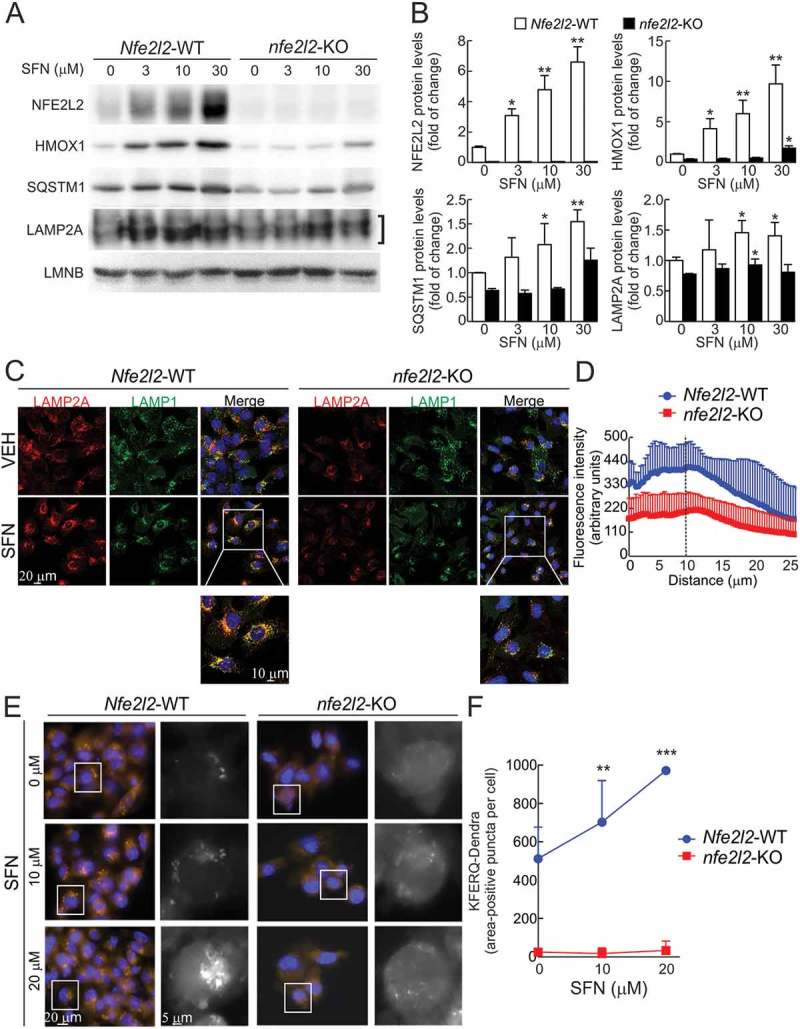
Figure 5. Pharmacological activation of NFE2L2 induces LAMP2A levels and CMA activation. (a) Immortalized hepatocytes from Nfe2l2-WT and nfe2l2-KO mice were submitted to the indicated concentrations of sulforaphane (SFN) for 16 h. Representative immunoblots for the indicated proteins in cell lysates. Note that anti-NFE2L2 antibody recognizes a nonspecific band in nfe2l2-KO cells. (b) Densitometric quantification of representative immunoblots from A relative to LMNB protein levels. Data are mean ± SD (n = 3). Statistical analysis was performed using Student’s t test. *p < 0.05, **p < 0.01 and ***p < 0.001 vs. untreated conditions. (c) Confocal analysis of double immunofluorescence with anti-LAMP2A (red) and anti-LAMP1 (green) antibodies in immortalized Nfe2l2-WT and nfe2l2-KO hepatocytes treated with vehicle (VEH) or 15 µM SFN for 16 h. The insert shows a higher magnification of the indicated cells. (d) Radial profile of LAMP2A fluorescence in cells treated with SFN in A. The graph shows the total mean fluorescence as a function of radial distance to the center of the cell. The dashed line represents the nuclear limits. Values are mean ± SD (n = 3, with > 50 cells counted per experiment). (e) Nfe2l2-WT and nfe2l2-KO hepatocytes were transduced with lentivirus carrying the CMA reporter KFERQ-PS-Dendra and, after photoswitching, were cultured without additions or in the presence of 10 µM or 20 µM SFN for 16 h. CMA was analyzed as the number of fluorescent puncta per cell at the end of the incubation time. Representative full-field images and insert showing black and white high magnification of the boxed regions in the Dendra channel. (f) Quantification of the KFERQ-Dendra-positive area per cell. Values are mean ± SD (n = 3, with > 75 cells per experiment). Statistical analysis was performed using Student t test. **p < 0.01 and ***p < 0.001 vs. untreated conditions.
Figure 5. Pharmacological activation of NFE2L2 induces LAMP2A levels and CMA activation. (a) Immortalized hepatocytes from Nfe2l2-WT and nfe2l2-KO mice were submitted to the indicated concentrations of sulforaphane (SFN) for 16 h. Representative immunoblots for the indicated proteins in cell lysates. Note that anti-NFE2L2 antibody recognizes a nonspecific band in nfe2l2-KO cells. (b) Densitometric quantification of representative immunoblots from A relative to LMNB protein levels. Data are mean ± SD (n = 3). Statistical analysis was performed using Student’s t test. *p < 0.05, **p < 0.01 and ***p < 0.001 vs. untreated conditions. (c) Confocal analysis of double immunofluorescence with anti-LAMP2A (red) and anti-LAMP1 (green) antibodies in immortalized Nfe2l2-WT and nfe2l2-KO hepatocytes treated with vehicle (VEH) or 15 µM SFN for 16 h. The insert shows a higher magnification of the indicated cells. (d) Radial profile of LAMP2A fluorescence in cells treated with SFN in A. The graph shows the total mean fluorescence as a function of radial distance to the center of the cell. The dashed line represents the nuclear limits. Values are mean ± SD (n = 3, with > 50 cells counted per experiment). (e) Nfe2l2-WT and nfe2l2-KO hepatocytes were transduced with lentivirus carrying the CMA reporter KFERQ-PS-Dendra and, after photoswitching, were cultured without additions or in the presence of 10 µM or 20 µM SFN for 16 h. CMA was analyzed as the number of fluorescent puncta per cell at the end of the incubation time. Representative full-field images and insert showing black and white high magnification of the boxed regions in the Dendra channel. (f) Quantification of the KFERQ-Dendra-positive area per cell. Values are mean ± SD (n = 3, with > 75 cells per experiment). Statistical analysis was performed using Student t test. **p < 0.01 and ***p < 0.001 vs. untreated conditions.CC BY-NC-ND · PubMed Central
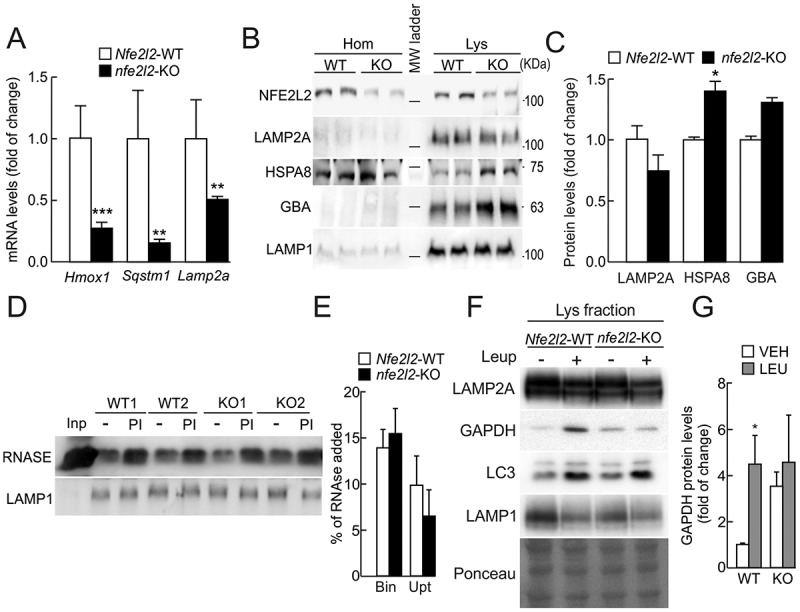
Figure 6. Role of NFE2L2 in the modulation of CMA in vivo. (a) Expression levels of Hmox1, Sqstm1 and Lamp2a in livers from Nfe2l2-WT and nfe2l2-KO mice were determined by qRT-PCR and normalized by the geometric mean between Actb and Tbp levels. Data are mean ± SEM (n = 4). Statistical analysis was performed using Student’s t test. **p < 0.01 and ***p < 0.001 vs. Nfe2l2-WT mice. (b) Immunoblots for the indicated proteins in homogenates and isolated lysosomes from livers of Nfe2l2-WT or nfe2l2-KO mice. Note that anti-NFE2L2 antibody recognizes a nonspecific band in nfe2l2-KO cells. (c) Densitometric quantification of lysosomal proteins in B relative to LAMP1 levels. Data are mean ± SD (n = 3 livers per mouse genotype). Statistical analysis was performed using Student’s t test. *p < 0.05 vs. Nfe2l2-WT mice. (d) Lysosomes isolated from livers of Nfe2l2-WT or nfe2l2-KO mice were pretreated or not with protease inhibitors (PI) to inhibit lysosomal proteolysis and incubated with purified RNASE for 20 min at 37ºC. At the end of the incubation, lysosomes were recovered by centrifugation and subjected to SDS-PAGE and immunoblot for the indicated proteins. LAMP1 is shown as control of similar lysosomal recovery after the incubation. (e) Densitometric quantification of RNASE binding (Bin) and uptake (Upt) in Nfe2l2-WT or nfe2l2-KO isolated lysosomes. Data are mean ± SD (n = 3 livers per mouse genotype). Statistical analysis was performed using Student’s t test. (f) Nfe2l2-WT and nfe2l2-KO mice were starved for 24 h. Lysosomal proteolysis was inhibited in vivo with 2 intraperitoneal injections of leupeptin (2 mg/100g body weight) 16 and 2 h before sacrifice. Representative immunoblots of the indicated endogenous proteins in lysosomal-enriched fractions from livers of Nfe2l2-WT (WT) and nfe2l2-KO (KO) mice. (g) Densitometric quantification of representative immunoblots from F relative to total protein levels stained with Ponceau Red. Data are mean ± SD (n = 3). Statistical analysis was performed using Student’s t test. *p < 0.05 vs. Nfe2l2-WT vehicle-treated mice.
Figure 6. Role of NFE2L2 in the modulation of CMA in vivo. (a) Expression levels of Hmox1, Sqstm1 and Lamp2a in livers from Nfe2l2-WT and nfe2l2-KO mice were determined by qRT-PCR and normalized by the geometric mean between Actb and Tbp levels. Data are mean ± SEM (n = 4). Statistical analysis was performed using Student’s t test. **p < 0.01 and ***p < 0.001 vs. Nfe2l2-WT mice. (b) Immunoblots for the indicated proteins in homogenates and isolated lysosomes from livers of Nfe2l2-WT or nfe2l2-KO mice. Note that anti-NFE2L2 antibody recognizes a nonspecific band in nfe2l2-KO cells. (c) Densitometric quantification of lysosomal proteins in B relative to LAMP1 levels. Data are mean ± SD (n = 3 livers per mouse genotype). Statistical analysis was performed using Student’s t test. *p < 0.05 vs. Nfe2l2-WT mice. (d) Lysosomes isolated from livers of Nfe2l2-WT or nfe2l2-KO mice were pretreated or not with protease inhibitors (PI) to inhibit lysosomal proteolysis and incubated with purified RNASE for 20 min at 37ºC. At the end of the incubation, lysosomes were recovered by centrifugation and subjected to SDS-PAGE and immunoblot for the indicated proteins. LAMP1 is shown as control of similar lysosomal recovery after the incubation. (e) Densitometric quantification of RNASE binding (Bin) and uptake (Upt) in Nfe2l2-WT or nfe2l2-KO isolated lysosomes. Data are mean ± SD (n = 3 livers per mouse genotype). Statistical analysis was performed using Student’s t test. (f) Nfe2l2-WT and nfe2l2-KO mice were starved for 24 h. Lysosomal proteolysis was inhibited in vivo with 2 intraperitoneal injections of leupeptin (2 mg/100g body weight) 16 and 2 h before sacrifice. Representative immunoblots of the indicated endogenous proteins in lysosomal-enriched fractions from livers of Nfe2l2-WT (WT) and nfe2l2-KO (KO) mice. (g) Densitometric quantification of representative immunoblots from F relative to total protein levels stained with Ponceau Red. Data are mean ± SD (n = 3). Statistical analysis was performed using Student’s t test. *p < 0.05 vs. Nfe2l2-WT vehicle-treated mice.CC BY-NC-ND · PubMed Central

Verification

Claims the paper makes

The claims and statistics of this paper haven’t been checked yet.

Run the check — free, no account needed. It reads the open-access text and checks the sources it cites.

A few free checks a day · papers already verified open instantly · results are public

Claims other papers make about this one

Each is checked against this paper’s own text: does it say what the citing paper says it does?

Self-check

Percentages, sums and reported differences re-computed from the paper’s own numbers.

The self-check needs the paper’s full text.

Citations

Cites

Show all 6 references

Research works printed but not linked: 51

  1. 10.1126/science.2799391 · DOI
  2. Chiang HL, 1988, J Biol Chem, 263, 6797, 10.1016/S0021-9258(18)68713-7 · DOI
  3. Terlecky SR, 1993, J Biol Chem, 268, 23490, 10.1016/S0021-9258(19)49489-1 · DOI
  4. 10.1126/science.273.5274.501 · DOI · Paper page
  5. 10.1128/MCB.02070-07 · DOI
  6. 10.1083/jcb.137.4.825 · DOI
  7. 10.1074/jbc.272.9.5606 · DOI
  8. 10.1073/pnas.0507436103 · DOI · Paper page
  9. 10.1111/j.1600-0854.2005.00337.x · DOI
  10. 10.4049/jimmunol.1501476 · DOI
  11. 10.1089/dna.1995.14.863 · DOI
  12. 10.1016/j.biocel.2004.04.010 · DOI
  13. 10.1152/ajpcell.1995.269.5.C1200 · DOI
  14. 10.1091/mbc.e04-06-0477 · DOI
  15. Cuervo AM, 2000, J Cell Sci, 113, 4441, 10.1242/jcs.113.24.4441 · DOI
  16. 10.1093/hmg/ddm066 · DOI
  17. 10.1016/j.tibs.2014.02.002 · DOI
  18. 10.1038/ncomms4496 · DOI · Paper page
  19. 10.1179/1476830515Y.0000000038 · DOI
  20. 10.1080/15548627.2016.1208889 · DOI · Paper page
  21. 10.1016/j.redox.2015.07.003 · DOI
  22. 10.1016/j.gde.2014.04.003 · DOI
  23. 10.1074/jbc.M002102200 · DOI · Paper page
  24. 10.1038/nature11247 · DOI · Paper page
  25. 10.1093/nar/gkt997 · DOI
  26. 10.1534/g3.112.003202 · DOI
  27. 10.1371/journal.pcbi.0040005 · DOI
  28. 10.1038/ncomms1393 · DOI
  29. Cuervo AM, 1994, J Biol Chem, 269, 26374, 10.1016/S0021-9258(18)47204-3 · DOI
  30. 10.1034/j.1600-0854.2000.010707.x · DOI
  31. Sawada R, 1993, J Biol Chem, 268, 9014, 10.1016/S0021-9258(18)52972-0 · DOI
  32. 10.1074/jbc.M706863200 · DOI
  33. 10.1126/scitranslmed.3003182 · DOI
  34. 10.1016/j.molcel.2015.05.030 · DOI
  35. 10.1038/35022604 · DOI · Paper page
  36. 10.1038/35022595 · DOI · Paper page
  37. 10.4161/auto.24880 · DOI
  38. 10.1006/bbrc.1995.2528 · DOI
  39. 10.1002/mds.26141 · DOI
  40. 10.1038/nm.1851 · DOI · Paper page
  41. 10.1038/ncomms7823 · DOI
  42. 10.1111/acel.12310 · DOI
  43. 10.1523/JNEUROSCI.3049-12.2012 · DOI
  44. 10.1091/mbc.e07-11-1155 · DOI
  45. 10.1073/pnas.0400282101 · DOI
  46. 10.1523/JNEUROSCI.2111-04.2004 · DOI
  47. 10.1128/MCB.00180-12 · DOI
  48. 10.1002/glia.20947 · DOI
  49. 10.1016/j.freeradbiomed.2011.11.003 · DOI
  50. Arias E. Methods to study chaperone-mediated autophagy. Methods Enzymol. 2017;588:283–305. PubMed PMID: 28237106; PubMed Central PMCID: PMC4300957. · DOI
  51. 10.1016/0076-6879(90)82018-W · DOI · Paper page

Cited by

Sorted by citations

Metadata

Authors
Pajares, M., Rojo, A. I., Arias, E., Díaz-Carretero, A., Cuervo, A. M., & Cuadrado, A.
Affiliations
  • Instituto de Investigaciones Biomédicas “Alberto Sols” UAM-CSIC, Instituto de Investigación Sanitaria La Paz (IdiPaz) and Department of Biochemistry, Faculty of Medicine, Autonomous University of Madrid, Madrid, Spain
  • Department of Developmental and Molecular Biology and Institute for Aging Studies, Albert Einstein College of Medicine, Bronx, NY, USA
Venue
Autophagy
Published
2018-07-26
Volume
14
Issue
8
Pages
1310-1322
ISSN
  • 1554-8627
  • 1554-8635
Cited by
218
References
6
Language
en
Funders
  • Autonomous University of Madrid (FPU)
  • Spanish Ministry of Economy and Competitiveness (SAF2016-76520-R)

About these checks

Registry, retraction, Cites and statistics results are computed, not judged, with one exception: a printed reference that no index lists is read once by a model before it counts as a citation error. Claims are extracted by a model and kept only when their quote appears verbatim in the text; each cited source is then checked, with a model’s help, for whether it says what the claim relies on. Those verdicts can be wrong — read the claim’s quote and the cited source before relying on one.

Statistics and arithmetic are recomputed, not judged.

Confidence bands are shown only for fields calibrated on our annotated test set. None is calibrated yet, so no band is shown.

What counts as a claim ›How we measure confidence ›How we check this ›

Are you an author, or do you see a problem with this page? Request a review