Cited by 54

The DOI matches its Crossref record; 4 of the 4 references it cites were found in a registry or an index.

A study of autophagy in hemocytes of the Pacific oyster, Crassostrea gigas

Picot, Sandy, Morga, Benjamin, Faury, Nicole, Chollet, Bruno, Dégremont, Lionel, Travers, Marie-Agnès, Renault, Tristan, Arzul, Isabelle·2019·Autophagy

Overview

The claims and statistics of this paper haven’t been checked yet.

Run the check — free, no account needed. It reads the open-access text and checks the sources it cites.

A few free checks a day · papers already verified open instantly · results are public

Integrity signals

Registry

Crossref · 10.1080/15548627.2019.1596490

Cites

4 of 4 references verified0 citation errors · 0 not checkable

Statistics

Figures

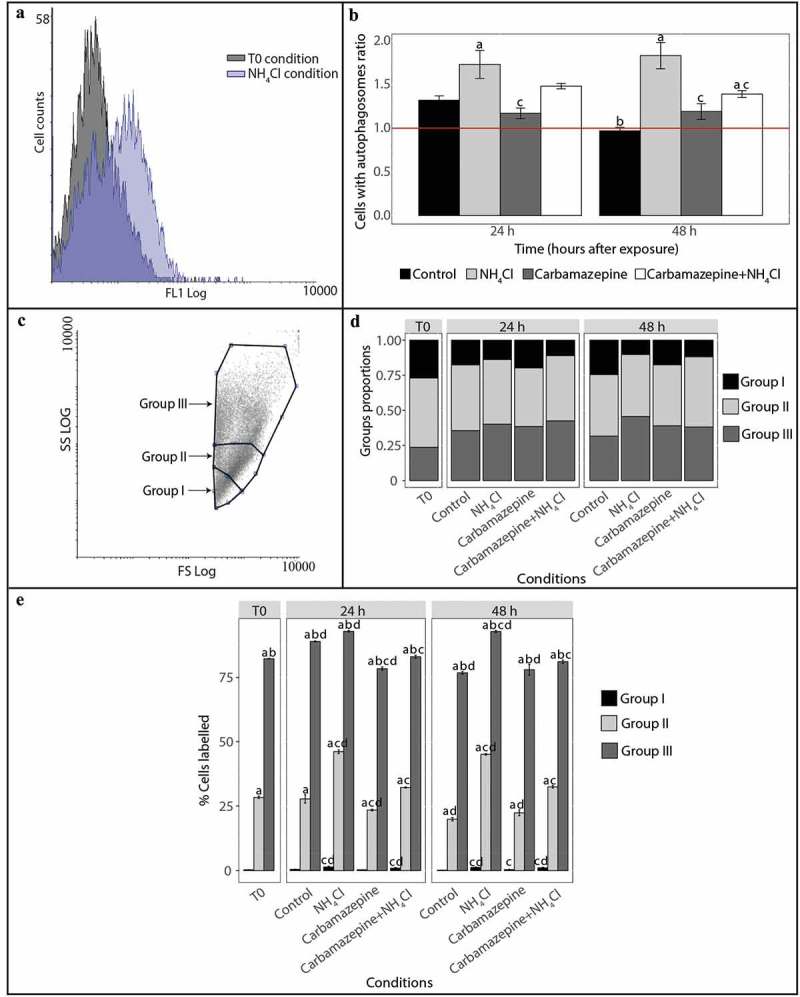
Figure 1. Detection and monitoring of autophagy in hemocytes of C. gigas by flow cytometry. (A) FL1 histogram overlay of hemocytes stained with Cyto ID® in normal condition (at T0) and presenting signs of autophagy inhibition (NH4Cl condition). The horizontal axis represents the fluorescence intensity, while the vertical axis represents the number of hemocytes. Based on Cyto ID® staining, two populations are defined: a negative cell population situated on the left of the histogram, and a positive cell population situated on the right of the histogram and only observed in the induced condition. (B) Ratios between percentages of hemocytes with autophagosomes in the different test conditions (control, NH4Cl, carbamazepine, carbamazepine+NH4Cl) after 24 or 48 h to those at T0. Values are means of nine replicates, and error bars represent standard deviation. a: significant difference between a treatment and the control condition at the respective time (p < 0.01). b: significant difference between control conditions at different times (p < 0.01). c: significant difference between a treatment and the NH4Cl condition at the respective time (p < 0.01). The red line represents the basal level of autophagy (T0 condition). (C) Forward scatter (FSC) vs. side scatter (SCC) density plot distinguishing 3 hemocyte populations. In order to define the hemocyte populations, 30,000 events were counted. Group I corresponds to hemocytes with low complexity and size, group II corresponds to hemocytes with moderate size and complexity, and group III corresponds to hemocytes with high complexity and size. (D) Proportion of hemocytes represented by each of the 3 populations at T0 and after 24 or 48 h post-exposure with different reagents (NH4Cl and/or carbamazepine). The control condition represents oysters only in seawater, without reagents. (E) Proportion of hemocytes represented by each of the 3 populations labelled with Cyto ID® at T0 and after 24 or 48 h post-exposure with different reagents (NH4Cl and/or carbamazepine). Values are means of 9 replicates, and error bars represent standard deviation. a: significant difference among respective cell populations relative to proportions of population I cells (p ≤ 0.0001). b: significant difference among respective cell populations relative to proportions of population II cells (p ≤ 0.0001). c: significant difference among respective cell populations relative to the control condition (p ≤ 0.05). d: significant difference among respective cell populations relative to T0 (p ≤ 0.05).
Figure 1. Detection and monitoring of autophagy in hemocytes of C. gigas by flow cytometry. (A) FL1 histogram overlay of hemocytes stained with Cyto ID® in normal condition (at T0) and presenting signs of autophagy inhibition (NH4Cl condition). The horizontal axis represents the fluorescence intensity, while the vertical axis represents the number of hemocytes. Based on Cyto ID® staining, two populations are defined: a negative cell population situated on the left of the histogram, and a positive cell population situated on the right of the histogram and only observed in the induced condition. (B) Ratios between percentages of hemocytes with autophagosomes in the different test conditions (control, NH4Cl, carbamazepine, carbamazepine+NH4Cl) after 24 or 48 h to those at T0. Values are means of nine replicates, and error bars represent standard deviation. a: significant difference between a treatment and the control condition at the respective time (p < 0.01). b: significant difference between control conditions at different times (p < 0.01). c: significant difference between a treatment and the NH4Cl condition at the respective time (p < 0.01). The red line represents the basal level of autophagy (T0 condition). (C) Forward scatter (FSC) vs. side scatter (SCC) density plot distinguishing 3 hemocyte populations. In order to define the hemocyte populations, 30,000 events were counted. Group I corresponds to hemocytes with low complexity and size, group II corresponds to hemocytes with moderate size and complexity, and group III corresponds to hemocytes with high complexity and size. (D) Proportion of hemocytes represented by each of the 3 populations at T0 and after 24 or 48 h post-exposure with different reagents (NH4Cl and/or carbamazepine). The control condition represents oysters only in seawater, without reagents. (E) Proportion of hemocytes represented by each of the 3 populations labelled with Cyto ID® at T0 and after 24 or 48 h post-exposure with different reagents (NH4Cl and/or carbamazepine). Values are means of 9 replicates, and error bars represent standard deviation. a: significant difference among respective cell populations relative to proportions of population I cells (p ≤ 0.0001). b: significant difference among respective cell populations relative to proportions of population II cells (p ≤ 0.0001). c: significant difference among respective cell populations relative to the control condition (p ≤ 0.05). d: significant difference among respective cell populations relative to T0 (p ≤ 0.05).CC BY-NC-ND · PubMed Central
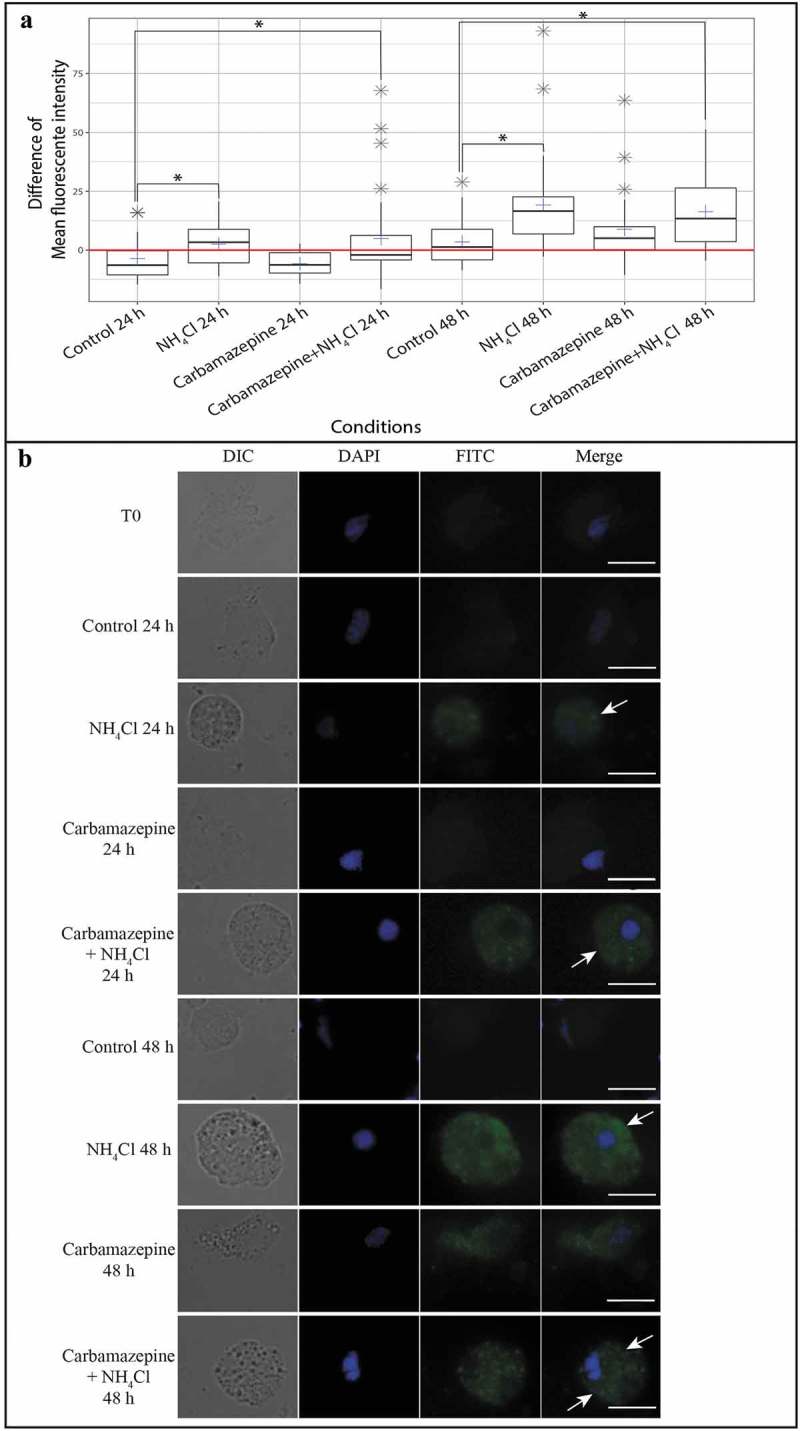
Figure 2. Observation and measurement of the fluorescence intensity of hemocytes stained with Cyto ID®. (A) Difference in the mean fluorescence intensity of hemocytes stained with Cyto ID® between each condition at different times and T0. Each blue cross represents the difference in the mean fluorescence intensity of the hemocytes of the selected condition. The red line represents the difference in the mean fluorescence intensity of hemocytes from that at T0. Gray stars represent outliers. Each boxplot was made with n = 30; * p ≤ 0.01. (B) Hemocyte pictures from different test conditions (NH4Cl, carbamazepine, carbamazepine+NH4Cl, and control) labelled with Cyto ID® (FITC) (column 3) and counterstained with DAPI (4′,6-diamidino-2-phenylindole) (blue) (column 2). A combined image merging results with DAPI and FITC is presented in column 4. The edges of hemocytes can be observed in white light (DIC) (column 1). White arrows show the accumulation of autophagosomes in the hemocytes’ cytoplasm. Scale bar: 10 µm.
Figure 2. Observation and measurement of the fluorescence intensity of hemocytes stained with Cyto ID®. (A) Difference in the mean fluorescence intensity of hemocytes stained with Cyto ID® between each condition at different times and T0. Each blue cross represents the difference in the mean fluorescence intensity of the hemocytes of the selected condition. The red line represents the difference in the mean fluorescence intensity of hemocytes from that at T0. Gray stars represent outliers. Each boxplot was made with n = 30; * p ≤ 0.01. (B) Hemocyte pictures from different test conditions (NH4Cl, carbamazepine, carbamazepine+NH4Cl, and control) labelled with Cyto ID® (FITC) (column 3) and counterstained with DAPI (4′,6-diamidino-2-phenylindole) (blue) (column 2). A combined image merging results with DAPI and FITC is presented in column 4. The edges of hemocytes can be observed in white light (DIC) (column 1). White arrows show the accumulation of autophagosomes in the hemocytes’ cytoplasm. Scale bar: 10 µm.CC BY-NC-ND · PubMed Central
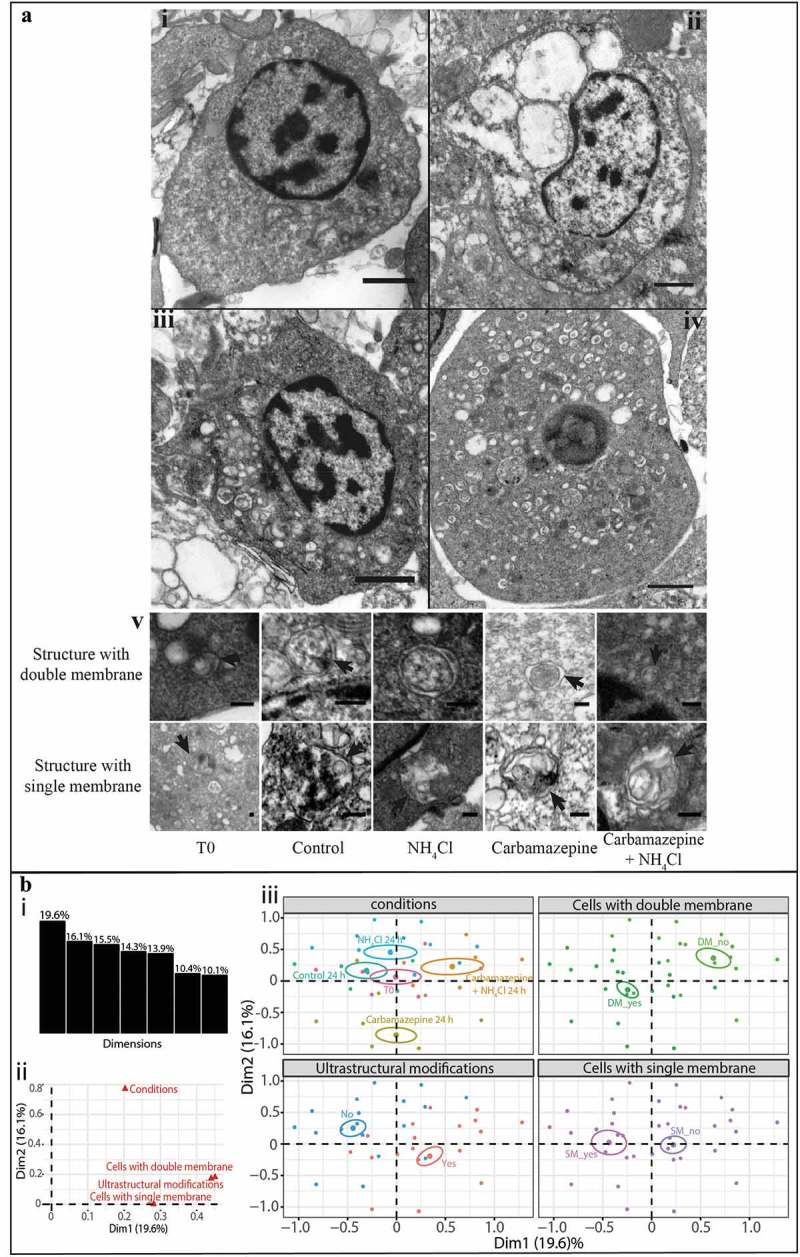
Figure 3. Detection of autophagic structures in hemocytes by transmission electron microscopy. (A) TEM observations of morphological modifications and autophagic structures in hemocytes of C. gigas; scale bar: 1 µm. i. hemocytes without ultrastructural modification (control condition); ii. hemocytes exposed to carbamazepine+NH4Cl presenting ultrastructural modifications; iii. hemocytes treated with an inhibitor of autophagy (NH4Cl) presenting autophagic structures; iv. hemocytes treated with an inducer of autophagy (carbamazepine) presenting autophagic structures. v. autophagic structures with double- or single-membrane-bound structures in all of the different conditions tested; scale bar: 200 µm. Arrow: presence of the double- or single-membrane-bound structure. (B) Results of the MCA of the different variables examined with the TEM approach. i. histogram of the percentages of variances explained by each dimension of the MCA; ii. variables’ contributions to each of the two first dimensions; iii. MCA plot representation of the tested variable (cells with double- or single-membrane-bound structures, changed ultrastructural state, and condition).
Figure 3. Detection of autophagic structures in hemocytes by transmission electron microscopy. (A) TEM observations of morphological modifications and autophagic structures in hemocytes of C. gigas; scale bar: 1 µm. i. hemocytes without ultrastructural modification (control condition); ii. hemocytes exposed to carbamazepine+NH4Cl presenting ultrastructural modifications; iii. hemocytes treated with an inhibitor of autophagy (NH4Cl) presenting autophagic structures; iv. hemocytes treated with an inducer of autophagy (carbamazepine) presenting autophagic structures. v. autophagic structures with double- or single-membrane-bound structures in all of the different conditions tested; scale bar: 200 µm. Arrow: presence of the double- or single-membrane-bound structure. (B) Results of the MCA of the different variables examined with the TEM approach. i. histogram of the percentages of variances explained by each dimension of the MCA; ii. variables’ contributions to each of the two first dimensions; iii. MCA plot representation of the tested variable (cells with double- or single-membrane-bound structures, changed ultrastructural state, and condition).CC BY-NC-ND · PubMed Central

Verification

Claims the paper makes

The claims and statistics of this paper haven’t been checked yet.

Run the check — free, no account needed. It reads the open-access text and checks the sources it cites.

A few free checks a day · papers already verified open instantly · results are public

Claims other papers make about this one

Each is checked against this paper’s own text: does it say what the citing paper says it does?

Self-check

Percentages, sums and reported differences re-computed from the paper’s own numbers.

The self-check needs the paper’s full text.

Citations

Cites

Show all 4 references

Research works printed but not linked: 42

  1. 10.1016/j.chom.2009.05.016 · DOI
  2. 10.1002/path.2697 · DOI
  3. 10.1038/sj.cdd.4401728 · DOI
  4. 10.1016/j.coi.2006.05.019 · DOI
  5. 10.1101/gad.1599207 · DOI
  6. 10.1083/jcb.200504035 · DOI · Paper page
  7. 10.1111/j.1432-1033.1979.tb12956.x · DOI
  8. 10.1007/s13277-014-2699-x · DOI
  9. 10.1038/nrd3802 · DOI
  10. 10.1038/nrd2272 · DOI · Paper page
  11. 10.1080/15548627.2015.1017188 · DOI
  12. 10.1007/978-1-59745-157-4_2 · DOI
  13. 10.1016/B978-0-12-801329-8.00005-2 · DOI
  14. 10.1038/srep09730 · DOI
  15. 10.1016/j.ymeth.2011.11.006 · DOI
  16. 10.1007/s00418-011-0869-0 · DOI
  17. Fisher WS., 1986, Proceedings in Life Sciences, 25
  18. 10.1016/j.jip.2015.05.005 · DOI
  19. 10.1016/j.cell.2014.11.006 · DOI · Paper page
  20. 10.1146/annurev-genet-102808-114910 · DOI · Paper page
  21. 10.1016/bs.aivir.2016.02.002 · DOI
  22. 10.4161/auto.5528 · DOI
  23. 10.1016/j.aquatox.2007.06.007 · DOI
  24. 10.1080/15548627.2015.1017181 · DOI · Paper page
  25. 10.1016/j.ymeth.2014.12.020 · DOI
  26. 10.1126/science.1190354 · DOI
  27. 10.1016/j.fsi.2017.12.003 · DOI
  28. 10.1038/cdd.2009.200 · DOI · Paper page
  29. 10.1093/toxsci/kfr179 · DOI
  30. 10.1016/j.cell.2010.01.028 · DOI · Paper page
  31. 10.1016/j.micron.2013.03.007 · DOI
  32. 10.4161/auto.7.9.16679 · DOI · Paper page
  33. 10.4161/auto.1.1.1270 · DOI · Paper page
  34. 10.1051/medsci/20132912015 · DOI
  35. 10.1128/IAI.73.4.1907-1916.2005 · DOI
  36. 10.1038/cdd.2014.143 · DOI
  37. 10.1111/febs.13515 · DOI
  38. 10.1016/j.aquaculture.2005.03.046 · DOI
  39. 10.1186/s12711-017-0297-2 · DOI
  40. Gagnaire B, 2005, Etude des effets de polluants sur les paramètres hémocytaires de l’huître creuse, Crassostrea gigas - Interactions entre environnement, mécanismes de défense et maladies infectieuses
  41. Lewis PR, 1977, Staining methods for sectioned material
  42. 10.1007/s10495-008-0187-8 · DOI

Cited by

Sorted by citations

Metadata

Authors
Picot, S., Morga, B., Faury, N., Chollet, B., Dégremont, L., Travers, M.-A., Renault, T., & Arzul, I.
Affiliations
  • SG2M-LGPMM, Laboratoire de Génétique et Pathologie des Mollusques Marins, Ifremer, La Tremblade, France
  • Département Ressources Biologiques et Environnement, Ifremer, Nantes, France
Venue
Autophagy
Published
2019-04-02
Volume
15
Issue
10
Pages
1801-1809
ISSN
  • 1554-8627
  • 1554-8635
Cited by
54
References
4
Language
en
Funders
European project VIVALDI (H2020 n°678589)

About these checks

Registry, retraction, Cites and statistics results are computed, not judged, with one exception: a printed reference that no index lists is read once by a model before it counts as a citation error. Claims are extracted by a model and kept only when their quote appears verbatim in the text; each cited source is then checked, with a model’s help, for whether it says what the claim relies on. Those verdicts can be wrong — read the claim’s quote and the cited source before relying on one.

Statistics and arithmetic are recomputed, not judged.

Confidence bands are shown only for fields calibrated on our annotated test set. None is calibrated yet, so no band is shown.

What counts as a claim ›How we measure confidence ›How we check this ›

Are you an author, or do you see a problem with this page? Request a review