

The DOI matches its Crossref record; 4 of the 4 references it cites were found in a registry or an index.
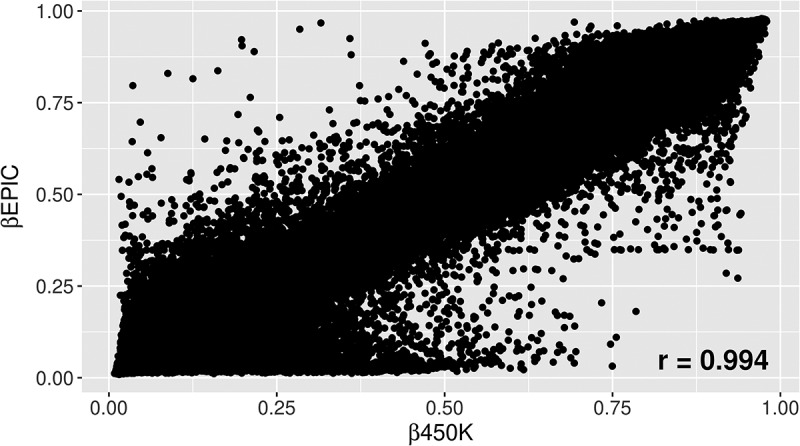
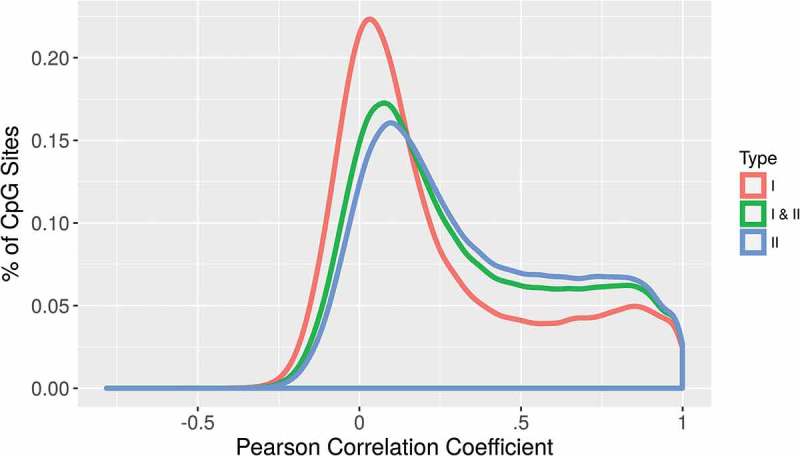
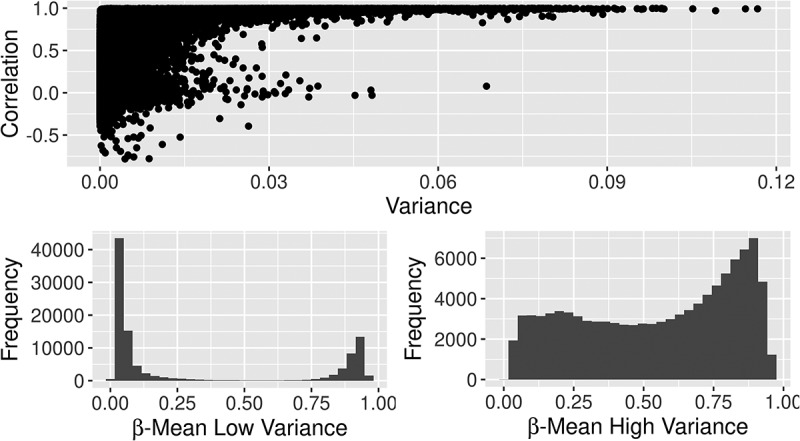
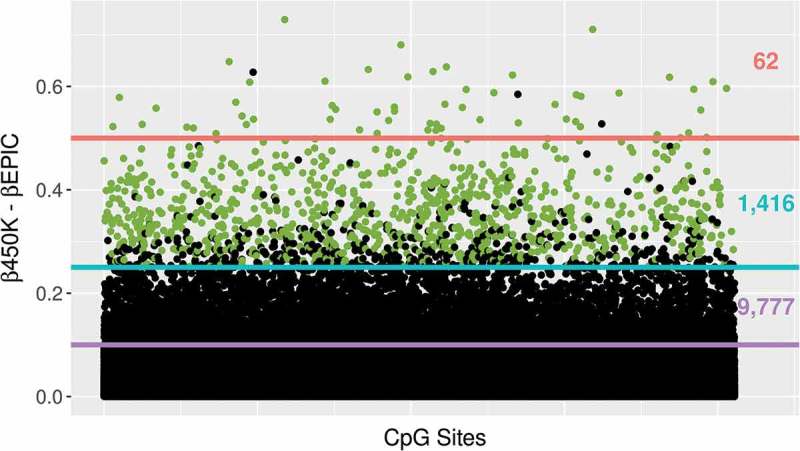
Comparison of DNA methylation measured by Illumina 450K and EPIC BeadChips in blood of newborns and 14-year-old children
Overview
The claims and statistics of this paper haven’t been checked yet.
Run the check — free, no account needed. It reads the open-access text and checks the sources it cites.
Integrity signals
Registry
Cites
Statistics
Figures
Verification
Claims the paper makes
The claims and statistics of this paper haven’t been checked yet.
Run the check — free, no account needed. It reads the open-access text and checks the sources it cites.
Claims other papers make about this one
Each is checked against this paper’s own text: does it say what the citing paper says it does?
The check wasn’t confident either way, so it gives no verdict — never disputed.
In the citing paper
“Similarly, metabolomic or proteomic data could be collected from plasma or serum, leading to different data distributions 34; measured using different technologies (e.g. mass spectrometry or aptamer-based assays); or tagged using different nomenclature39.”
From Validation of biomarkers of aging (2024) · cites this paper as [39]
Experimental — accuracy not yet measured
Self-check
Percentages, sums and reported differences re-computed from the paper’s own numbers.
The self-check needs the paper’s full text.
Citations
Cites
DNA methylation arrays as surrogate measures of cell mixture distribution
Houseman, E. A., Accomando, W. P., Koestler, D. C., Christensen, B. C., Marsit, C. J., Nelson, H. H., Wiencke, J. K., & Kelsey, K. T. (2012) · BMC Bioinformatics · doi:10.1186/1471-2105-13-86 · Cited by 3,175
High density DNA methylation array with single CpG site resolution
Bibikova, M., Barnes, B., Tsan, C., Ho, V., Klotzle, B., Le, J. M., Delano, D., Zhang, L., Schroth, G. P., Gunderson, K. L., et al. (2011) · Genomics · doi:10.1016/j.ygeno.2011.07.007 · Cited by 1,727 · cited 1×
“DNA was whole-genome amplified, enzymatically fragmented, purified, and applied to the Illumina Infinium HumanMethylation450 BeadChips (Illumina, San Diego, CA) according to the Illumina methylation protocol [11,12].”
MethodValidation of a DNA methylation microarray for 450,000 CpG sites in the human genome
Sandoval, J., Heyn, H., Moran, S., Serra-Musach, J., Pujana, M. A., Bibikova, M., & Esteller, M. (2011) · Epigenetics · doi:10.4161/epi.6.6.16196 · Cited by 990 · cited 1×
“DNA was whole-genome amplified, enzymatically fragmented, purified, and applied to the Illumina Infinium HumanMethylation450 BeadChips (Illumina, San Diego, CA) according to the Illumina methylation protocol [11,12].”
MethodSex differences in DNA methylation assessed by 450 K BeadChip in newborns
Yousefi, P., Huen, K., Davé, V., Barcellos, L., Eskenazi, B., & Holland, N. (2015) · BMC Genomics · doi:10.1186/s12864-015-2034-y · Cited by 205
Self-citation
Research works printed but not linked: 17
- 10.1186/s13059-016-1066-1 · DOI · Paper page
- 10.1093/ije/dyx190 · DOI
- 10.1186/s13148-017-0333-7 · DOI
- 10.2217/epi-2017-0078 · DOI · Paper page
- 10.1038/pr.2017.112 · DOI
- 10.1093/bioinformatics/btu049 · DOI
- 10.1289/EHP595 · DOI
- 10.3109/713610244 · DOI
- 10.1289/ehp.8540 · DOI
- 10.4161/epi.26037 · DOI
- 10.1093/nar/gkw967 · DOI
- 10.1186/1756-8935-6-4 · DOI
- 10.4161/epi.23470 · DOI
- 10.1080/15592294.2016.1161875 · DOI
- 10.1093/nar/gkw1138 · DOI
- 10.2202/1544-6115.1027 · DOI · Paper page
- R Core Team, 2017, R: A language and environment for statistical computing
Cited by
Sorted by citations
Validation of biomarkers of aging
Moqri, M., Herzog, C., Poganik, J. R., Ying, K., Justice, J. N., Belsky, D. W., Higgins-Chen, A. T., Chen, B. H., Cohen, A. A., Fuellen, G., et al. (2024) · Nature Medicine · doi:10.1038/s41591-023-02784-9 · Cited by 361
Biological embedding of experience: a primer on epigenetics
Aristizabal, M. J., Anreiter, I., Halldorsdottir, T., Odgers, C. L., McDade, T. W., Goldenberg, A., Mostafavi, S., Kobor, M. S., Binder, E. B., Sokolowski, M. B., et al. (2020) · Proceedings of the National Academy of Sciences · doi:10.1073/pnas.1820838116 · Cited by 268
Self-citationPhthalate exposure and long-term epigenomic consequences: a review
Dutta, S., Haggerty, D. K., Rappolee, D. A., & Ruden, D. M. (2020) · Frontiers in Genetics · doi:10.3389/fgene.2020.00405 · Cited by 212
Patterns of Reliability: Assessing the Reproducibility and Integrity of DNA Methylation Measurement
Sugden, K., Hannon, E. J., Arseneault, L., Belsky, D. W., Corcoran, D. L., Fisher, H. L., Houts, R. M., Kandaswamy, R., Moffitt, T. E., Poulton, R., et al. (2020) · Patterns · doi:10.1016/j.patter.2020.100014 · Cited by 151
Liu, Y., Eliot, M. N., Papandonatos, G. D., Kelsey, K. T., Fore, R., Langevin, S., Buckley, J., Chen, A., Lanphear, B. P., Cecil, K. M., et al. (2022) · Environmental Health Perspectives · doi:10.1289/ehp10118 · Cited by 78
Metadata
- Authors
- Solomon, O., MacIsaac, J., Quach, H., Tindula, G., Kobor, M. S., Huen, K., Meaney, M. J., Eskenazi, B., Barcellos, L. F., & Holland, N.
- Venue
- Epigenetics
- Publisher
- Informa UK Limited
- Published
- 2018-06-03
- Volume
- 13
- Issue
- 6
- Pages
- 655-664
- ISSN
- 1559-2294
- 1559-2308
- PMC
- PMC6140901
- Cited by
- 94
- References
- 4
- Language
- en
- Funders
- California Environmental Protection Agency (RD83171001, RD83273401)
- National Institute of Environmental Health Sciences (R01ES021369, R24ES028529, P01ES009605, R01ES012503, F31 ES027751)
- National Institutes of Health (UG3OD023356)
About these checks
Registry, retraction, Cites and statistics results are computed, not judged, with one exception: a printed reference that no index lists is read once by a model before it counts as a citation error. Claims are extracted by a model and kept only when their quote appears verbatim in the text; each cited source is then checked, with a model’s help, for whether it says what the claim relies on. Those verdicts can be wrong — read the claim’s quote and the cited source before relying on one.
Statistics and arithmetic are recomputed, not judged.
Confidence bands are shown only for fields calibrated on our annotated test set. None is calibrated yet, so no band is shown.
What counts as a claim ›How we measure confidence ›How we check this ›
Are you an author, or do you see a problem with this page? Request a review
