

The DOI matches its Crossref record; 57 of the 57 references it cites were found in a registry or an index.
Gut microbiota profiles in critically ill patients, potential biomarkers and risk variables for sepsis
Open accessAbstract
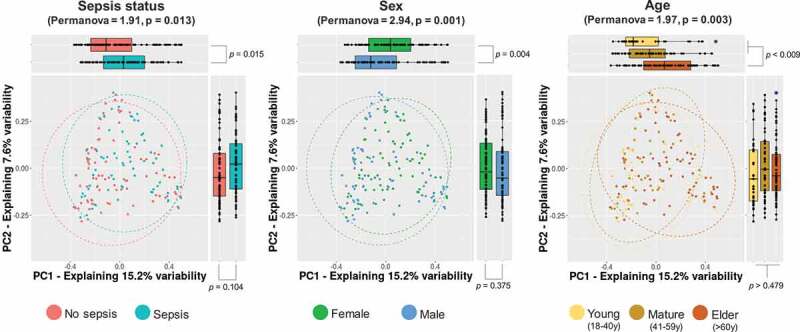
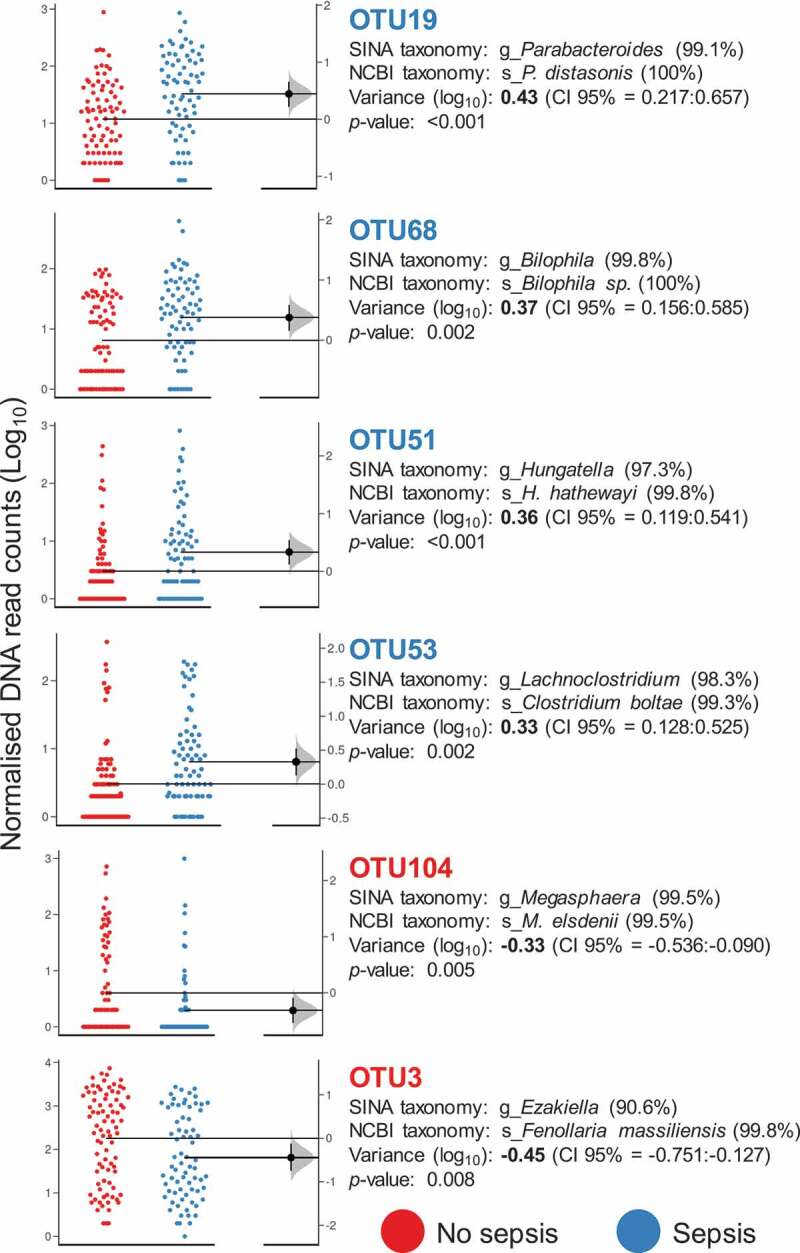
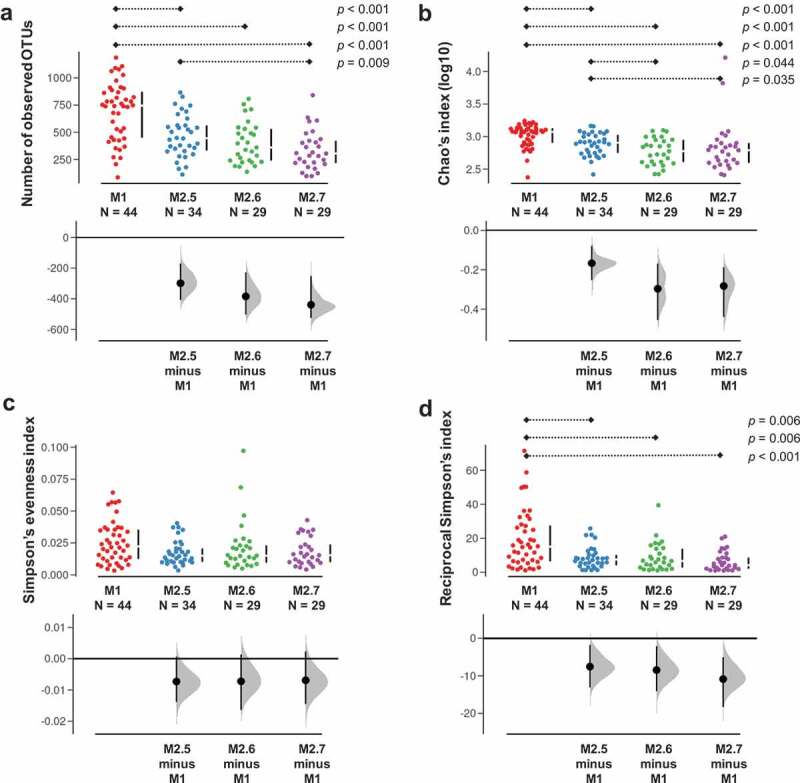
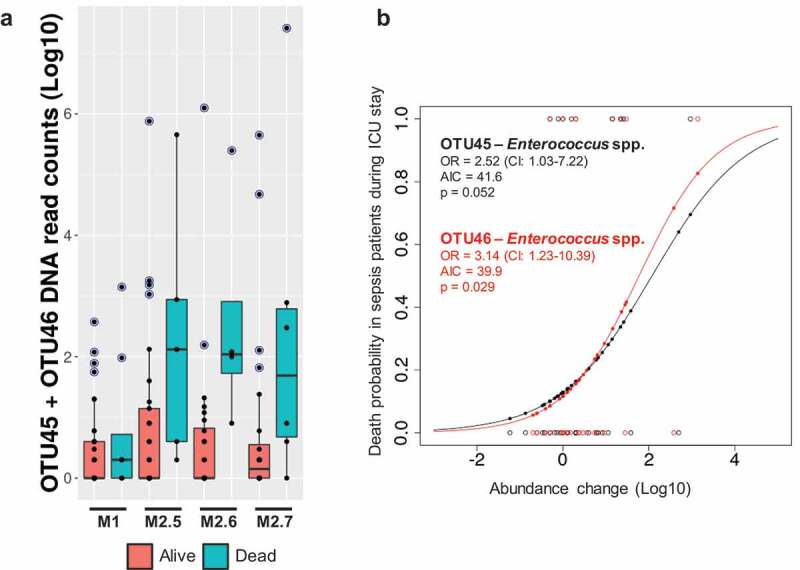
Critically ill patients are physiologically unstable and recent studies indicate that the intestinal microbiota could be involved in the health decline of such patients during ICU stays. This study aims to assess the intestinal microbiota in critically ill patients with and without sepsis and to determine its impact on outcome variables, such as medical complications, ICU stay time, and mortality. A multi-center study was conducted with a total of 250 peri-rectal swabs obtained from 155 patients upon admission and during ICU stays. Intestinal microbiota was assessed by sequencing the V3-V4 hypervariable regions of the 16S rRNA gene. Linear mixed models were used to integrate microbiota data with more than 40 clinical and demographic variables to detect covariates and minimize the effect of confounding factors. We found that the microbiota of ICU patients with sepsis has an increased abundance of microbes tightly associated with inflammation, such as Parabacteroides, Fusobacterium and Bilophila species. Female sex and aging would represent an increased risk for sepsis possibly because of some of their microbiota features. We also evidenced a remarkable loss of microbial diversity, during the ICU stay. Concomitantly, we detected that the abundance of pathogenic species, such as Enterococcus spp., was differentially increased in sepsis patients who died, indicating these species as potential biomarkers for monitoring during ICU stay. We concluded that particular intestinal microbiota signatures could predict sepsis development in ICU patients. We propose potential biomarkers for evaluation in the clinical management of ICU patients.
Overview
The claims and statistics of this paper haven’t been checked yet.
Run the check — free, no account needed. It reads the open-access text and checks the sources it cites.
Integrity signals
Registry
Cites
Statistics
Figures
Verification
Claims the paper makes
The claims and statistics of this paper haven’t been checked yet.
Run the check — free, no account needed. It reads the open-access text and checks the sources it cites.
Claims other papers make about this one
Each is checked against this paper’s own text: does it say what the citing paper says it does?
In the citing paper
“Induction of gut dysbiosis in septic patients has been previously reported (25, 26).”
From Sepsis-Induced Gut Dysbiosis Mediates the Susceptibility to Sepsis-Associated Encephalopathy in Mice (2022) · cites this paper as [25]
Self-check
Percentages, sums and reported differences re-computed from the paper’s own numbers.
The self-check needs the paper’s full text.
Citations
Cites
QIIME allows analysis of high-throughput community sequencing data
Caporaso, J. G., Kuczynski, J., Stombaugh, J., Bittinger, K., Bushman, F. D., Costello, E. K., Fierer, N., Peña, A. G., Goodrich, J. K., Gordon, J. I., et al. (2010) · Nature Methods · doi:10.1038/nmeth.f.303 · Cited by 34,887
The SILVA ribosomal RNA gene database project: improved data processing and web-based tools
Quast, C., Pruesse, E., Yilmaz, P., Gerken, J., Schweer, T., Yarza, P., Peplies, J., & Glöckner, F. O. (2012) · Nucleic Acids Research · doi:10.1093/nar/gks1219 · Cited by 33,055
The third international consensus definitions for sepsis and septic shock (Sepsis-3).
Singer, M., Deutschman, C. S., Seymour, C. W., Shankar-Hari, M., Annane, D., Bauer, M., Bellomo, R., Bernard, G. R., Chiche, J.-D., Coopersmith, C. M., et al. (2016) · JAMA · doi:10.1001/jama.2016.0287 · Cited by 28,250
Search and clustering orders of magnitude faster than BLAST
Edgar, R. C. (2010) · Bioinformatics · doi:10.1093/bioinformatics/btq461 · Cited by 21,098
Schloss, P. D., Westcott, S. L., Ryabin, T., Hall, J. R., Hartmann, M., Hollister, E. B., Lesniewski, R. A., Oakley, B. B., Parks, D. H., Robinson, C. J., et al. (2009) · Applied and Environmental Microbiology · doi:10.1128/aem.01541-09 · Cited by 19,549
FLASH: fast length adjustment of short reads to improve genome assemblies
Magoč, T., & Salzberg, S. L. (2011) · Bioinformatics · doi:10.1093/bioinformatics/btr507 · Cited by 15,366
UCHIME improves sensitivity and speed of chimera detection
Edgar, R. C., Haas, B. J., Clemente, J. C., Quince, C., & Knight, R. (2011) · Bioinformatics · doi:10.1093/bioinformatics/btr381 · Cited by 15,114
Klindworth, A., Pruesse, E., Schweer, T., Peplies, J., Quast, C., Horn, M., & Glöckner, F. O. (2013) · Nucleic Acids Research · doi:10.1093/nar/gks808 · Cited by 8,850
The Human Intestinal Microbiome in Health and Disease
Lynch, S. V., & Pedersen, O. (2016) · New England Journal of Medicine · doi:10.1056/nejmra1600266 · Cited by 3,637
Bacteroides : the Good, the Bad, and the Nitty-Gritty
Wexler, H. M. (2007) · Clinical Microbiology Reviews · doi:10.1128/cmr.00008-07 · Cited by 2,388
Research works printed but not linked: 5
- Konturek PC, 2015, J Physiol Pharmacol, 66, 483
- de la Cuesta-zuluaga J, 2019, mSystems, 4:e00261–19
- 10.1002/jpen.v43.7 · DOI
- Hooks KB, O’Malley MA, 2017, MBio, 8, e01492
- McDonald D, 2016, mSphere, 1:e00199–16
Cited by
Sorted by citations
The Firmicutes/Bacteroidetes Ratio: A Relevant Marker of Gut Dysbiosis in Obese Patients?
Magne, F., Gotteland, M., Gauthier, L., Zazueta, A., Pesoa, S., Navarrete, P., & Balamurugan, R. (2020) · Nutrients · doi:10.3390/nu12051474 · Cited by 2,335
Gut bacterial profiles in Parkinson's disease: A systematic review
Li, Z., Liang, H., Lu, L., Lu, L., Zheng, C., Fan, Y., Wu, B., Zou, T., Luo, X., Xinchun, Z., et al. (2022) · CNS Neuroscience & Therapeutics · doi:10.1111/cns.13990 · Cited by 224
Gut-Lung Crosstalk in Sepsis-Induced Acute Lung Injury
Zhou, X., & Liao, Y. (2021) · Frontiers in Microbiology · doi:10.3389/fmicb.2021.779620 · Cited by 153
“Concomitantly, researchers have detected an increased abundance of Enterococcus and other pathogenic bacteria in sepsis patients who died, suggesting that these bacteria may be potential biomarkers for ICU care (Agudelo-Ochoa et al., 2020).”
BackgroundSrdić, T., Đurašević, S., Lakic, I. V., Ružičić, A., Vujovic, P. Z., Jevdjovic, T. V., Dakic, T. B., Đorđević, J., Tosti, T. B., Glumac, S., et al. (2024) · International Journal of Molecular Sciences · doi:10.3390/ijms25147770 · Cited by 162
An Update on Sepsis Biomarkers
Kim, M.-H., & Choi, J. (2020) · Infection and Chemotherapy · doi:10.3947/ic.2020.52.1.1 · Cited by 117
Biomarkers for the Diagnosis of Neonatal Sepsis
Cantey, J. B., & Lee, J. H. (2021) · Clinics in Perinatology · doi:10.1016/j.clp.2021.03.012 · Cited by 117
Altered intestinal microbiome and metabolome correspond to the clinical outcome of sepsis
Sun, S., Wang, D., Dong, D., Xu, L., Xie, M., Wang, Y., Ni, T., Jiang, W., Zhu, X., Ning, N., et al. (2023) · Critical Care · doi:10.1186/s13054-023-04412-x · Cited by 117
The Gut Microbiota of Critically Ill Patients With COVID-19
Gaibani, P., D’Amico, F., Bartoletti, M., Lombardo, D., Rampelli, S., Fornaro, G., Coladonato, S., Siniscalchi, A., Re, M. C., Viale, P., et al. (2021) · Frontiers in Cellular and Infection Microbiology · doi:10.3389/fcimb.2021.670424 · Cited by 108
The central and biodynamic role of gut microbiota in critically ill patients
Wozniak, H., Beckmann, T. S., Fröhlich, L., Soccorsi, T., Terrier, C. L., de Watteville, A., Schrenzel, J., & Heidegger, C. (2022) · Critical Care · doi:10.1186/s13054-022-04127-5 · Cited by 102
Impact of contaminants on microbiota: linking the gut–brain axis with neurotoxicity
Balaguer-Trias, J., Deepika, D., Schuhmacher, M., & Kumar, V. (2022) · International Journal of Environmental Research and Public Health · doi:10.3390/ijerph19031368 · Cited by 88
Huang, Z., Hu, Z., Lu, C.-X., Luo, S.-D., Chen, Y., Zhou, Z.-P., Hu, J., Zhang, F.-L., Deng, F., & Liu, K. (2022) · Frontiers in Cellular and Infection Microbiology · doi:10.3389/fcimb.2022.1015386 · Cited by 93
Sepsis-Induced Gut Dysbiosis Mediates the Susceptibility to Sepsis-Associated Encephalopathy in Mice
Fang, H., Wang, Y., Deng, J., Zhang, H., Wu, Q., He, L., Xu, J., Shao, X., Ouyang, X., He, Z., et al. (2022) · mSystems · doi:10.1128/msystems.01399-21 · Cited by 87
“Induction of gut dysbiosis in septic patients has been previously reported (25, 26).”
BackgroundGut microbiota and sepsis: from pathogenesis to novel treatments
Kullberg, R. F. J., Wiersinga, W. J., & Haak, B. W. (2021) · Current Opinion in Gastroenterology · doi:10.1097/mog.0000000000000781 · Cited by 78
Bazzocchi, G., Turroni, S., Bulzamini, M. C., D’Amico, F., Bava, A., Castiglioni, M., Cagnetta, V., Losavio, E., Cazzaniga, M., Terenghi, L., et al. (2021) · Scientific Reports · doi:10.1038/s41598-021-92027-z · Cited by 78
Haak, B. W., Argelaguet, R., Kinsella, C. M., Kullberg, R. F. J., Lankelma, J. M., Deijs, M., Klein, M., Jebbink, M. F., Hugenholtz, F., Kostidis, S., et al. (2021) · mSystems · doi:10.1128/msystems.01148-20 · Cited by 75
Kombucha ameliorates LPS-induced sepsis in a mouse model
Wang, P., Feng, Z., Sang, X., Chen, W., Zhang, X., Xiao, J., Chen, Y., Chen, Q., Min-he, Y., & Su, J. (2021) · Food & Function · doi:10.1039/d1fo01839f · Cited by 70
Bai, Y., Ma, K., Li, J., Ren, Z., Zhang, J., & Shan, A. (2022) · Journal of Animal Science and Biotechnology/Journal of animal science and biotechnology · doi:10.1186/s40104-022-00737-9 · Cited by 60
Pathogenesis and therapeutic opportunities of gut microbiome dysbiosis in critical illness
Cho, N. A., Strayer, K., Dobson, B., & McDonald, B. (2024) · Gut Microbes · doi:10.1080/19490976.2024.2351478 · Cited by 60
Exploring the lung-gut direction of the gut-lung axis in patients with ARDS
Ziaka, M., & Exadaktylos, A. K. (2024) · Critical Care · doi:10.1186/s13054-024-04966-4 · Cited by 52
Sepsis: deriving biological meaning and clinical applications from high-dimensional data
Schuurman, A. R., Reijnders, T. D. Y., Kullberg, R. F. J., Butler, J. M., van der Poll, T., & Wiersinga, W. J. (2021) · Intensive Care Medicine Experimental · doi:10.1186/s40635-021-00383-x · Cited by 51
Prével, R., Enaud, R., Orieux, A., Camino, A., Berger, P., Boyer, A., Delhaès, L., & Gruson, D. (2022) · Critical Care · doi:10.1186/s13054-022-03980-8 · Cited by 49
Wu, Y., Zhang, Y., Xie, B., Abdelgawad, A. F., Chen, X., Han, M., Shang, Y., Yuan, S., & Zhang, J. (2021) · Journal of Neuroinflammation · doi:10.1186/s12974-021-02356-z · Cited by 39
Magnan, C., Lancry, T., Salipante, F., Trusson, R., Dunyach‐Remy, C., Roger, C., Lefrant, J., Massanet, P. L., & Lavigne, J. (2023) · Frontiers in Cellular and Infection Microbiology · doi:10.3389/fcimb.2023.1330900 · Cited by 41
Lower gut dysbiosis and mortality in acute critical illness: a systematic review and meta-analysis
Evans, T., Ali, U., Anderton, R. S., Raby, E., Manning, L. A., & Litton, E. (2023) · Intensive Care Medicine Experimental · doi:10.1186/s40635-022-00486-z · Cited by 37
Huang, C., Li, X., Li, H., Chen, R., Li, Z., Li, D., Xu, X., Zhang, G., Qin, L., Li, B., et al. (2024) · Journal of Translational Medicine · doi:10.1186/s12967-024-05232-5 · Cited by 36
Calorie restriction prevents age-related changes in the intestinal microbiota
Kurup, K., Matyi, S., Giles, C. B., Wren, J. D., Jones, K. L., Ericsson, A. C., Raftery, D., Wang, L., Promislow, D., Richardson, A. G., et al. (2021) · Aging · doi:10.18632/aging.202753 · Cited by 35
Early intestinal microbiota changes in aged and adult mice with sepsis
Yuan, Y., Liu, S., Ding, X., Li, Y., Zhang, X., Song, H., Qi, X., Zhang, Z., Guo, K., & Sun, T. (2022) · Frontiers in Cellular and Infection Microbiology · doi:10.3389/fcimb.2022.1061444 · Cited by 35
Liu, J., Chen, B., Jiang, M., Cui, T., Lv, B., Fu, Z., Li, X., Du, Y., Guo, J., Zhong, X., et al. (2023) · Food Science & Nutrition · doi:10.1002/fsn3.3622 · Cited by 34
Zhou, P., Zou, Z., Wu, W., Zhang, H., Wang, S., Tu, X., Huang, W., Chen, C., Zhu, S., Weng, Q., et al. (2023) · BMC Microbiology · doi:10.1186/s12866-023-03078-3 · Cited by 35
Deng, F., Chen, Y., Sun, Q., Lin, Z., Min, Y., Zhao, B.-C., Zhi-bin, H., Liu, W., Li, C., Hu, J., et al. (2022) · Journal of Medical Virology · doi:10.1002/jmv.28267 · Cited by 32
The key players of inflammasomes and pyroptosis in sepsis-induced pathogenesis and organ dysfunction
Zhu, L., Hu, M., Xu, H., Xu, H., Ren, B., Xu, R., Guo, M., Chen, H., Zhang, D., & Fang, H. (2025) · Frontiers in Pharmacology · doi:10.3389/fphar.2025.1586364 · Cited by 31
Emerging therapeutic targets for sepsis
Tindal, E. W., Armstead, B. E., Monaghan, S. F., Heffernan, D. S., & Ayala, A. (2021) · Expert Opinion on Therapeutic Targets · doi:10.1080/14728222.2021.1897107 · Cited by 30
Patrier, J., Villageois-Tran, K., Szychowiak, P., Ruckly, S., Gschwind, R., Wicky, P.-H., Gueye, S., Armand-Lefèvre, L., Marzouk, M., Sonneville, R., et al. (2022) · Critical Care · doi:10.1186/s13054-022-04164-0 · Cited by 29
Chen, Y., Zhang, F., Ye, X., Hu, J., Yang, X. Y., Yao, L., Zhao, B.-C., Deng, F., & Liu, K. (2022) · Frontiers in Cellular and Infection Microbiology · doi:10.3389/fcimb.2022.857035 · Cited by 28
Wang, X.-H., Xu, D., Chen, Y., Yue, S., Fu, R., Huang, L. J., & Tang, Y. (2022) · Frontiers in Pharmacology · doi:10.3389/fphar.2022.952938 · Cited by 29
Wang, S., Xiong, L., Ruan, Z., Gong, X., Luo, Y., Wu, C., Wang, Y., Shang, H. F., & Chen, J. (2023) · Molecular Medicine · doi:10.1186/s10020-023-00658-x · Cited by 27
Luo, Y., Gao, J., Su, X., Li, H., Li, Y., Qi, W., Han, X., Han, J., Zhao, Y., Zhang, A., et al. (2025) · EBioMedicine · doi:10.1016/j.ebiom.2025.105586 · Cited by 25
Luan, F., Zhou, Y., Ma, X., Li, Y., Peng, Y., Jia, X., Li, N., Wang, X., Luo, Y., Man, M., et al. (2024) · BMC Microbiology · doi:10.1186/s12866-024-03188-6 · Cited by 24
Lee, J.-J., Yong, D., Suk, K. T., Kim, D. J., Woo, H., Lee, S. S., & Kim, B. S. (2021) · Microorganisms · doi:10.3390/microorganisms9020352 · Cited by 23
The context-dependent effect of cellular senescence: From embryogenesis and wound healing to aging
Lavarti, R., Alvarez-Diaz, T., Marti, K., Kar, P., & Raju, R. P. (2025) · Ageing Research Reviews · doi:10.1016/j.arr.2025.102760 · Cited by 21
Ma, X., Jin, H., Chu, X., Dai, W., Tang, W., Zhu, J., Wang, F., Yang, X., Li, W., Liu, G., et al. (2022) · Frontiers in Microbiology · doi:10.3389/fmicb.2022.802409 · Cited by 22
Fontaine, C., Armand-Lefèvre, L., Magnan, M., Nazimoudine, A., Timsit, J., & Ruppé, É. (2020) · PLoS ONE · doi:10.1371/journal.pone.0237260 · Cited by 22
Cao, X., Zhao, M., Wang, X., Lin, J., Yang, M., Zhong, L., Liang, L., Yue, Y., Du, J., Li, J., et al. (2024) · Phytomedicine · doi:10.1016/j.phymed.2024.155345 · Cited by 21
Progress in the study of the correlation between sepsis and intestinal microecology
Tao, Y.-L., Wang, J.-R., Liu, M., Liu, Y., Zhang, J., Zhou, Y., Li, S., & Zhu, S.-F. (2024) · Frontiers in Cellular and Infection Microbiology · doi:10.3389/fcimb.2024.1357178 · Cited by 22
Philips, C. A., Ahamed, R., Abduljaleel, J. K., Rajesh, S., & Augustine, P. (2022) · Journal of Clinical and Translational Hepatology · doi:10.14218/jcth.2021.00428 · Cited by 20
Persistence and Sexual Dimorphism of Gut Dysbiosis and Pathobiome after Sepsis and Trauma
Munley, J. A., Park, G., Kelly, L. S., Kannan, K. B., Mankowski, R. T., Casadesús, G., Chakrabarty, P., Wallet, S. M., Maile, R., Bible, L. E., et al. (2024) · Annals of Surgery · doi:10.1097/sla.0000000000006385 · Cited by 19
Opioids and Sepsis: Elucidating the Role of the Microbiome and microRNA-146
Abu, Y. F., Vitari, N., Yan, Y., & Roy, S. (2022) · International Journal of Molecular Sciences · doi:10.3390/ijms23031097 · Cited by 19
Li, C., & Shi, S. (2024) · Frontiers in Endocrinology · doi:10.3389/fendo.2023.1224396 · Cited by 19
Gut Microbiota Metabolites Targeting the Immune Response in Sepsis: Mechanisms and Therapies
Xu, P. (2025) · International Journal of General Medicine · doi:10.2147/ijgm.s539237 · Cited by 18
Probiotics in the Intensive Care Unit
Schuurman, A. R., Kullberg, R. F. J., & Wiersinga, W. J. (2022) · Antibiotics · doi:10.3390/antibiotics11020217 · Cited by 18
Tian, W. Z., Yue, Q., Fei, W., Yao, P., Han, R., Tang, J., & Tang, J. (2023) · Clinical Science · doi:10.1042/cs20230704 · Cited by 18
Herrera, G., Vega, L., Patarroyo, M. A., Ramírez, J. D., & Muñoz, M. (2021) · Scientific Reports · doi:10.1038/s41598-021-90380-7 · Cited by 18
Zuo, Z., Liu, P., Liu, T., Liu, X., Chen, Y., & Hu, Z. (2023) · Infection and Drug Resistance · doi:10.2147/idr.s440335 · Cited by 17
Zhang, Y., Wang, C., Lang, H., Yu, H., Zhou, M., Rao, X., Zhang, Q., Yi, L., Zhu, J., & Mi, M. (2024) · International Journal of Molecular Sciences · doi:10.3390/ijms25147837 · Cited by 17
Gut microbiota involved in myocardial dysfunction induced by sepsis
Xiao, K., Sun, Y., Song, J., Li, L., Mao, W., & Jiang, C. (2023) · Microbial Pathogenesis · doi:10.1016/j.micpath.2023.105984 · Cited by 16
Luo, Y., Zhou, Y., Huang, P., Zhang, Q., Luan, F., Peng, Y., Wei, J., Li, N., Wang, C., Wang, X., et al. (2023) · The EPMA Journal · doi:10.1007/s13167-023-00340-6 · Cited by 16
Interaction Between Altered Gut Microbiota and Sepsis: A Hypothesis or an Authentic Fact?
Nabizadeh, E., Sadeghi, J., Rezaee, M. A., Hasani, A., Kafil, H. S., Ghotaslou, A., Kadkhoda, H., & Ghotaslou, R. (2022) · Journal of Intensive Care Medicine · doi:10.1177/08850666221102796 · Cited by 16
Pathways and microbiome modifications related to surgery and enterocolitis in Hirschsprung disease
Biassoni, R., Marco, E. D., Squillario, M., Ugolotti, E., Mosconi, M., Faticato, M. G., Mattioli, G., Avanzini, S., & Prato, A. P. (2021) · Pediatric Surgery International · doi:10.1007/s00383-021-05012-y · Cited by 15
Relationship between gut microbiota dysbiosis and immune indicator in children with sepsis
Lin, X., Abdalla, M., Yang, J., Liu, L., Fu, Y., Zhang, Y., Yang, S., Han, Y., Ge, Y., Zhang, S., et al. (2023) · BMC Pediatrics · doi:10.1186/s12887-023-04349-8 · Cited by 15
Mikolás, M., Fauszt, P., Petrilla, A., Nemeth, P., Dávid, P., Szilágyi-Tolnai, E., Racz, A., Stágel, A., Gal, F., Gál, K., et al. (2025) · Scientific Reports · doi:10.1038/s41598-025-10848-8 · Cited by 14
Yang, J., Zhou, Y., Du, A., Zhang, Z., Wang, B., Tian, Y., Liu, H., Cai, L., Pang, F., Li, Y., et al. (2025) · npj Biofilms and Microbiomes · doi:10.1038/s41522-025-00791-x · Cited by 14
Gao, Y., Liu, L., Cui, Y., Zhang, J., & Wu, X. (2024) · Frontiers in Immunology · doi:10.3389/fimmu.2024.1266579 · Cited by 14
Gut microbiota: A novel target for sepsis treatment
Shang, W., Zhang, S., Yang, L., Liu, J., & Chen, D. (2025) · Chinese Medical Journal · doi:10.1097/cm9.0000000000003630 · Cited by 14
Zhou, Y., Luo, Y., Wang, X., Luan, F., Peng, Y., Li, Y., Ma, X., Jia, X., Li, N., Man, M., et al. (2023) · International Microbiology · doi:10.1007/s10123-023-00363-z · Cited by 13
The Gut Microbiota Contributes to Systemic Responses and Liver Injury in Gut-Derived Sepsis
Zhao, M., Ma, J., Liu, H., Luo, Y., Deng, H., Wang, D., Wang, F., & Zhang, P. (2023) · Microorganisms · doi:10.3390/microorganisms11071741 · Cited by 13
The possible role of gut microbiota dysbiosis in the pathophysiology of delirium in older persons
Ticinesi, A., Parise, A., Nouvenne, A., Cerundolo, N., Prati, B., & Meschi, T. (2023) · Microbiome Research Reports · doi:10.20517/mrr.2023.15 · Cited by 12
Leveraging the microbiome in the treatment of sepsis: potential pitfalls and new perspectives
Biemond, J. J., McDonald, B., & Haak, B. W. (2023) · Current Opinion in Critical Care · doi:10.1097/mcc.0000000000001019 · Cited by 12
Yu, G., Xie, W., Xiang, J., Ke, Y., Wang, Z., Tu, F., Wu, W., Hong, H., & Lin, X. (2025) · European Journal of Pharmacology · doi:10.1016/j.ejphar.2025.178229 · Cited by 11
Tian, Z., & Li, C. (2025) · Frontiers in Microbiology · doi:10.3389/fmicb.2025.1718549 · Cited by 11
Gut microbiota disturbances in hospitalized older adults with malnutrition and clinical outcomes
Fernández, S. S. M., Garcez, F. B., de Alencar, J. C. G., Bastos, A. A., Morley, J. E., Cederholm, T., Aprahamian, I., de Souza, H. P., Avelino‐Silva, T. J., Bindels, L. B., et al. (2024) · Nutrition · doi:10.1016/j.nut.2024.112369 · Cited by 12
Recent Insights into the Evolving Role of the Gut Microbiome in Critical Care
Lee, S., Wischmeyer, P. E., Mintz, C. D., & Serbanescu, M. A. (2024) · Critical Care Clinics · doi:10.1016/j.ccc.2024.11.002 · Cited by 11
Tong, Y., Zhang, J., Fu, Y., He, X., & Feng, Q. (2022) · Canadian Journal of Infectious Diseases and Medical Microbiology · doi:10.1155/2022/2549413 · Cited by 11
Liu, J., Chen, B., Huang, J., Li, X., Cui, T., Lv, B., Fu, Z., Zhao, X., Yang, W., & Gao, X. (2023) · Journal of Pharmaceutical and Biomedical Analysis · doi:10.1016/j.jpba.2023.115911 · Cited by 11
Effects of probiotic treatment on the prognosis of patients with sepsis: a systematic review
Gong, C., Xu, S., Pan, Y., Guo, S., Walline, J. H., Wang, X., Lü, X., Yu, S., Qin, M., Zhu, H., et al. (2025) · World Journal of Emergency Medicine · doi:10.5847/wjem.j.1920-8642.2025.018 · Cited by 10
Choi, M. H., Kim, D., Lee, K. H., Kim, H. J., Sul, W. J., & Jeong, S. H. (2024) · International Journal of Antimicrobial Agents · doi:10.1016/j.ijantimicag.2024.107330 · Cited by 10
Luo, Y., Liu, Y., Li, Q., Duan, H., Luo, Z., Yang, H., & Xu, L. (2022) · Journal of Applied Microbiology · doi:10.1111/jam.15724 · Cited by 10
Blaser, A. R., Preiser, J., & Forbes, A. (2022) · Current Opinion in Clinical Nutrition & Metabolic Care · doi:10.1097/mco.0000000000000893 · Cited by 10
Fecal metabolite profiling identifies critically ill patients with increased 30-day mortality
de Porto, A. P. N. A., Dylla, N. P., Stutz, M. R., Lin, H., Khalid, M., Mullowney, M. W., Little, J., Rose, A. R., Moran, D., McMillin, M., et al. (2025) · Science Advances · doi:10.1126/sciadv.adt1466 · Cited by 9
DECIPHERING GUT MICROBIOTA IN PATIENTS WITH SEVERE SEPSIS AND SEPTIC SHOCK
Lee, S. J., Kim, D., Ann, H. W., Han, M., Lee, J. A., Lee, Y., Ahn, S., Seo, H. W., Kim, J. H., Ahn, J. Y., et al. (2023) · Shock · doi:10.1097/shk.0000000000002241 · Cited by 8
Lou, Z., Ouyang, H., Chen, G., Li, X., Chen, H., Zhan, Y., Peng, L., Du, C., Zheng, Z., Wen, L., et al. (2024) · Frontiers in Cellular and Infection Microbiology · doi:10.3389/fcimb.2023.1257317 · Cited by 8
Immunmodulation durch Ernährung bei kritisch kranken Patienten
Hirschberger, S., Schmid, A., & Kreth, S. (2023) · Die Anaesthesiologie · doi:10.1007/s00101-023-01258-4 · Cited by 8
Guerra, R. R., Fernandes, P. D. S., Lovison, O. V. A., Forni, G. D. R., de Oliveira, G. S., Viana, L. C., Pereira, D. C., Matos, W. L., Moretti, M. M. S., Volpato, F. C. Z., et al. (2025) · Frontiers in Cellular and Infection Microbiology · doi:10.3389/fcimb.2025.1622866 · Cited by 8
Tao, L., Zhu, Y., Wu, L., & Liu, J. (2024) · Frontiers in Molecular Biosciences · doi:10.3389/fmolb.2023.1322221 · Cited by 7
Liu, L., Ma, L., Liu, H., Zhao, F., Li, P., Zhang, J., Lü, X., Zhao, X., & Yi, Y. (2024) · mSystems · doi:10.1128/msystems.00788-24 · Cited by 7
Causal associations between gut microbiota and sepsis: A two‐sample Mendelian randomization study
You, J., Bi, X., Zhang, K., Xie, D., Chai, Y., Wen, S., Xian, Y., Fan, M., Xu, W., Li, M., et al. (2023) · European Journal of Clinical Investigation · doi:10.1111/eci.14064 · Cited by 7
Wang, Y., Feng, S., Shi, H., Lu, Y., Zhang, J., Zhang, W., Xu, Y., Liang, Q., & Sun, L. (2024) · Journal of Chromatography B · doi:10.1016/j.jchromb.2024.124101 · Cited by 6
Gut microbiota and its impact on critical illness
Battaglini, D., & Torres, A. (2025) · Current Opinion in Critical Care · doi:10.1097/mcc.0000000000001249 · Cited by 6
Sánchez-Sánchez, P., Gómez, F. J. S., & Benítez‐Páez, A. (2022) · Briefings in Bioinformatics · doi:10.1093/bib/bbac055 · Cited by 6
Unveiling the Therapeutic Potential of Probiotics in Sepsis: A Review
Wang, Z., Huang, J., & Zhao, P. (2025) · Food Science & Nutrition · doi:10.1002/fsn3.70364 · Cited by 5
The intricate interactions between the lungs and gut in patients: unraveling the crosstalk mechanism
Li, J., Chen, Y., & Hu, B. (2025) · Frontiers in Medicine · doi:10.3389/fmed.2025.1624907 · Cited by 5
Ziaka, M. (2025) · Pathogens · doi:10.3390/pathogens14121206 · Cited by 5
Li, Y., Yang, L., Xu, H., Bian, X., Shi, D., Wu, W., & Li, L. (2026) · npj Biofilms and Microbiomes · doi:10.1038/s41522-026-00913-z · Cited by 5
Green, E. R., Negretti, N. M., Brunner, T. H., Shealy, N. G., Moser, F. A., Drury, S. L., Traina, K. A., Ruiz, V. M. R., Yang, T. S., Lehmann, C. J., et al. (2026) · Proceedings of the National Academy of Sciences · doi:10.1073/pnas.2534432123 · Cited by 5
The nasal microbiota is a potential diagnostic biomarker for sepsis in critical care units
Tan, X., Liu, H., Qiu, W., Li, Z., Ge, S., Luo, Y., Zeng, N., Chen, M., Zhou, Q., Cai, S., et al. (2024) · Microbiology Spectrum · doi:10.1128/spectrum.03441-23 · Cited by 6
Petrilla, A., Nemeth, P., Fauszt, P., Racz, A., Mikolás, M., Szilágyi-Tolnai, E., Dávid, P., Stágel, A., Gal, F., Gál, K., et al. (2024) · Scientific Reports · doi:10.1038/s41598-024-78102-1 · Cited by 5
Wang, K., Zhang, X., Xie, T., Cao, K., Zhou, S., Cheng, W., Wang, Z., Wang, T., Guan, W., & Ding, C. (2025) · Shock · doi:10.1097/shk.0000000000002621 · Cited by 5
Wang, G., Ma, F., Zhang, W., Xin, Y., Ping, K., Wang, Y., & Dong, J. (2023) · Inflammopharmacology · doi:10.1007/s10787-023-01378-8 · Cited by 5
Lu, H., Li, L., Zou, Z., Han, B., & Gong, M. (2024) · Metabolites · doi:10.3390/metabo14060304 · Cited by 5
Bozan, G., Pérez‐Brocal, V., Aslan, K., Kıral, E., Şevketoğlu, E., Yazıcı, M. U., Azapağası, E., Kendirli, T., Emeksız, S., Dursun, O., et al. (2023) · Diagnostics · doi:10.3390/diagnostics13121984 · Cited by 5
Analysis of fecal microbiota and related clinical indicators in ICU patients with sepsis
Chen, H., Liu, H. H., Sun, Y., Su, M., Lin, J., Wang, J., Lin, J., & Zhao, X. (2024) · Heliyon · doi:10.1016/j.heliyon.2024.e28480 · Cited by 4
Metadata
- Authors
- Agudelo-Ochoa, G. M., Valdés-Duque, B. E., Giraldo-Giraldo, N. A., Jaillier-Ramírez, A. M., Giraldo-Villa, A., Acevedo-Castaño, I., Yepes-Molina, M. A., Barbosa-Barbosa, J., & Benítez-Paéz, A.
- Affiliations
- Food and Human Nutrition Research Group, Universidad de Antioquia (UdeA), Medellín, Colombia
- Institución Universitaria Colegio Mayor de Antioquia (CO)
- Hospital Universitario de San Vicente Fundación (CO)
- Department of Nutrition, Hospital Pablo Tobón Uribe, Medellín, Colombia
- Department of Nutrition, Hospital General, Medellín, Colombia
- Department of Nutrition, Clínica Las Américas, Medellín, Colombia
- Microbial Ecology, Nutrition and Health Research Unit, Institute of Agrochemistry and Food Technology. Spanish National Research Council (IATA-CSIC), Paterna-Valencia, Spain
- ORCID
- Venue
- Gut Microbes
- Publisher
- Informa UK Limited
- Published
- 2020-01-10
- Volume
- 12
- Issue
- 1
- Pages
- 1707610
- ISSN
- 1949-0976 (ISSN-L)
- 1949-0984
- PMC
- PMC7524144
- OpenAlex
- W3000570416
- Cited by
- 166
- References
- 57
- Citations by year
- 2026: 20 · 2025: 27 · 2024: 26 · 2023: 41 · 2022: 29 · 2021: 20 · 2020: 3
- FWCI
- 7.53
- Type
- journal article
- Language
- en
- Open access
- gold
- doi.org
- Licence
- Locations
- Gut Microbes (publishedVersion, cc-by-nc-nd)
- PubMed Central (publishedVersion, cc-by-nc-nd)
- PubMed (publishedVersion)
- Institutional Repository University of Antioquia (University of Antioquia) (publishedVersion, cc-by-nc-nd)
- DIGITAL.CSIC (Spanish National Research Council (CSIC)) (submittedVersion, cc-by-nc-nd)
- DOAJ (DOAJ: Directory of Open Access Journals) (submittedVersion, cc-by-sa)
- Funders
- Universidad de Antioquia (N/A)
- Instituto de Nutrición y Salud Kellogg´s (N/A)
- Institución Universitaria Colegio Mayor de Antioquia (N/A)
- Topics
- Life Sciences › Biochemistry, Genetics and Molecular Biology › Molecular Biology › Gut microbiota and health
- Health Sciences › Medicine › Critical Care and Intensive Care Medicine › Sepsis Diagnosis and Treatment
- Health Sciences › Medicine › Infectious Diseases › Clostridium difficile and Clostridium perfringens research
- Keywords
- gut microbiota, sepsis, critically ill patients, intensive care unit, sepsis biomarkers, microbial diversity, Enterococcus, Parabacteroides, Fusobacterium, Bilophila, sex differences, aging, mortality, inflammation, risk factors
- MeSH terms
- Gastrointestinal Microbiome, Adult, Bacteria, Critical Care, Female, Humans, Inflammation, Intestines, Male, Middle Aged, RNA, Ribosomal, 16S, Biomarkers, Case-Control Studies, Critical Illness, Sepsis, APACHE, Young Adult
About these checks
Registry, retraction, Cites and statistics results are computed, not judged, with one exception: a printed reference that no index lists is read once by a model before it counts as a citation error. Claims are extracted by a model and kept only when their quote appears verbatim in the text; each cited source is then checked, with a model’s help, for whether it says what the claim relies on. Those verdicts can be wrong — read the claim’s quote and the cited source before relying on one.
Statistics and arithmetic are recomputed, not judged.
Confidence bands are shown only for fields calibrated on our annotated test set. None is calibrated yet, so no band is shown.
What counts as a claim ›How we measure confidence ›How we check this ›
Are you an author, or do you see a problem with this page? Request a review
