

The DOI matches its Crossref record; 5 of the 5 references it cites were found in a registry or an index.
The metagenome and metabolome signatures of dental biofilms associated with severe dental fluorosis
Overview
The claims and statistics of this paper haven’t been checked yet.
Run the check — free, no account needed. It reads the open-access text and checks the sources it cites.
Integrity signals
Registry
Cites
Statistics
Figures
Verification
Claims the paper makes
The claims and statistics of this paper haven’t been checked yet.
Run the check — free, no account needed. It reads the open-access text and checks the sources it cites.
Claims other papers make about this one
Each is checked against this paper’s own text: does it say what the citing paper says it does?
In the citing paper
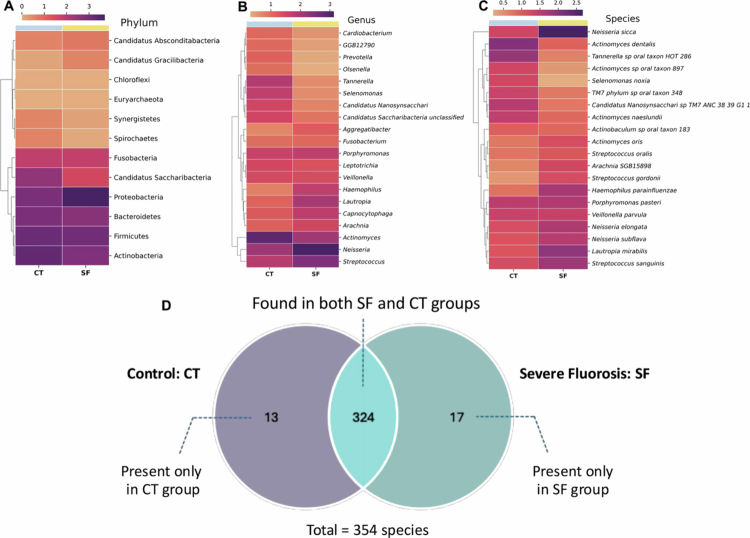
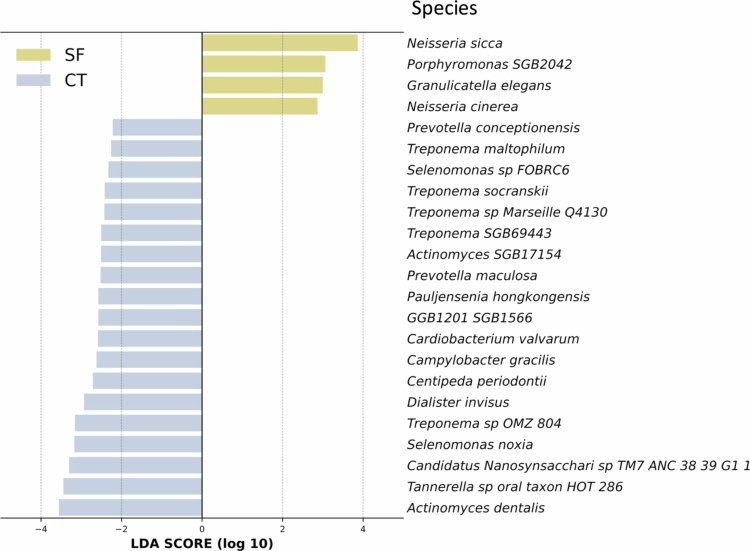
“However, a recent metagenomic study reported an enrichment of Neisseria sicca in severe dental fluorosis [53], which contrasts with our observed depletion of Neisseria sicca at the species level.”
From Severity-dependent alterations in oral microbiota and antibiotic resistance in children with dental fluorosis (2026) · cites this paper as [53]
Self-check
Percentages, sums and reported differences re-computed from the paper’s own numbers.
The self-check needs the paper’s full text.
Citations
Cites
Beghini, F., McIver, L. J., Blanco-Míguez, A., Dubois, L., Asnicar, F., Maharjan, S., Mailyan, A., Manghi, P., Scholz, M., Thomas, A. M., et al. (2021) · eLife · doi:10.7554/elife.65088 · Cited by 2,303
Blanco-Míguez, A., Beghini, F., Cumbo, F., McIver, L. J., Thompson, K. N., Zolfo, M., Manghi, P., Dubois, L., Huang, K. D., Thomas, A. M., et al. (2023) · Nature Biotechnology · doi:10.1038/s41587-023-01688-w · Cited by 1,442
The oral microbiome – an update for oral healthcare professionals
Kilian, M., Chapple, I. L. C., Hannig, M., Marsh, P. D., Meuric, V., Pedersen, A. M. L., Tonetti, M. S., Wade, W. G., & Zaura, E. (2016) · British Dental Journal · doi:10.1038/sj.bdj.2016.865 · Cited by 1,269 · cited 1×
“Disruptions to this equilibrium, known as dysbiosis [11–13], have been linked to oral diseases, including dental caries, periodontal disease and halitosis [10].”
A practical guide to the oral microbiome and its relation to health and disease
Krishnan, K., Chen, T., & Paster, B. (2017) · Oral Diseases · doi:10.1111/odi.12509 · Cited by 347 · cited 2×
“Disruptions to this equilibrium, known as dysbiosis [11–13], have been linked to oral diseases, including dental caries, periodontal disease and halitosis [10].”
Oral microbiome: possible harbinger for children’s health
Xiao, J., Fiscella, K. A., & Gill, S. R. (2020) · International Journal of Oral Science · doi:10.1038/s41368-020-0082-x · Cited by 223
Research works printed but not linked: 45
- 10.1016/j.identj.2025.04.013 · DOI
- 10.1038/s41598-024-69409-0 · DOI
- 10.1007/s13201-016-0441-0 · DOI
- 10.1007/s12011-020-02296-4 · DOI
- World Health Organization. Preventing disease through healthy environments: inadequate or excess fluoride: a major public health concern. Geneva: World Health Organization; 2019.
- 10.1186/1472-6831-12-16 · DOI
- 10.1016/j.scitotenv.2015.12.069 · DOI
- 10.1016/j.heliyon.2019.e02391 · DOI
- 10.5005/jp-journals-10024-1808 · DOI
- 10.1111/j.1600-0757.2010.00350.x · DOI
- Petersen, PE, Baez, RJ, World Health Organization. Oral health surveys: basic methods. 5th ed. Geneva: World Health Organization; 2013.
- 10.1016/j.celrep.2020.107939 · DOI
- 10.1007/978-1-0716-1099-2_2 · DOI
- 10.1111/odi.15349 · DOI
- 10.3390/diagnostics11071283 · DOI
- 10.3389/fmicb.2022.895537 · DOI
- 10.1128/JB.00542-10 · DOI · Paper page
- 10.1038/s41598-021-82709-z · DOI · Paper page
- 10.1038/s41598-019-41882-y · DOI
- 10.1038/nmicrobiol.2016.70 · DOI
- 10.1080/21655979.2022.2078556 · DOI
- 10.1002/1097-0215(20001101)88:3<342::AID-IJC4>3.0.CO;2-I · DOI
- 10.1038/s41598-019-46790-9 · DOI
- 10.1271/bbb.63.1708 · DOI
- 10.7759/cureus.14217 · DOI
- Achmad H, Oktawati S, Mardiana Adam A, et al. Granulicatella adiacens bacteria isolation from perodontitical patients with polymerase chain reaction techniques. A multifaceted review journal in the field of pharmacy. Sys Rev Pharm. 2020;11(4):396–400.
- 10.1016/j.anaerobe.2020.102280 · DOI
- 10.1007/s00203-018-1505-3 · DOI
- 10.1073/pnas.1419038112 · DOI
- 10.1177/0022034516651078 · DOI
- 10.1371/journal.pone.0089398 · DOI
- 10.1128/JCM.02411-07 · DOI
- 10.1186/s12903-021-01683-0 · DOI
- 10.3389/fpls.2023.1077347 · DOI
- 10.1016/S0892-0362(97)00136-0 · DOI
- 10.1016/j.chemphyslip.2025.105471 · DOI
- 10.1016/j.carres.2003.07.009 · DOI
- 10.1016/j.chembiol.2010.05.001 · DOI
- 10.1152/physrev.00040.2023 · DOI
- 10.1128/mBio.01319-19 · DOI
- 10.1021/ja710207s · DOI
- 10.3389/fmicb.2022.823623 · DOI
- 10.1002/chem.202202991 · DOI
- 10.1128/jb.00369-23 · DOI
- 10.1002/14651858.CD007693.pub3 · DOI
Cited by
Sorted by citations
Xia, Y., Peng, S., Yu, J., Wang, Y., Ye, Y., Liu, M., Shang, L., Cui, X., Wang, P., & Ding, Z. (2026) · Journal of Oral Microbiology · doi:10.1080/20002297.2026.2714622
Metadata
- Authors
- Ajrithirong, P., Krasaesin, A., Sriarj, W., Gavila, P., Chetruengchai, W., Sriwattanapong, K., Manaspon, C., Samaranayake, L., & Porntaveetus, T.
- Affiliations
- Department of Pediatric Dentistry, Faculty of Dentistry, Chulalongkorn University
- Department of Physiology, Faculty of Dentistry, Center of Excellence in Precision Medicine and Digital Health, Chulalongkorn University Implant and Esthetic Center, Chulalongkorn University
- Center of Excellence for Medical Genomics, Department of Pediatrics, Faculty of Medicine, Chulalongkorn University
- Venue
- Journal of Oral Microbiology
- Publisher
- Informa UK Limited
- Published
- 2025-09-23
- Volume
- 17
- Issue
- 1
- ISSN
- 2000-2297
- PMC
- PMC12459186
- Cited by
- 12
- References
- 5
- Language
- en
- Funders
- Faculty of Dentistry, Chulalongkorn University (DRF68_007)
- Health Systems Research Institute (68-032, 68-056)
- The Second Century Fund (C2F)
- Thailand Science Research and Innovation (HEA_FF_68_008_3200_001)
About these checks
Registry, retraction, Cites and statistics results are computed, not judged, with one exception: a printed reference that no index lists is read once by a model before it counts as a citation error. Claims are extracted by a model and kept only when their quote appears verbatim in the text; each cited source is then checked, with a model’s help, for whether it says what the claim relies on. Those verdicts can be wrong — read the claim’s quote and the cited source before relying on one.
Statistics and arithmetic are recomputed, not judged.
Confidence bands are shown only for fields calibrated on our annotated test set. None is calibrated yet, so no band is shown.
What counts as a claim ›How we measure confidence ›How we check this ›
Are you an author, or do you see a problem with this page? Request a review
