

The DOI matches its Crossref record; 44 of the 44 references it cites were found in a registry or an index.
Impact of (chemo)radiotherapy on immune cell composition and function in cervical cancer patients
Open accessAbstract
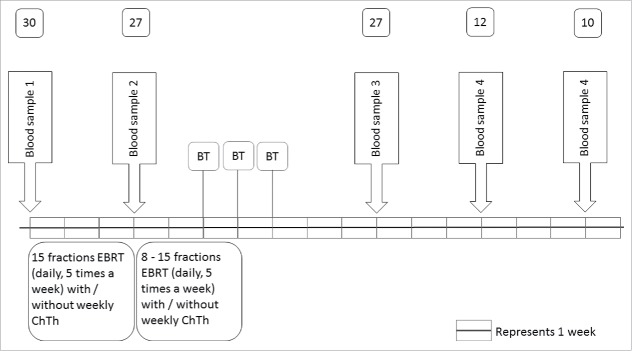
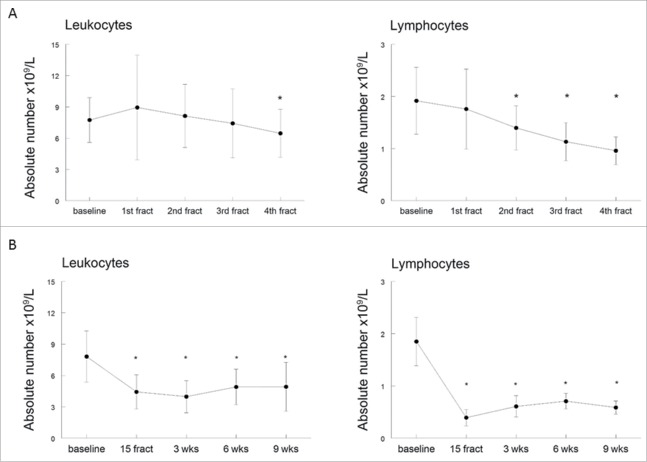
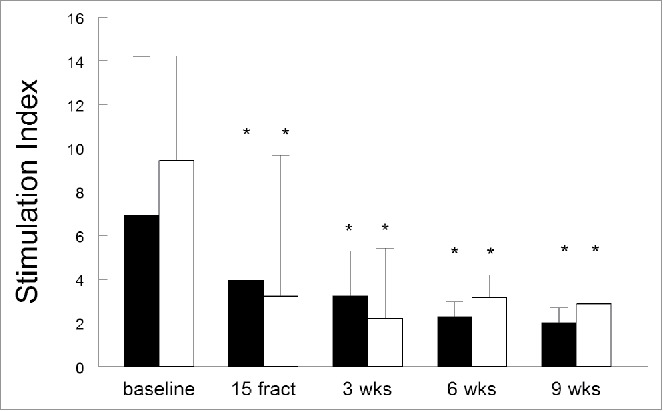
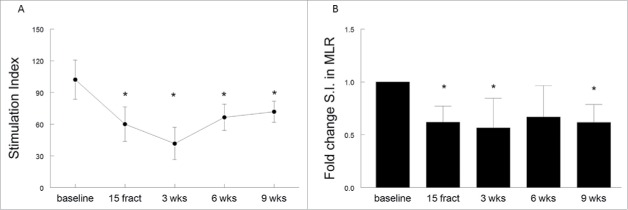
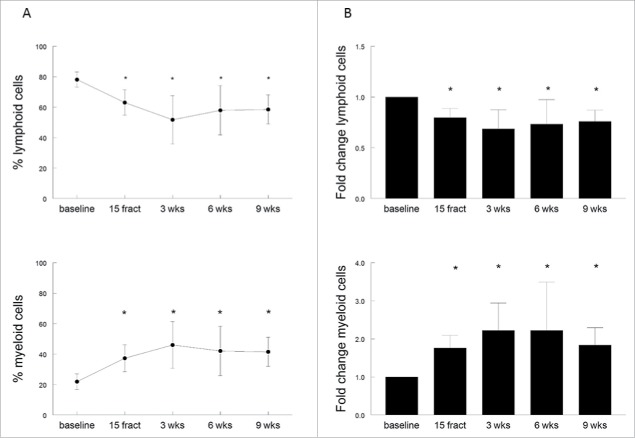
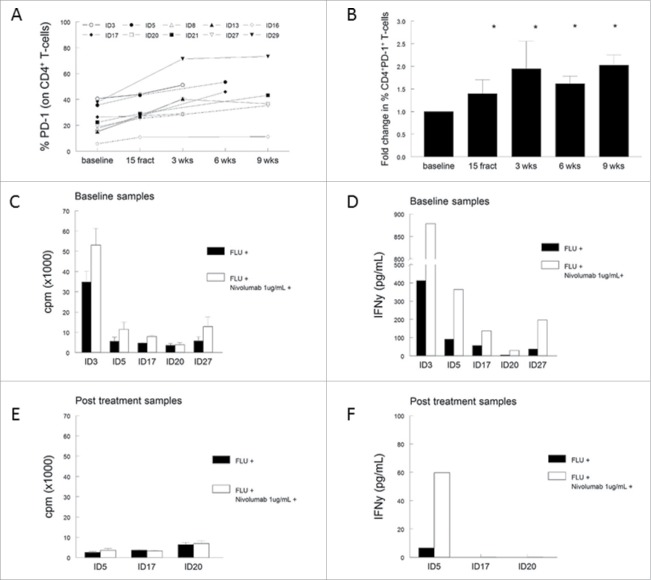
New treatments based on combinations of standard therapeutic modalities and immunotherapy are of potential use, but require a profound understanding of immune modulatory properties of standard therapies. Here, the impact of standard (chemo)radiotherapy on the immune system of cervical cancer patients was evaluated. Thirty patients with cervical cancer were treated with external beam radiation therapy (EBRT), using conventional three-dimensional or intensity modulated radiation therapy without constraints for bone marrow sparing. Serial blood sampling for immunomonitoring was performed before, midway and at 3, 6 and 9 weeks after EBRT to analyze the composition of lymphocyte and myeloid-cell populations, the expression of co-stimulatory molecules, T-cell reactivity and antigen presenting cell (APC) function. Therapy significantly decreased the absolute numbers of circulating leukocytes and lymphocytes. Furthermore, the capacity of the remaining T cells to respond to antigenic or mitogenic stimulation was impaired. During treatment the frequency of both CD4+ and CD8+ T cells dropped and CD4+ T cells displayed an increased expression of programmed cell death-1 (PD-1). In vitro blocking of PD-1 successfully increased T-cell reactivity in all five samples isolated before radiotherapy but was less successful in restoring reactivity in samples isolated at later time points. Moreover, (chemo)radiotherapy was associated with an increase in both circulating monocytes and myeloid-derived suppressor cells (MDSCs) and an impaired capacity of APCs to stimulate allogeneic T cells. T-cell reactivity was slowly restored at 6–9 weeks after cessation of therapy. We conclude that conventional (chemo)radiotherapy profoundly suppresses the immune system in cervical cancer patients, and may restrict its combination with immunotherapy.
Overview
The claims and statistics of this paper haven’t been checked yet.
Run the check — free, no account needed. It reads the open-access text and checks the sources it cites.
Integrity signals
Registry
Cites
Statistics
Figures
Verification
Claims the paper makes
The claims and statistics of this paper haven’t been checked yet.
Run the check — free, no account needed. It reads the open-access text and checks the sources it cites.
Claims other papers make about this one
Each is checked against this paper’s own text: does it say what the citing paper says it does?
In the citing paper
“Recent studies have already reported that chemoradiotherapy for CC induces unfavorable immune changes reflected by a decreased number of circulating lymphocytes, both CD4+ and CD8+ T cells, and an increased percentage in myeloid-cell populations, including myeloid-derived suppressor cells and monocytes23.”
From Gut microbiome diversity is an independent predictor of survival in cervical cancer patients receiving chemoradiation (2021) · cites this paper as [23]
In the citing paper
“Previous studies have reported that the number and functional orientation of tumor-infiltrating CD4+ and CD8+ T cells and the presence of M1 type macrophages strongly correlates with survival in patients with CC after CRT23,24.”
From Gut microbiome diversity is an independent predictor of survival in cervical cancer patients receiving chemoradiation (2021) · cites this paper as [23]
Self-check
Percentages, sums and reported differences re-computed from the paper’s own numbers.
The self-check needs the paper’s full text.
Citations
Cites
Normalization of Tumor Vasculature: An Emerging Concept in Antiangiogenic Therapy
Jain, R. K. (2005) · Science · doi:10.1126/science.1104819 · Cited by 5,527
Natural History of Cervicovaginal Papillomavirus Infection in Young Women
Ho, G. Y. F., Bierman, R., Beardsley, L., Chang, C. J., & Burk, R. D. (1998) · New England Journal of Medicine · doi:10.1056/nejm199802123380703 · Cited by 2,329
The Tumour Microenvironment after Radiotherapy: Mechanisms of Resistance and Recurrence
Barker, H. E., Paget, J. T. E., Khan, A. A., & Harrington, K. J. (2015) · Nature Reviews Cancer · doi:10.1038/nrc3958 · Cited by 2,144 · cited 1×
“to treatment success or failure, particularly in so-called immunogenic tumors.(8) Interestingly, it was shown that a pretreatment peripheral blood lymphocyte count at or above the median value was associated with higher clinical responses and survival rates.”
BackgroundNATURAL HISTORY OF CERVICOVAGINAL PAPILLOMAVIRUS INFECTION IN YOUNG WOMEN
Loria, G. R., Ierman, R. O. B., Eardsley, L. E. B., & Hang, H. J. C. (1998) · Cited by 1,890
Lee, Y., Auh, S. L., Wang, Y., Burnette, B., Wang, Y., Meng, Y., Beckett, M., Sharma, R., Chin, R., Tu, T., et al. (2009) · Blood · doi:10.1182/blood-2009-02-206870 · Cited by 1,324
Klug, F., Prakash, H., Huber, P. E., Seibel, T., Bender, N., Halama, N., Pfirschke, C., Voss, R. H., Timke, C., Umansky, L., et al. (2013) · Cancer Cell · doi:10.1016/j.ccr.2013.09.014 · Cited by 1,135
Combining Radiotherapy and Cancer Immunotherapy: A Paradigm Shift
Formenti, S. C., & Demaria, S. (2013) · JNCI Journal of the National Cancer Institute · doi:10.1093/jnci/djs629 · Cited by 1,088
Sturdza, A. E., Pötter, R., Fokdal, L. U., Haie-Méder, C., Tan, L. T., Mazeron, R., Petrič, P., Šegedin, B., Jurgenliemk-Schulz, I. M., Nomden, C., et al. (2016) · Radiotherapy and Oncology · doi:10.1016/j.radonc.2016.03.011 · Cited by 718
QUINN, M., BENEDET, J., Odicino, F. E., Maisonneuve, P., Beller, U., CREASMAN, W., Heintz, A. P. M., Ngan, H., & Pecorelli, S. L. (2006) · International Journal of Gynecology & Obstetrics · doi:10.1016/s0020-7292(06)60030-1 · Cited by 572
Hematopoietic stem cell compartment: acute and late effects of radiation therapy and chemotherapy.
Mauch, P., Constine, L., Greenberger, J., Knospe, W., Sullivan, J., Liesveld, J. L., & Deeg, H. J. (1995) · International Journal of Radiation Oncology*Biology*Physics · doi:10.1016/0360-3016(94)00430-s · Cited by 507
Research works printed but not linked: 2
- Ganss R, 2002, Cancer Res, 62, 1462
- 10.1002/1097-0142(19951115)76 · DOI
Cited by
Sorted by citations
Hiam-Galvez, K. J., Allen, B. M., & Spitzer, M. H. (2021) · Nature Reviews Cancer · doi:10.1038/s41568-021-00347-z · Cited by 1,400
Cervical Cancer Immunotherapy: Facts and Hopes
Ferrall, L., Lin, K. Y., Roden, R. B. S., Hung, C., & Wu, T. ‐. (2021) · Clinical Cancer Research · doi:10.1158/1078-0432.ccr-20-2833 · Cited by 414
Challenges in developing personalized neoantigen cancer vaccines
Katsikis, P. D., Ishii, K. J., & Schliehe, C. (2023) · Nature reviews. Immunology · doi:10.1038/s41577-023-00937-y · Cited by 285
YTHDF2 inhibition potentiates radiotherapy antitumor efficacy
Wang, L., Dou, X., Chen, S., Yu, X., Huang, X., Zhang, L., Chen, Y., Wang, J., Yang, K., Bugno, J., et al. (2023) · Cancer Cell · doi:10.1016/j.ccell.2023.04.019 · Cited by 255
Ellsworth, S. G. (2018) · Advances in Radiation Oncology · doi:10.1016/j.adro.2018.08.014 · Cited by 195
Metadata
- Authors
- van Meir, H., Nout, R. A., Welters, M. J. P., Loof, N. M., de Kam, M. L., van Ham, J. J., Samuels, S., Kenter, G. G., Cohen, A. F., Melief, C. J. M., Burggraaf, J., van Poelgeest, M. I. E., & van der Burg, S. H.
- Affiliations
- Department of Gynecology, Leiden University Medical Center, Leiden, the Netherlands
- Leiden University Medical Center (NL)
- Centre for Human Drug Research, Leiden, the Netherlands
- Department of Medical Oncology, Leiden University Medical Center, Leiden, the Netherlands
- The Netherlands Cancer Institute (NL)
- Centre for Human Drug Research (NL)
- ISA Pharmaceuticals (Netherlands) (NL)
- Venue
- OncoImmunology
- Publisher
- Informa UK Limited
- Published
- 2017-02
- Volume
- 6
- Issue
- 2
- Pages
- e1267095
- ISSN
- 2162-4011 (ISSN-L)
- 2162-402X
- PMC
- PMC5353924
- OpenAlex
- W2567712538
- Cited by
- 143
- References
- 44
- Citations by year
- 2026: 12 · 2025: 12 · 2024: 12 · 2023: 21 · 2022: 14 · 2021: 28 · 2020: 15 · 2019: 14 · 2018: 10 · 2017: 5
- FWCI
- 5.21
- Type
- journal article
- Language
- en
- Open access
- gold
- doi.org
- Licence
- Locations
- OncoImmunology (publishedVersion, cc-by)
- Europe PMC (PubMed Central) (publishedVersion, cc-by)
- PubMed Central (publishedVersion, cc-by)
- PubMed (publishedVersion)
- Amsterdam UMC (VU Amsterdam) - Institutional Repository (publishedVersion)
- Leiden Repository (Leiden University) (submittedVersion)
- Pure Amsterdam UMC (submittedVersion, other-oa)
- Data Archiving and Networked Services (DANS) (submittedVersion, other-oa)
- DOAJ (DOAJ: Directory of Open Access Journals) (submittedVersion, cc-by-sa)
- Data Archiving and Networked Services (DANS) (submittedVersion)
- Funders
- Leids Universitair Medisch Centrum
- Topics
- Health Sciences › Medicine › Oncology › Cancer Immunotherapy and Biomarkers
- Life Sciences › Immunology and Microbiology › Immunology › Immunotherapy and Immune Responses
- Health Sciences › Medicine › Obstetrics and Gynecology › Endometrial and Cervical Cancer Treatments
- Keywords
- cervical cancer, chemoradiotherapy, external beam radiotherapy, immunosuppression, T cell response, PD-1, myeloid-derived suppressor cells, antigen-presenting cells, CD4+ T cells, CD8+ T cells, monocytes, combination immunotherapy, immune monitoring
About these checks
Registry, retraction, Cites and statistics results are computed, not judged, with one exception: a printed reference that no index lists is read once by a model before it counts as a citation error. Claims are extracted by a model and kept only when their quote appears verbatim in the text; each cited source is then checked, with a model’s help, for whether it says what the claim relies on. Those verdicts can be wrong — read the claim’s quote and the cited source before relying on one.
Statistics and arithmetic are recomputed, not judged.
Confidence bands are shown only for fields calibrated on our annotated test set. None is calibrated yet, so no band is shown.
What counts as a claim ›How we measure confidence ›How we check this ›
Are you an author, or do you see a problem with this page? Request a review
