

The DOI matches its Crossref record; 97 of the 98 references it cites were found in a registry or an index.
Reversion of the Malignant Phenotype of Human Breast Cells in Three-Dimensional Culture and In Vivo by Integrin Blocking Antibodies
Open accessAbstract
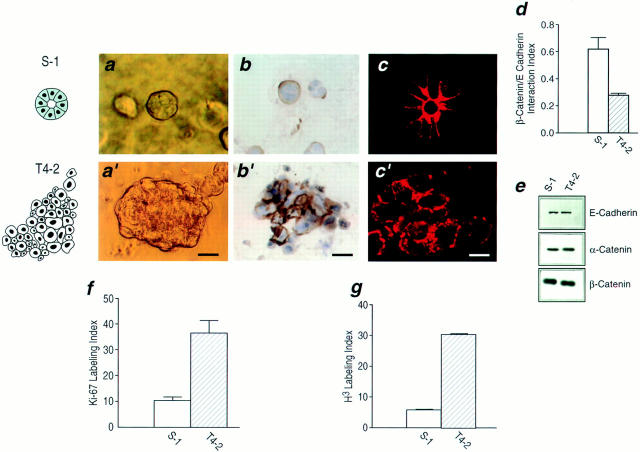
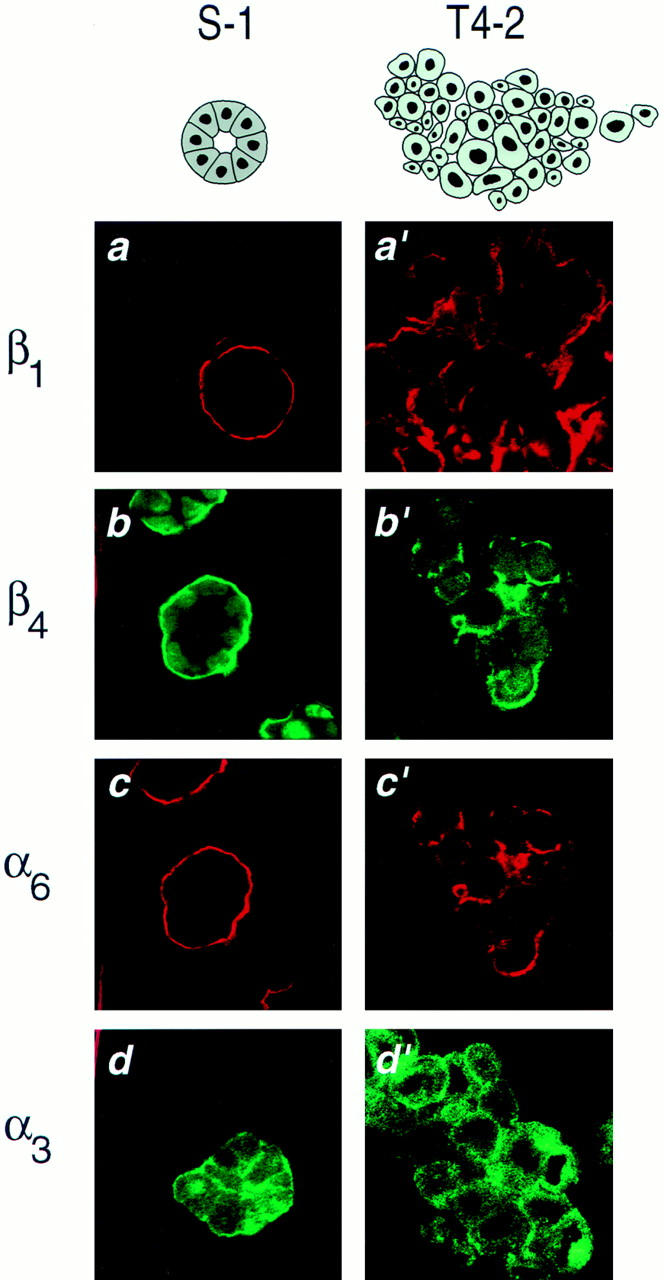
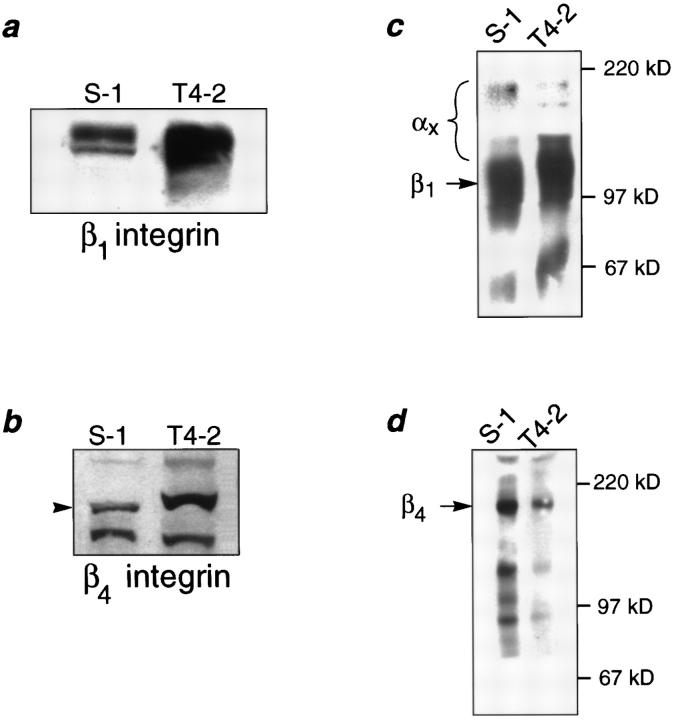
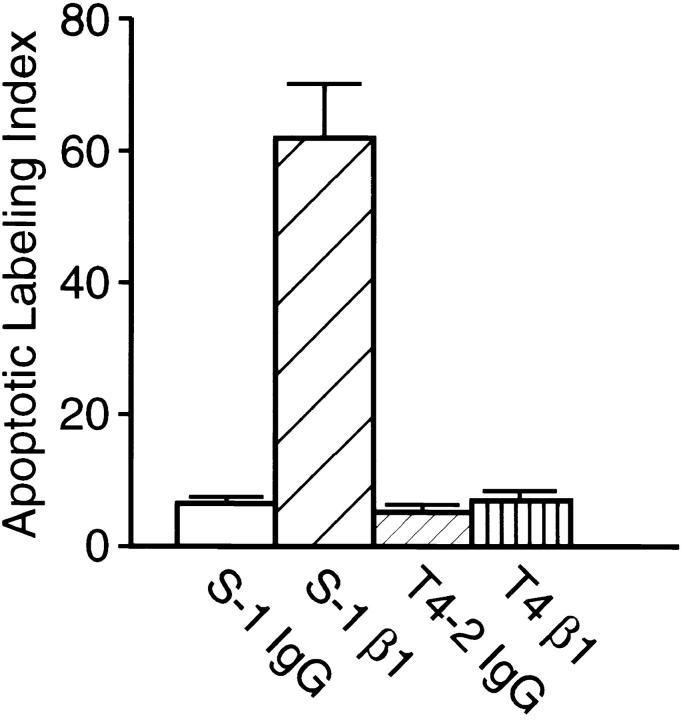
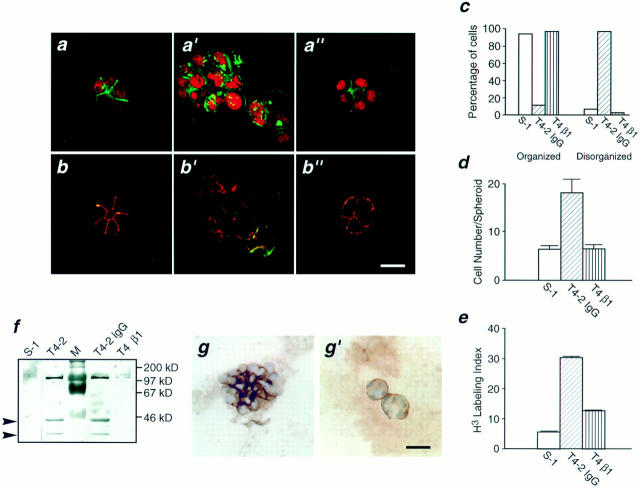
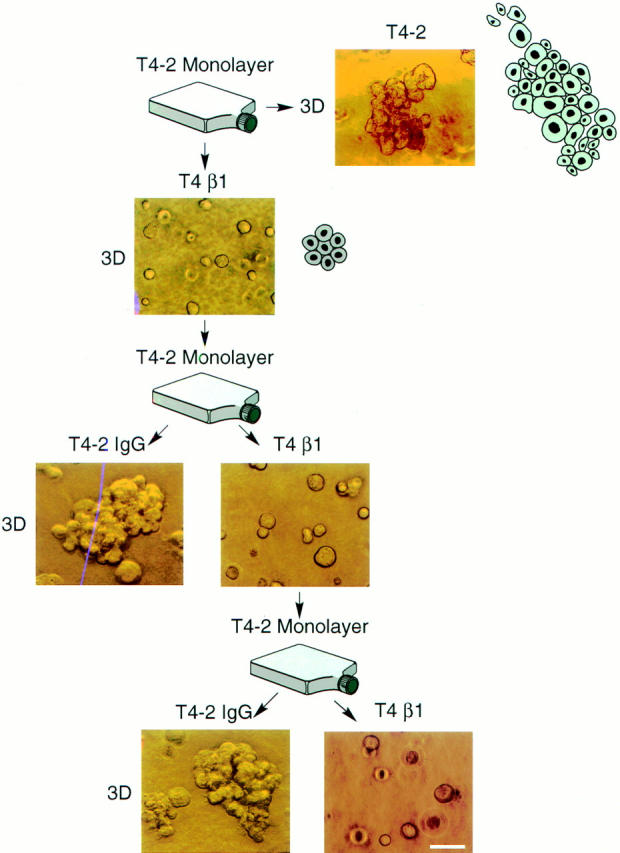
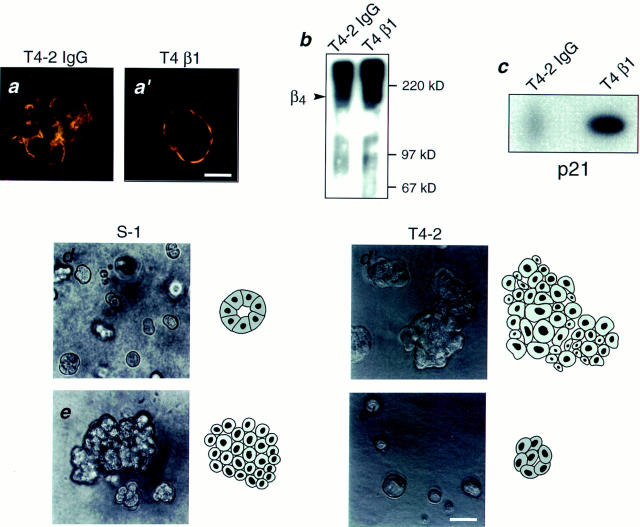
In a recently developed human breast cancer model, treatment of tumor cells in a 3-dimensional culture with inhibitory β1-integrin antibody or its Fab fragments led to a striking morphological and functional reversion to a normal phenotype. A stimulatory β1-integrin antibody proved to be ineffective. The newly formed reverted acini re-assembled a basement membrane and re-established E-cadherin–catenin complexes, and re-organized their cytoskeletons. At the same time they downregulated cyclin D1, upregulated p21cip,waf-1, and stopped growing. Tumor cells treated with the same antibody and injected into nude mice had significantly reduced number and size of tumors in nude mice. The tissue distribution of other integrins was also normalized, suggesting the existence of intimate interactions between the different integrin pathways as well as adherens junctions. On the other hand, nonmalignant cells when treated with either α6 or β4 function altering antibodies continued to grow, and had disorganized colony morphologies resembling the untreated tumor colonies. This shows a significant role of the α6/β4 heterodimer in directing polarity and tissue structure. The observed phenotypes were reversible when the cells were disassociated and the antibodies removed. Our results illustrate that the extracellular matrix and its receptors dictate the phenotype of mammary epithelial cells, and thus in this model system the tissue phenotype is dominant over the cellular genotype.
Overview
The claims and statistics of this paper haven’t been checked yet.
Run the check — free, no account needed. It reads the open-access text and checks the sources it cites.
Integrity signals
Registry
Cites
Statistics
Figures
Verification
Claims the paper makes
The claims and statistics of this paper haven’t been checked yet.
Run the check — free, no account needed. It reads the open-access text and checks the sources it cites.
Claims other papers make about this one
Each is checked against this paper’s own text: does it say what the citing paper says it does?
The cited source says what the claim attributes to it.
In the citing paper
“As a result, 2D cell culture tests sometimes provide misleading and nonpredictive data for in vivo responses. 1-3”
From Three-dimensional cell culture systems and their applications in drug discovery and cell-based biosensors (2014) · cites this paper as [2]
Self-check
Percentages, sums and reported differences re-computed from the paper’s own numbers.
The self-check needs the paper’s full text.
Citations
Cites
The p21 Cdk-interacting protein Cip1 is a potent inhibitor of G1 cyclin-dependent kinases.
Wade Harper, J. (1993) · Cell · doi:10.1016/0092-8674(93)90499-g · Cited by 5,651
Cell Adhesion: The Molecular Basis of Tissue Architecture and Morphogenesis
Gumbiner, B. M. (1996) · Cell · doi:10.1016/s0092-8674(00)81279-9 · Cited by 3,471
E-cadherin-mediated cell-cell adhesion prevents invasiveness of human carcinoma cells.
Frixen, U. H., Behrens, J., Sachs, M., Eberle, G., Voß, B., Warda, A., Löchner, D., & Birchmeier, W. (1991) · The Journal of Cell Biology · doi:10.1083/jcb.113.1.173 · Cited by 1,550
How does the extracellular matrix direct gene expression?
Bissell, M. J., Hall, H. G., & Parry, G. (1982) · Journal of Theoretical Biology · doi:10.1016/0022-5193(82)90388-5 · Cited by 1,522
Self-citationRegulation of development and differentiation by the extracellular matrix
Adams, J. C., & Watt, F. M. (1993) · Development · doi:10.1242/dev.117.4.1183 · Cited by 1,207
Integrin function: molecular hierarchies of cytoskeletal and signaling molecules.
Miyamoto, S., Teramoto, H., Coso, O. A., Gutkind, J. S., Burbelo, P. D., Akiyama, S. K., & Yamada, K. M. (1995) · The Journal of Cell Biology · doi:10.1083/jcb.131.3.791 · Cited by 1,204
Normal genetically mosaic mice produced from malignant teratocarcinoma cells.
Mintz, B., & Illmensee, K. (1975) · Proceedings of the National Academy of Sciences · doi:10.1073/pnas.72.9.3585 · Cited by 1,179
Suppression of ICE and Apoptosis in Mammary Epithelial Cells by Extracellular Matrix
Boudreau, N. J., Sympson, C. J., Werb, Z., & Bissell, M. J. (1995) · Science · doi:10.1126/science.7531366 · Cited by 1,174
Self-citationControl of adhesion-dependent cell survival by focal adhesion kinase.
Frisch, S. M., Vuori, K., Ruoslahti, E. I., & Chan-Hui, P.-Y. (1996) · The Journal of Cell Biology · doi:10.1083/jcb.134.3.793 · Cited by 1,122
PETERSEN, O. W., Rønnov‐Jessen, L., Howlett, A. R., & Bissell, M. J. (1992) · Proceedings of the National Academy of Sciences · doi:10.1073/pnas.89.19.9064 · Cited by 1,096
Self-citation
Research works printed but not linked: 2
- Berdichevsky, 1994, Integrin expression in relation to cell phenotype and malignant change in the human breast, Mol Cell Diff, 2, 255
- Boudreau, 1995, The embryonic environment and the extracellular matrix suppress oncogenic transformation by rous sarcoma virus in the chick embryo, Mol Cell Diff, 3, 261
Cited by
Sorted by citations
Items 401–500 of 1,000
Ochsner, M., Textor, M., Viola Vogel, B., & Smith, M. L. (2010) · PLoS ONE · doi:10.1371/journal.pone.0009445 · Cited by 94
Novaro, V., Roskelley, C. D., & Bissell, M. J. (2003) · Journal of Cell Science · doi:10.1242/jcs.00523 · Cited by 92
Self-citationPeela, N., Truong, D. D., Saini, H., Chu, H., Mashaghi, S., Ham, S. L., Singh, S. K., Tavana, H., Mosadegh, B., & Nikkhah, M. (2017) · Biomaterials · doi:10.1016/j.biomaterials.2017.04.017 · Cited by 97
Kenny, H. A., Dogan, S., Zillhardt, M., Mitra, A. K., Yamada, S. D., Krausz, T. N., & Lengyel, E. R. (2009) · Cancer treatment and research · doi:10.1007/978-0-387-98094-2_16 · Cited by 94
The unforeseen challenge: from genotype-to-phenotype in cell populations
Braun, E. (2015) · Reports on Progress in Physics · doi:10.1088/0034-4885/78/3/036602 · Cited by 94
AZU-1: A Candidate Breast Tumor Suppressor and Biomarker for Tumor Progression
Chen, H.-M., Schmeichel, K. L., Mian, S. I., Lelièvre, S. A., PETERSEN, O. W., & Bissell, M. J. (2000) · Molecular Biology of the Cell · doi:10.1091/mbc.11.4.1357 · Cited by 91
Self-citationCell spheroid creation by transcytotic intercellular gelation
Guo, J., Wang, F., Huang, Y., He, H., Tan, W., Yi, M., Egelman, E. H., & Xu, B. (2023) · Nature Nanotechnology · doi:10.1038/s41565-023-01401-7 · Cited by 90
Self-citationAhmed, K. M., Zhang, H., & Park, C. C. (2013) · Cancer Research · doi:10.1158/0008-5472.can-12-3537 · Cited by 95
A role for the integrin alphavbeta8 in the negative regulation of epithelial cell growth.
Cambier, S., Mu, D., O'Connell, D., Boylen, K., Travis, W. D., Liu, W. H., Broaddus, V. C., & Nishimura, S. L. (2000) · PubMed · Cited by 89
Use of three-dimensional collagen gels to study mechanotransduction in t47d breast epithelial cells
Wozniak, M. A., & Keely, P. J. (2005) · Biological Procedures Online · doi:10.1251/bpo112 · Cited by 89
Goddard, E. T., Linde, M. H., Srivastava, S., Klug, G., Shabaneh, T. B., Iannone, S., Grzelak, C. A., Marsh, S. A., Riggio, A. I., Shor, R. E., et al. (2024) · Cancer Cell · doi:10.1016/j.ccell.2023.12.011 · Cited by 96
Integrative radiation carcinogenesis: interactions between cell and tissue responses to DNA damage
Barcellos‐Hoff, M. H. (2004) · Seminars in Cancer Biology · doi:10.1016/j.semcancer.2004.08.010 · Cited by 88
Jo, M., Eastman, B. M., Webb, D. L., Stoletov, K. V., Klemke, R. L., & Gonias, S. L. (2010) · Cancer Research · doi:10.1158/0008-5472.can-10-1936 · Cited by 89
Friedland, J. C., Lakins, J. N., Kazanietz, M. G., Chernoff, J., Boettiger, D. E., & Weaver, V. M. (2007) · Journal of Cell Science · doi:10.1242/jcs.03484 · Cited by 89
Self-citationLesniak, D. M., Xu, Y., Deschênes, J., Lai, R. L., Thoms, J., Murray, D., Gosh, S., Mackey, J. R., Sabri, S., & Abdulkarim, B. (2009) · Cancer Research · doi:10.1158/0008-5472.can-09-1591 · Cited by 91
Imbalzano, K. M., Tatarkova, I., Imbalzano, A. N., & Nickerson, J. A. (2009) · Cancer Cell International · doi:10.1186/1475-2867-9-7 · Cited by 89
Schmeichel, K. L., Weaver, V. M., & Bissell, M. J. (1998) · Journal of Mammary Gland Biology and Neoplasia · doi:10.1023/a:1018751124382 · Cited by 89
Self-citationRegulation of the Functional Interaction between Cyclin D1 and the Estrogen Receptor
Lamb, J., Ladha, M. H., McMahon, C. M., Sutherland, R. L., & Ewen, M. E. (2000) · Molecular and Cellular Biology · doi:10.1128/mcb.20.23.8667-8675.2000 · Cited by 89
Meli, L., Jordan, E. T., Clark, D. S., Linhardt, R. J., & Dordick, J. S. (2012) · Biomaterials · doi:10.1016/j.biomaterials.2012.08.065 · Cited by 88
Extracellular matrix-mediated regulation of cancer stem cells and chemoresistance
Brown, Y., Hua, S., & Tanwar, P. S. (2019) · The International Journal of Biochemistry & Cell Biology · doi:10.1016/j.biocel.2019.02.002 · Cited by 90
Guðjónsson, Þ., Rønnov‐Jessen, L., Villadsen, R., Bissell, M. J., & PETERSEN, O. W. (2003) · Methods · doi:10.1016/s1046-2023(03)00031-8 · Cited by 88
Self-citationPratap, J., Imbalzano, K. M., Underwood, J. M., Cohet, N., Gokul, K. D., Akech, J., van Wijnen, A. J., Stein, J. L., Imbalzano, A. N., Nickerson, J. A., et al. (2009) · Cancer Research · doi:10.1158/0008-5472.can-09-1471 · Cited by 88
Holliday, D. L., Brouilette, K., Markert, A., Gordon, L., & Jones, J. L. (2009) · Breast Cancer Research · doi:10.1186/bcr2218 · Cited by 88
Studying the influence of angiogenesis in in vitro cancer model systems
Roudsari, L. C., & West, J. L. (2015) · Advanced Drug Delivery Reviews · doi:10.1016/j.addr.2015.11.004 · Cited by 89
Demystifying the Effects of a Three‐Dimensional Microenvironment in Tissue Morphogenesis
Levental, K. R., Leight, J. L., & Weaver, V. M. (2007) · Methods in cell biology · doi:10.1016/s0091-679x(07)83023-8 · Cited by 87
Self-citationMargulis, A. R., Zhang, W., Alt‐Holland, A., Crawford, H. C., Fusenig, N. E., & Garlick, J. A. (2005) · Cancer Research · doi:10.1158/0008-5472.can-04-3399 · Cited by 88
Gill, B. J., & West, J. L. (2014) · Journal of Biomechanics · doi:10.1016/j.jbiomech.2013.09.029 · Cited by 86
Antiprotease therapy in cancer: hot or not?
Lah, T. T., Alonso, M. B. D., & Noorden, C. J. F. V. (2006) · Expert Opinion on Biological Therapy · doi:10.1517/14712598.6.3.257 · Cited by 86
Tumor cell migration and invasion are regulated by expression of variant integrin glycoforms
Shaikh, F. M., Seales, E. C., Clem, W. C., Hennessy, K. M., Zhuo, Y., & Bellis, S. L. (2008) · Experimental Cell Research · doi:10.1016/j.yexcr.2008.07.021 · Cited by 86
Clark, A. M., Wheeler, S., Young, C. L., Stockdale, L., Neiman, J. A. S., Zhao, W., Stolz, D. B., Venkataramanan, R., Lauffenburger, D. A., Griffith, L. G., et al. (2016) · Lab on a Chip · doi:10.1039/c6lc01171c · Cited by 86
Walker, J. L., Fournier, A. K., & Assoian, R. K. (2005) · Cytokine & Growth Factor Reviews · doi:10.1016/j.cytogfr.2005.03.003 · Cited by 91
Bhat, R., & Bissell, M. J. (2013) · Wiley Interdisciplinary Reviews Developmental Biology · doi:10.1002/wdev.130 · Cited by 84
Self-citationAn Off-Lattice Hybrid Discrete-Continuum Model of Tumor Growth and Invasion
Jeon, J., Quaranta, V., & Cummings, P. T. (2010) · Biophysical Journal · doi:10.1016/j.bpj.2009.10.002 · Cited by 85
Inhibition of Proliferation by PERK Regulates Mammary Acinar Morphogenesis and Tumor Formation
Sequeira, S. J., Ranganathan, A. C., Adam, A. P., Iglesias, B. V., Farias, E., & Aguirre‐Ghiso, J. A. (2007) · PLoS ONE · doi:10.1371/journal.pone.0000615 · Cited by 87
Multifaceted Roles of Integrins in Breast Cancer Metastasis
White, D. E., & Muller, W. J. (2007) · Journal of Mammary Gland Biology and Neoplasia · doi:10.1007/s10911-007-9045-5 · Cited by 85
Autocrine/Paracrine Secreted Frizzled-related Protein 2 Induces Cellular Resistance to Apoptosis
Lee, J.-L., Lin, C., Chueh, L.-L., & Chang, C. (2004) · Journal of Biological Chemistry · doi:10.1074/jbc.m309008200 · Cited by 85
Jorgens, D. M., Inman, J. L., Wojcik, M., Robertson, C., Pálsdóttir, H., Tsai, W.-T., Huang, H., Bruni‐Cardoso, A., López, C. S., Bissell, M. J., et al. (2016) · Journal of Cell Science · doi:10.1242/jcs.190967 · Cited by 95
Self-citationThe role of the centrosome in the development of malignant tumors
Lingle, W. L., & Salisbury, J. L. (1999) · Current topics in developmental biology/Current Topics in Developmental Biology · doi:10.1016/s0070-2153(99)49015-5 · Cited by 85
F-actin dynamics regulates mammalian organ growth and cell fate maintenance
Pocaterra, A., Santinon, G., Romani, P., Brian, I., Dimitracopoulos, A., Ghisleni, A., Carnicer-Lombarte, A., Forcato, M., Braghetta, P., Montagner, M., et al. (2019) · Journal of Hepatology · doi:10.1016/j.jhep.2019.02.022 · Cited by 84
The laminin–keratin link shields the nucleus from mechanical deformation and signalling
Kechagia, Z., Sáez, P., Gómez‐González, M., Coutiño, B. C., Viswanadha, S., Zamarbide, M., Andreu, I., Koorman, T., Beedle, A. E. M., Elósegui-Artola, A., et al. (2023) · Nature Materials · doi:10.1038/s41563-023-01657-3 · Cited by 84
Surgery Triggers Outgrowth of Latent Distant Disease in Breast Cancer: An Inconvenient Truth?
Retsky, M. W., Demicheli, R., Hrushesky, W. J. M., Baum, M., & Gukas, I. D. (2010) · Cancers · doi:10.3390/cancers2020305 · Cited by 84
Paradoxes in carcinogenesis: New opportunities for research directions
Baker, S. G., & Kramer, B. S. (2007) · BMC Cancer · doi:10.1186/1471-2407-7-151 · Cited by 84
Singh, S. P., Schwartz, M. P., Lee, J. Y., Fairbanks, B. D., & Anseth, K. S. (2014) · Biomaterials Science · doi:10.1039/c4bm00022f · Cited by 84
The evolutionary theory of cancer: challenges and potential solutions
Laplane, L., & Maley, C. C. (2024) · Nature reviews. Cancer · doi:10.1038/s41568-024-00734-2 · Cited by 89
The “virgin birth”, polyploidy, and the origin of cancer
Erenpreisa, J. A., Salmiņa, K., Huna, A., Jackson, T., Vázquez‐Martín, A., & Cragg, M. S. (2014) · Oncoscience · doi:10.18632/oncoscience.108 · Cited by 83
Miroshnikova, Y. A., Jorgens, D. M., Spirio, L., Auer, M., Sarang-Sieminski, A. L., & Weaver, V. M. (2011) · Physical Biology · doi:10.1088/1478-3975/8/2/026013 · Cited by 82
Self-citationA mechanically-induced colon cancer cell population shows increased metastatic potential
Tang, X., Kuhlenschmidt, T. B., Li, Q., Ali, S., Lezmi, S., Chen, H., Pires-Alves, M., Laegreid, W. W., Saif, T. A., & Kuhlenschmidt, M. S. (2014) · Molecular Cancer · doi:10.1186/1476-4598-13-131 · Cited by 82
ECM-induced gap junctional communication enhances mammary epithelial cell differentiation
El-Sabban, M. E., Sfeir, A. J., Daher, M. H., Kalaany, N. Y., Bassam, R. A., & Talhouk, R. (2003) · Journal of Cell Science · doi:10.1242/jcs.00656 · Cited by 82
3D Cell Culture: An Introduction
Koledova, Z. S. (2017) · Methods in molecular biology · doi:10.1007/978-1-4939-7021-6_1 · Cited by 79
Integrin-mediated functional polarization of Caco-2 cells through E-cadherin—actin complexes
Schreider, C., Peignon, G., Thenet, S., Chambaz, J., & Pinçon‐Raymond, M. (2002) · Journal of Cell Science · doi:10.1242/jcs.115.3.543 · Cited by 81
Expanding the Morphogenetic Repertoire: Perspectives from the Drosophila Egg
Bilder, D. H., & Haigo, S. L. (2012) · Developmental Cell · doi:10.1016/j.devcel.2011.12.003 · Cited by 80
Gödde, N., Galea, R. C., Elsum, I. A., & Humbert, P. O. (2010) · Journal of Mammary Gland Biology and Neoplasia · doi:10.1007/s10911-010-9180-2 · Cited by 85
CD98hc (SLC3A2) Interaction with β1 Integrins Is Required for Transformation
Henderson, N. C., Collis, E., MacKinnon, A. C., Simpson, K. J., Haslett, C., Zent, R., Ginsberg, M. H., & Sethi, T. (2004) · Journal of Biological Chemistry · doi:10.1074/jbc.m408700200 · Cited by 80
Microscale screening systems for 3D cellular microenvironments: platforms, advances, and challenges
Montanez-Sauri, S. I., Beebe, D. J., & Sung, K. E. (2014) · Cellular and Molecular Life Sciences · doi:10.1007/s00018-014-1738-5 · Cited by 81
Organ-on-a-chip for assessing environmental toxicants
Cho, S., & Yoon, J. (2017) · Current Opinion in Biotechnology · doi:10.1016/j.copbio.2016.11.019 · Cited by 82
Spencer, V. A., Xu, R., & Bissell, M. J. (2008) · eScholarship (California Digital Library) · Cited by 79
Self-citationIntegrins in mammary-stem-cell biology and breast-cancer progression – a role in cancer stem cells?
Pontier, S. M., & Muller, W. J. (2008) · Journal of Cell Science · doi:10.1242/jcs.040394 · Cited by 82
Lelièvre, S. A. (2009) · Biochimica et Biophysica Acta (BBA) - General Subjects · doi:10.1016/j.bbagen.2009.03.013 · Cited by 78
Weaver, V. M., & Bissell, M. J. (1999) · Journal of Mammary Gland Biology and Neoplasia · doi:10.1023/a:1018781325716 · Cited by 77
Self-citationMCF-7 Cells as a Three-Dimensional Model for the Study of Human Breast Cancer
do Amaral, J. B., Teixeira, P. R., Freitas, V. M., & Machado‐Santelli, G. M. (2011) · Tissue Engineering Part C Methods · doi:10.1089/ten.tec.2011.0260 · Cited by 76
Host epithelial geometry regulates breast cancer cell invasiveness
Boghaert, E., Gleghorn, J. P., Lee, K., Gjorevski, N., Radisky, D. C., & Nelson, C. M. (2012) · Proceedings of the National Academy of Sciences · doi:10.1073/pnas.1118872109 · Cited by 81
Watt, S. A., Pourreyron, C., Purdie, K. J., Hogan, C., Cole, C. L., Foster, N. A., Pratt, N., Bourdon, J., Appleyard, V., Murray, K., et al. (2011) · Oncogene · doi:10.1038/onc.2011.180 · Cited by 75
Mayer, B., Klement, G. L., Kaneko, M., Man, S., Jothy, S., Rak, J. W., & Kerbel, R. S. (2001) · Gastroenterology · doi:10.1053/gast.2001.27989 · Cited by 78
A cultural renaissance: in vitro cell biology embraces three-dimensional context
Edelman, D. B., & Keefer, E. W. (2005) · Experimental Neurology · doi:10.1016/j.expneurol.2004.10.005 · Cited by 76
Lai, Y., Cheng, K., & Kisaalita, W. S. (2012) · PLoS ONE · doi:10.1371/journal.pone.0045074 · Cited by 77
Freitas, V. M., Rangel, M., Bisson, L. F., Jaeger, R. G., & Machado‐Santelli, G. M. (2008) · Journal of Cellular Physiology · doi:10.1002/jcp.21432 · Cited by 75
Polo-like Kinase 1 Is Involved in Invasion through Extracellular Matrix
Rizki, A., Mott, J. D., & Bissell, M. J. (2007) · Cancer Research · doi:10.1158/0008-5472.can-07-2348 · Cited by 75
Self-citationFournier, M. V., Fata, J. E., Martin, K. J., Yaswen, P., & Bissell, M. J. (2009) · Cancer Research · doi:10.1158/0008-5472.can-08-1694 · Cited by 75
Self-citationMorgan, M. M., Johnson, B. P., Livingston, M. K., Schuler, L. A., Alarid, E. T., Sung, K. E., & Beebe, D. J. (2016) · Pharmacology & Therapeutics · doi:10.1016/j.pharmthera.2016.05.007 · Cited by 75
From 2D to 3D and beyond: the evolution and impact of in vitro tumor models in cancer research
Rauner, G., Gupta, P. B., & Kuperwasser, C. (2025) · Nature Methods · doi:10.1038/s41592-025-02769-1 · Cited by 82
ECM stiffness regulates glial migration in Drosophila and mammalian glioma models
Kim, S. N., Jeibmann, A., Halama, K., Witte, H. T., Wälte, M., Matzat, T., Schillers, H., Faber, C., Senner, V., Paulus, W., et al. (2014) · Development · doi:10.1242/dev.106039 · Cited by 74
Laminin-111 and the Level of Nuclear Actin Regulate Epithelial Quiescence via Exportin-6
Fiore, A. P. Z. P., Spencer, V. A., Mori, H., Carvalho, H. F., Bissell, M. J., & Bruni‐Cardoso, A. (2017) · Cell Reports · doi:10.1016/j.celrep.2017.05.050 · Cited by 73
Self-citationMiroshnikova, Y. A., Rozenberg, G. I., Cassereau, L., Pickup, M. W., Mouw, J. K., Ou, G., Templeman, K. L., Hannachi, E.-I., Gooch, K. J., Sieminski, A. L., et al. (2017) · Molecular Biology of the Cell · doi:10.1091/mbc.e17-02-0126 · Cited by 74
Self-citationGuo, N.-H., Templeton, N. S., Al-Barazi, H., Cashel, J., Sipes, J. M., Krutzsch, H. C., & Roberts, D. D. (2000) · PubMed · Cited by 74
Tevis, K. M., Cecchi, R. J., Colson, Y. L., & Grinstaff, M. W. (2016) · Acta Biomaterialia · doi:10.1016/j.actbio.2016.12.037 · Cited by 74
The ultrastructure of MCF‐10A acini
Underwood, J. M., Imbalzano, K. M., Weaver, V. M., Fischer, A. H., Imbalzano, A. N., & Nickerson, J. A. (2006) · Journal of Cellular Physiology · doi:10.1002/jcp.20639 · Cited by 73
Self-citationMechanical homeostasis in tissue equivalents: a review
Eichinger, J. F., Haeusel, L. J., Paukner, D., Aydin, R. C., Humphrey, J. D., & Cyron, C. J. (2021) · Biomechanics and Modeling in Mechanobiology · doi:10.1007/s10237-021-01433-9 · Cited by 74
ROCK Controls Matrix Synthesis in Vascular Smooth Muscle Cells
Chapados, R., Abe, K., Ihida‐Stansbury, K., McKean, D. M., Gates, A. T., Kern, M. J., Merklinger, S. L., Elliott, J. T., Plant, A. L., Shimokawa, H., et al. (2006) · Circulation Research · doi:10.1161/01.res.0000246172.77441.f1 · Cited by 72
Towards manufacturing of human organoids
Ashok, A., Choudhury, D., Fang, Y., & Hunziker, W. (2019) · Biotechnology Advances · doi:10.1016/j.biotechadv.2019.107460 · Cited by 73
Tumor Cell Plasticity in Uveal Melanoma
Folberg, R., Arbieva, Z. H., Moses, J., Hayee, A., Sandal, T., Kadkol, S. S., Lin, A., Valyi‐Nagy, K., Setty, S., Leach, L., et al. (2006) · American Journal Of Pathology · doi:10.2353/ajpath.2006.060223 · Cited by 71
Park, D., Lim, J., Park, J. Y., & Lee, S. (2015) · Stem Cells Translational Medicine · doi:10.5966/sctm.2015-0095 · Cited by 70
Klinowska, T. C. M., Alexander, C. M., Georges‐Labouesse, E., van der Neut, R., Kreidberg, J. A., Jones, C. J. P., Sonnenberg, A., & Streuli, C. H. (2001) · Developmental Biology · doi:10.1006/dbio.2001.0204 · Cited by 71
Differentiation and Cancer in the Mammary Gland: Shedding Light on an Old Dichotomy
Petersen, O. W., Rønnov‐Jessen, L., Weaver, V. M., & Bissell, M. J. (1998) · Advances in cancer research · doi:10.1016/s0065-230x(08)60741-1 · Cited by 73
Self-citationNishikawa, R., Chiyomaru, T., Enokida, H., Inoguchi, S., Ishihara, T., Matsushita, R., Goto, Y., Fukumoto, I., Nakagawa, M., & Seki, N. (2015) · FEBS Letters · doi:10.1016/j.febslet.2015.06.005 · Cited by 70
Miura, Y., Kainuma, M., Jiang, H., Velasco, H., Vogt, P. K., & Hakomori, S. (2004) · Proceedings of the National Academy of Sciences · doi:10.1073/pnas.0407297101 · Cited by 70
Culture adaptation of embryonic stem cells echoes germ cell malignancy
Harrison, N. J., Baker, D., & Andrews, P. W. (2007) · International Journal of Andrology · doi:10.1111/j.1365-2605.2007.00762.x · Cited by 70
Lesniak, D. M., Sabri, S., Xu, Y., Graham, K., Bhatnagar, P. K., Suresh, M. R., & Abdulkarim, B. (2013) · PLoS ONE · doi:10.1371/journal.pone.0071987 · Cited by 69
Ionizing radiation induces heritable disruption of epithelial cell interactions
Park, C. C., Henshall-Powell, R. L., Erickson, A., Talhouk, R., Parvin, B., Bissell, M. J., & Barcellos‐Hoff, M. H. (2003) · Proceedings of the National Academy of Sciences · doi:10.1073/pnas.1832185100 · Cited by 71
Self-citationMesotrypsin promotes malignant growth of breast cancer cells through shedding of CD109
Hockla, A., Radisky, D. C., & Radisky, E. S. (2009) · Breast Cancer Research and Treatment · doi:10.1007/s10549-009-0699-0 · Cited by 70
Three-dimensional polymer scaffolds for high throughput cell-based assay systems
Cheng, K., Lai, Y., & Kisaalita, W. S. (2008) · Biomaterials · doi:10.1016/j.biomaterials.2008.03.015 · Cited by 71
Brockbank, E., Bridges, J., Marshall, C., & Sahai, E. A. (2004) · British Journal of Cancer · doi:10.1038/sj.bjc.6602255 · Cited by 69
β1 and β4 integrins: from breast development to clinical practice
Nisticò, P., Modugno, F. D., Spada, S., & Bissell, M. J. (2014) · Breast Cancer Research · doi:10.1186/s13058-014-0459-x · Cited by 69
Self-citationEdmondson, R., Adcock, A. F., & Yang, L. (2016) · PLoS ONE · doi:10.1371/journal.pone.0158116 · Cited by 69
Architecture in 3D cell culture: An essential feature for in vitro toxicology
Lelièvre, S. A., Kwok, T., & Chittiboyina, S. (2017) · Toxicology in Vitro · doi:10.1016/j.tiv.2017.03.012 · Cited by 72
Remodeling the ECM: Implications for Metastasis and Tumor Dormancy
Martino, J. S. D., Akhter, T., & Bravo‐Cordero, J. J. (2021) · Cancers · doi:10.3390/cancers13194916 · Cited by 70
Control of cancer formation by intrinsic genetic noise and microenvironmental cues
Brock, A., Krause, S., & Ingber, D. E. (2015) · Nature reviews. Cancer · doi:10.1038/nrc3959 · Cited by 72
Clinical opportunities and challenges in targeting tumour dormancy
Hensel, J. A., Flaig, T. W., & Theodorescu, D. (2012) · Nature Reviews Clinical Oncology · doi:10.1038/nrclinonc.2012.207 · Cited by 68
Gene Expression in the Third Dimension: The ECM-nucleus Connection
Spencer, V. A., Xu, R., & Bissell, M. J. (2010) · Journal of Mammary Gland Biology and Neoplasia · doi:10.1007/s10911-010-9163-3 · Cited by 68
Self-citationLoss of myoepithelium is variable in solid papillary carcinoma of the breast
Nicolas, M. M., Wu, Y., Middleton, L. P., & Gilcrease, M. Z. (2007) · Histopathology · doi:10.1111/j.1365-2559.2007.02849.x · Cited by 68
Attwood, S. J., Cortés, E., Haining, A. W. M., Robinson, B. K., Li, D., Gautrot, J. E., & Hernández, A. E. D. R. (2016) · Scientific Reports · doi:10.1038/srep34334 · Cited by 68
Metadata
- Authors
- Weaver, V. M., Petersen, O. W., Wang, F., Larabell, C. A., Briand, P., Damsky, C., & Bissell, M. J.
- Affiliations
- Lawrence Berkeley National Laboratory (US)
- Corresponding author
- Weaver, V.M.
- ORCID
- Weaver, V.M.
- Venue
- The Journal of Cell Biology
- Publisher
- Rockefeller University Press
- Published
- 1997-04-07
- Volume
- 137
- Issue
- 1
- Pages
- 231-245
- ISSN
- 0021-9525 (ISSN-L)
- 1540-8140
- PMC
- PMC2139858
- OpenAlex
- W1541555963
- Cited by
- 1,483
- References
- 98
- Citations by year
- 2026: 19 · 2025: 27 · 2024: 19 · 2023: 51 · 2022: 38 · 2021: 49 · 2020: 50 · 2019: 51 · 2018: 62 · 2017: 63 · 2016: 63 · 2015: 58 · 2014: 64 · 2013: 63 · 2012: 89
- FWCI
- 13.87
- Type
- journal article
- Language
- en
- Open access
- bronze
- doi.org
- Locations
- The Journal of Cell Biology (publishedVersion)
- PubMed Central (publishedVersion, cc-by-nc-sa)
- PubMed (publishedVersion)
- University of North Texas Digital Library (University of North Texas) (submittedVersion)
- OSTI OAI (U.S. Department of Energy Office of Scientific and Technical Information) (submittedVersion)
- eScholarship (California Digital Library) (submittedVersion)
- Research at the University of Copenhagen (University of Copenhagen) (submittedVersion)
- Lawrence Berkeley National Laboratory
- Funders
- U.S. Department of Defense (DE-AC02-05CH11231)
- U.S. Department of Energy (-AC02-05CH11231, DE-AC03-?, 05CH11231, DE AC02 05CH11231, DE-AC03-SF00098, DE-AC02-)
- Sundhed og Sygdom, Det Frie Forskningsråd
- National Institutes of Health (DE-AC02–05CH11231)
- Medical Research Council (DE-AC02-05CH11231)
- National Cancer Institute (CA-64786, R37CA064786, R01CA064786)
- Lawrence Berkeley National Laboratory (AC02‐05CH11231, DE-AC02-05CH11231, 05CH11231)
- Topics
- Health Sciences › Medicine › Immunology and Allergy › Cell Adhesion Molecules Research
- Life Sciences › Biochemistry, Genetics and Molecular Biology › Cell Biology › Cellular Mechanics and Interactions
- Health Sciences › Medicine › Oncology › Cancer Cells and Metastasis
- Keywords
- beta1 integrin, integrin blocking antibodies, breast cancer, 3D cell culture, E-cadherin-catenin complex, adherens junctions, extracellular matrix, mammary epithelial cells, cyclin D1, p21, tumor growth inhibition, cell polarity, tissue structure
- MeSH terms
- Animals, Antibodies, Monoclonal, Basement Membrane, Binding, Competitive, Breast Neoplasms, Cell Division, Extracellular Matrix, Female, Fluorescent Antibody Technique, Genotype, Humans, Immunoglobulin Fab Fragments, Phenotype, Transformation, Genetic, Tumor Cells, Cultured, Signal Transduction, Antigens, CD, Integrin beta1, Integrin beta4, Mice, Rats
About these checks
Registry, retraction, Cites and statistics results are computed, not judged, with one exception: a printed reference that no index lists is read once by a model before it counts as a citation error. Claims are extracted by a model and kept only when their quote appears verbatim in the text; each cited source is then checked, with a model’s help, for whether it says what the claim relies on. Those verdicts can be wrong — read the claim’s quote and the cited source before relying on one.
Statistics and arithmetic are recomputed, not judged.
Confidence bands are shown only for fields calibrated on our annotated test set. None is calibrated yet, so no band is shown.
What counts as a claim ›How we measure confidence ›How we check this ›
Are you an author, or do you see a problem with this page? Request a review
