

The DOI matches its Crossref record; 53 of the 53 references it cites were found in a registry or an index.
Mitofusins Mfn1 and Mfn2 coordinately regulate mitochondrial fusion and are essential for embryonic development
Open accessAbstract
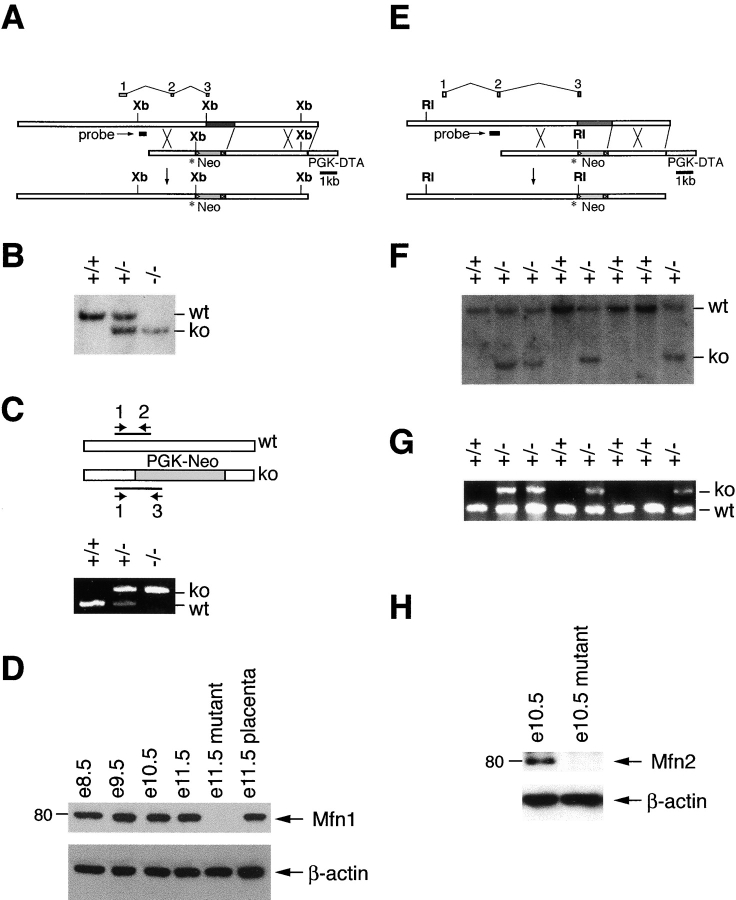
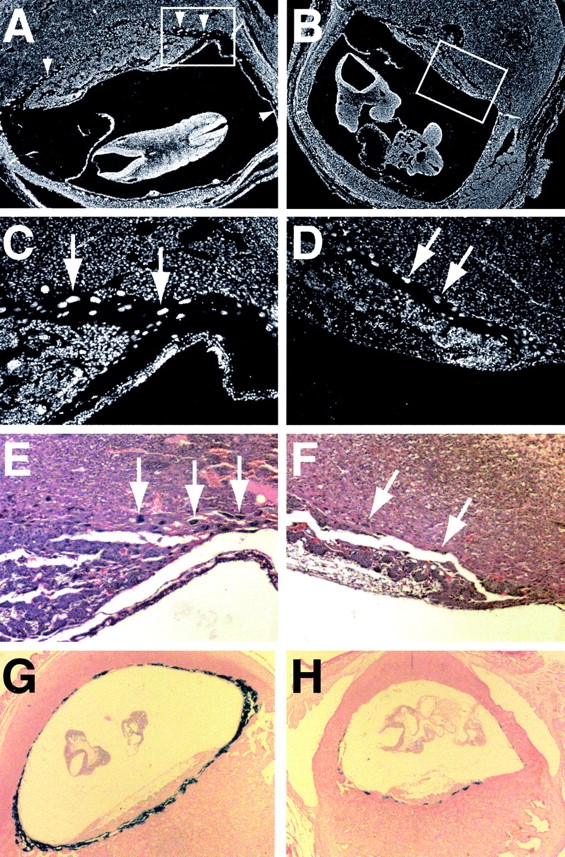
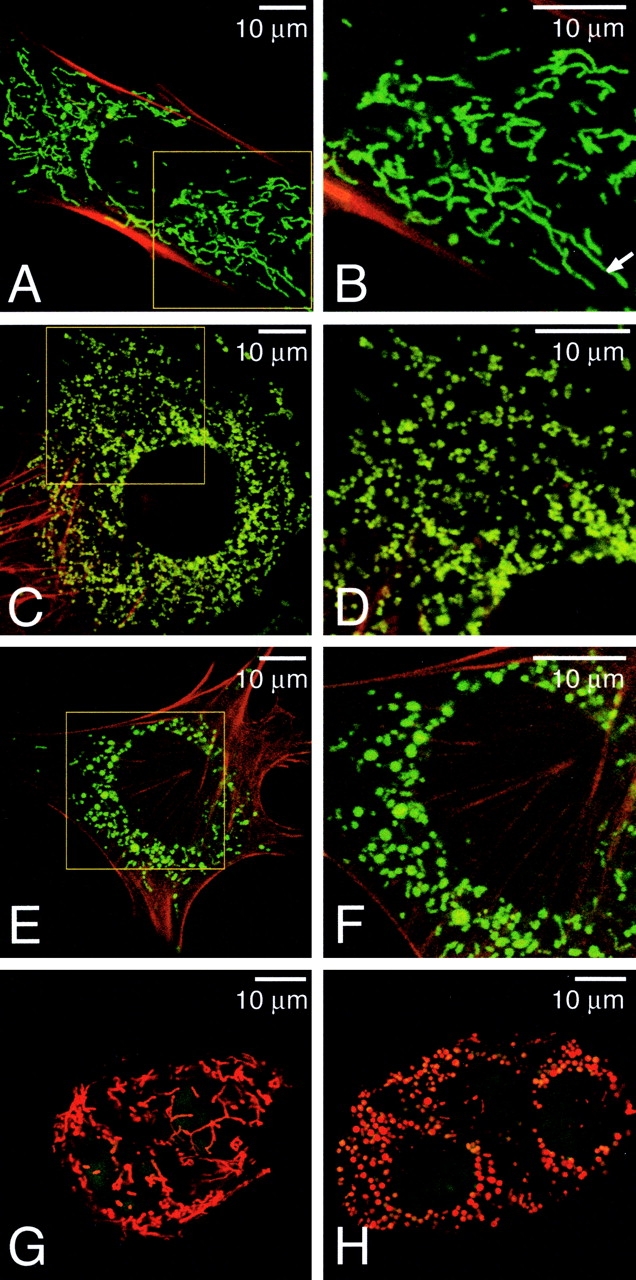
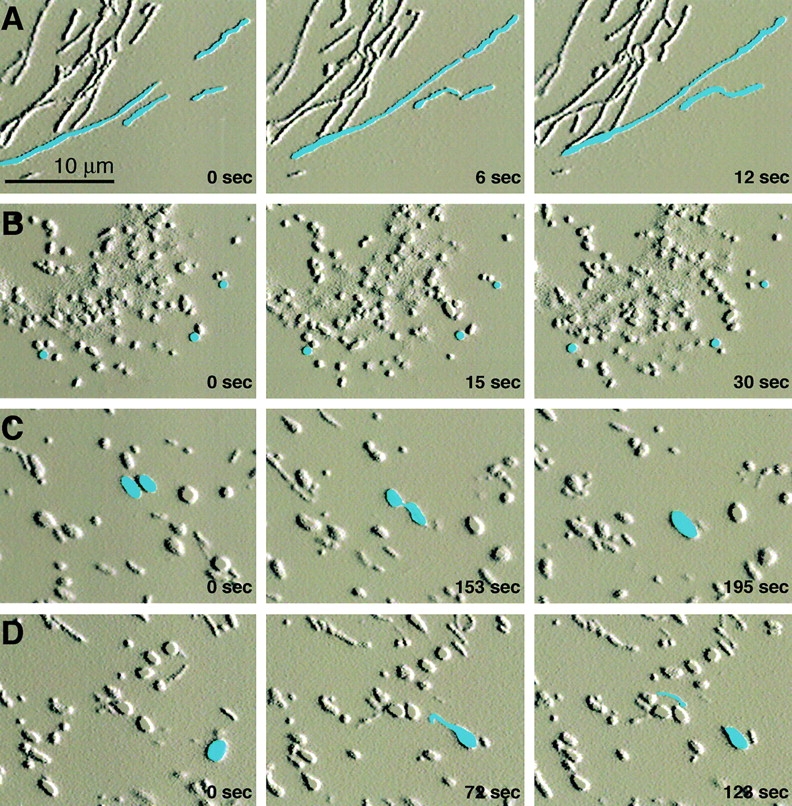
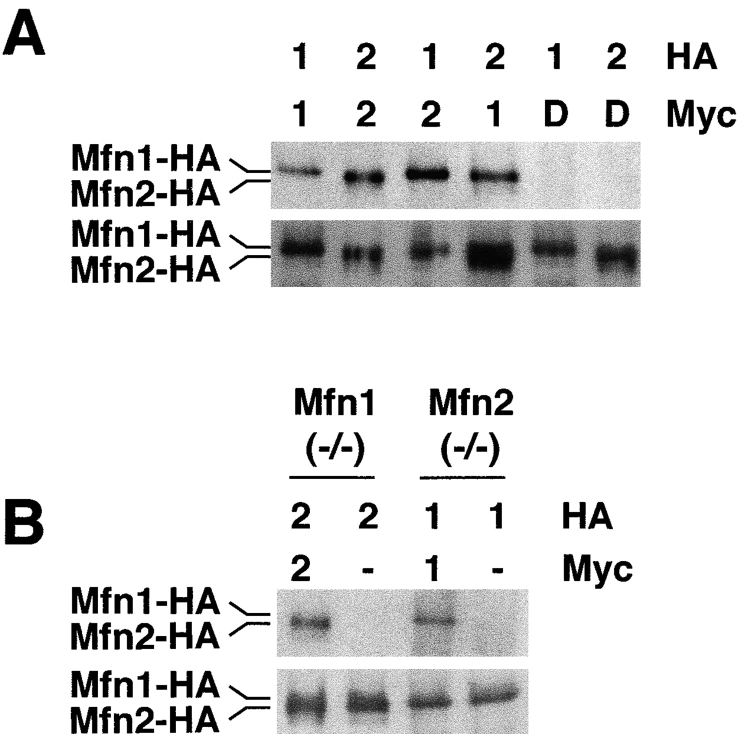
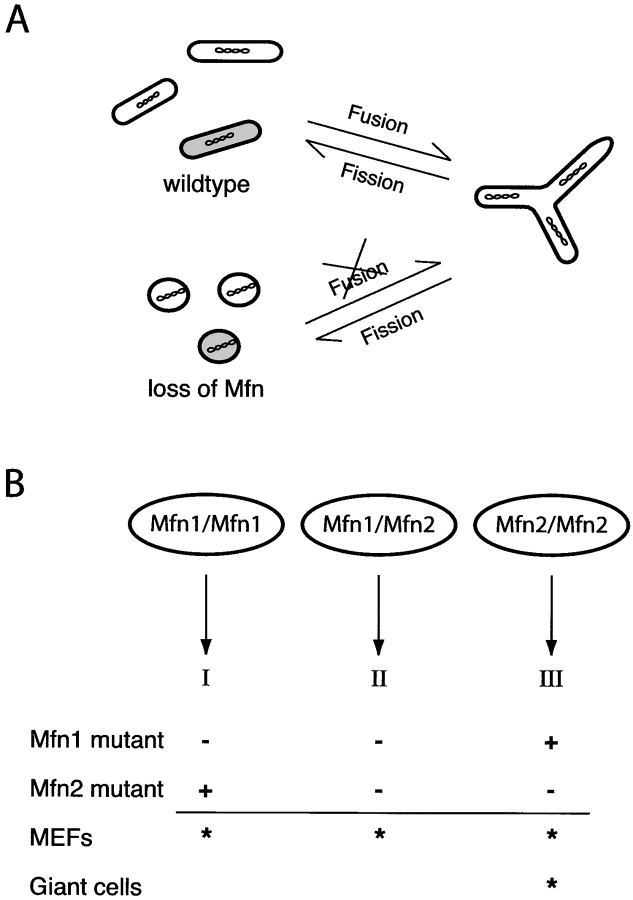
Mitochondrial morphology is determined by a dynamic equilibrium between organelle fusion and fission, but the significance of these processes in vertebrates is unknown. The mitofusins, Mfn1 and Mfn2, have been shown to affect mitochondrial morphology when overexpressed. We find that mice deficient in either Mfn1 or Mfn2 die in midgestation. However, whereas Mfn2 mutant embryos have a specific and severe disruption of the placental trophoblast giant cell layer, Mfn1-deficient giant cells are normal. Embryonic fibroblasts lacking Mfn1 or Mfn2 display distinct types of fragmented mitochondria, a phenotype we determine to be due to a severe reduction in mitochondrial fusion. Moreover, we find that Mfn1 and Mfn2 form homotypic and heterotypic complexes and show, by rescue of mutant cells, that the homotypic complexes are functional for fusion. We conclude that Mfn1 and Mfn2 have both redundant and distinct functions and act in three separate molecular complexes to promote mitochondrial fusion. Strikingly, a subset of mitochondria in mutant cells lose membrane potential. Therefore, mitochondrial fusion is essential for embryonic development, and by enabling cooperation between mitochondria, has protective effects on the mitochondrial population.
Overview
The claims and statistics of this paper haven’t been checked yet.
Run the check — free, no account needed. It reads the open-access text and checks the sources it cites.
Integrity signals
Registry
Cites
Statistics
Figures
Verification
Claims the paper makes
The claims and statistics of this paper haven’t been checked yet.
Run the check — free, no account needed. It reads the open-access text and checks the sources it cites.
Claims other papers make about this one
Each is checked against this paper’s own text: does it say what the citing paper says it does?
The cited source says what the claim attributes to it.
In the citing paper
“Genetic loss of MFN1 induces a higher degree of mitochondrial fragmentation than MFN2 deletion [60].”
From The connection between the dynamic remodeling of the mitochondrial network and the regulation of muscle mass (2021) · cites this paper as [60]
In the citing paper
“Mitochondrial fusion rates correlate with the OXPHOS capacity, higher in oxidative fibers than in glycolytic fibers [60].”
From The connection between the dynamic remodeling of the mitochondrial network and the regulation of muscle mass (2021) · cites this paper as [60]
In the citing paper
“The full knockout mice of either Mfn1, Mfn2, or OPA1 result in embryonic lethality of mice, demonstrating the biological importance of mitochondrial fusion in early development [60, 178].”
From The connection between the dynamic remodeling of the mitochondrial network and the regulation of muscle mass (2021) · cites this paper as [60]
In the citing paper
“Both Mfn proteins mediate fusion through their active GTPase domains by tethering opposing mitochondrial membranes (Chen et al., 2003; Eura et al., 2003).”
From New insights into the role of mitochondria in aging: mitochondrial dynamics and more (2010) · cites this paper as Chen et al., 2003
Self-check
Percentages, sums and reported differences re-computed from the paper’s own numbers.
The self-check needs the paper’s full text.
Citations
Cites
The GTPase superfamily: conserved structure and molecular mechanism
Bourne, H. R., Sanders, D. A., & McCormick, F. (1991) · Nature · doi:10.1038/349117a0 · Cited by 3,392
Close Contacts with the Endoplasmic Reticulum as Determinants of Mitochondrial Ca 2+ Responses
Rizzuto, R., Pinton, P., Carrington, W., Fay, F. S., Fogarty, K. E., Lifshitz, L. M., Tuft, R. A., & Pozzan, T. (1998) · Science · doi:10.1126/science.280.5370.1763 · Cited by 2,257
Regulation of Rate of Cartilage Differentiation by Indian Hedgehog and PTH-Related Protein
Vortkamp, A., Lee, K., Lanske, B., Segre, G. V., Kronenberg, H. M., & Tabin, C. J. (1996) · Science · doi:10.1126/science.273.5275.613 · Cited by 1,999
Dynamin-related Protein Drp1 Is Required for Mitochondrial Division in Mammalian Cells
Smirnova, E., Griparić, L., Shurland, D., & van der Bliek, A. M. (2001) · Molecular Biology of the Cell · doi:10.1091/mbc.12.8.2245 · Cited by 1,938
The Role of Dynamin-Related Protein 1, a Mediator of Mitochondrial Fission, in Apoptosis
Frank, S., Gaume, B., Bergmann-Leitner, E. S., Leitner, W. W., Robert, E. G., Catez, F., Smith, C. L., & Youle, R. J. (2001) · Developmental Cell · doi:10.1016/s1534-5807(01)00055-7 · Cited by 1,755
Promotion of Trophoblast Stem Cell Proliferation by FGF4
Tanaka, S., Kunath, T., Hadjantonakis, A., Nagy, A., & Rossant, J. (1998) · Science · doi:10.1126/science.282.5396.2072 · Cited by 1,370
Coiled coils: new structures and new functions
Lupas, A. N. (1996) · Trends in Biochemical Sciences · doi:10.1016/s0968-0004(96)10052-9 · Cited by 1,321
G PROTEIN MECHANISMS: Insights from Structural Analysis
Sprang, S. R. (1997) · Annual Review of Biochemistry · doi:10.1146/annurev.biochem.66.1.639 · Cited by 1,057
Control of mitochondrial morphology by a human mitofusin
Santel, A., & Fuller, M. T. (2001) · Journal of Cell Science · doi:10.1242/jcs.114.5.867 · Cited by 1,012
Bereiter‐Hahn, J., & Vöth, M. (1994) · Microscopy Research and Technique · doi:10.1002/jemt.1070270303 · Cited by 900
Research works printed but not linked: 3
- 1981, Eur. J. Cell Biol., 25, 175
- 1986, Mol. Cell. Biol., 6, 1204
- 1998, Mol. Med. Today., 4, 286
Cited by
Sorted by citations
Items 601–700 of 1,010
Luan, Y., Luan, Y., Yuan, R., Feng, Q., Chen, X., & Yang, Y. (2021) · Oxidative Medicine and Cellular Longevity · doi:10.1155/2021/4578809 · Cited by 115
Role of apoptotic and necrotic cell death under physiologic conditions
Han, S. I., Kim, Y.-S., & Kim, T. (2008) · BMB Reports · doi:10.5483/bmbrep.2008.41.1.001 · Cited by 106
HIV-1 Vpr Triggers Mitochondrial Destruction by Impairing Mfn2-Mediated ER-Mitochondria Interaction
Huang, K. C., Chiang, S., Lin, T., Chiou, S.-H., & Chow, K. (2012) · PLoS ONE · doi:10.1371/journal.pone.0033657 · Cited by 116
Regulation of mitochondrial morphology and function by O-GlcNAcylation in neonatal cardiac myocytes
Makino, A., Suárez, J., Gawlowski, T., Han, W., Wang, H., Scott, B. T., & DILLMANN, W. H. (2011) · American Journal of Physiology-Regulatory, Integrative and Comparative Physiology · doi:10.1152/ajpregu.00437.2010 · Cited by 104
Li, J., Liu, X., Wang, H., Zhang, W., Chan, D. C., & Shi, Y. (2012) · Proceedings of the National Academy of Sciences · doi:10.1073/pnas.1120043109 · Cited by 104
Self-citationDu, F., Yan, S., Yu, Q., Chen, D., & Yan, S. S. (2016) · Scientific Reports · doi:10.1038/srep31462 · Cited by 109
Ceramide-induced BOK promotes mitochondrial fission in preeclampsia
Ausman, J., Abbade, J. F., Ermini, L., Farrell, A., Tagliaferro, A., Post, M., & Caniggia, I. (2018) · Cell Death and Disease · doi:10.1038/s41419-018-0360-0 · Cited by 107
The role of mitochondrial dynamics in oocyte and early embryo development
Yildirim, R. M., & Seli, E. U. (2024) · Seminars in Cell and Developmental Biology · doi:10.1016/j.semcdb.2024.01.007 · Cited by 109
New Insights into the Role of Mitochondria-Associated Endoplasmic Reticulum Membrane
Fujimoto, M., & Hayashi, T. (2011) · International review of cytology · doi:10.1016/b978-0-12-386033-0.00002-5 · Cited by 106
Inhibition of Drp1-dependent mitochondrial division impairs myogenic differentiation
Kim, B., Kim, J.-S., Yoon, Y., Santiago, M. C., Brown, M. D., & Park, J. (2013) · American Journal of Physiology-Regulatory, Integrative and Comparative Physiology · doi:10.1152/ajpregu.00502.2012 · Cited by 105
On the move: organelle dynamics during mitosis
Jongsma, M. L. M., Berlin, I., & Neefjes, J. (2014) · Trends in Cell Biology · doi:10.1016/j.tcb.2014.10.005 · Cited by 102
Norkett, R., Modi, S., Birsa, N., Atkin, T. A., Ivankovic, D., Pathania, M., Trossbach, S. V., Korth, C., Hirst, W. D., & Kittler, J. T. (2015) · Journal of Biological Chemistry · doi:10.1074/jbc.m115.699447 · Cited by 104
Structural basis for GTP hydrolysis and conformational change of MFN1 in mediating membrane fusion
Yan, L., Qi, Y., Huang, X., Yu, C., Lan, L., Guo, X., Rao, Z., Hu, J., & Lou, Z. (2018) · Nature Structural & Molecular Biology · doi:10.1038/s41594-018-0034-8 · Cited by 100
The social nature of mitochondria: Implications for human health
Picard, M. A., & Sandi, C. (2020) · Neuroscience & Biobehavioral Reviews · doi:10.1016/j.neubiorev.2020.04.017 · Cited by 107
Obesity-Induced Brain Neuroinflammatory and Mitochondrial Changes
Schmitt, L. O., & Gaspar, J. M. (2023) · Metabolites · doi:10.3390/metabo13010086 · Cited by 112
Chung, K. W., Suh, B. C., Shy, M. E., Cho, S. Y., Yoo, J. H., Park, S. W., Moon, H., Park, K. D., Choi, K., Kim, S. T., et al. (2008) · Neuromuscular Disorders · doi:10.1016/j.nmd.2008.05.012 · Cited by 102
Insights into amyloid-β-induced mitochondrial dysfunction in Alzheimer disease
Wang, X., Su, B., Perry, G. L., Smith, M. A., & Zhu, X. (2007) · Free Radical Biology and Medicine · doi:10.1016/j.freeradbiomed.2007.09.007 · Cited by 102
Bernard‐Marissal, N., van Hameren, G., Juneja, M., Pellegrino, C., Louhivuori, L. M., Bartesaghi, L., Rochat, C., Mansour, O. E., Médard, J., Croisier, M., et al. (2019) · Proceedings of the National Academy of Sciences · doi:10.1073/pnas.1810932116 · Cited by 103
Restoring mitofusin balance prevents axonal degeneration in a Charcot-Marie-Tooth type 2A model
Zhou, Y., Carmona, S., Muhammad, A. K. M. G., Bell, S., Landeros, J., Vazquez, M., Ho, R., Franco, A., Lü, B., Dorn, G. W., et al. (2019) · Journal of Clinical Investigation · doi:10.1172/jci124194 · Cited by 102
Zeng, K., Wang, J., Wang, L., Guo, Q., Liu, T., Wang, F., Feng, N., Zhang, X., Liao, L., Zhao, M., et al. (2021) · Signal Transduction and Targeted Therapy · doi:10.1038/s41392-020-00447-6 · Cited by 105
Vimentin supports mitochondrial morphology and organization
Tang, H. L., Lung, H. L., Wu, K. C., Le, A.-H., Tang, H. M., & Fung, M. C. (2008) · Biochemical Journal · doi:10.1042/bj20071072 · Cited by 101
Regulation of mitochondrial morphology by APC/CCdh1-mediated control of Drp1 stability
Horn, S. R. G.-V., Thomenius, M. J., Johnson, E. S., Freel, C. D., Wu, J. Q., Coloff, J. L., Yang, C., Tang, W., An, J., Ilkayeva, O., et al. (2011) · Molecular Biology of the Cell · doi:10.1091/mbc.e10-07-0567 · Cited by 100
Regulation of mitochondrial dynamics: convergences and divergences between yeast and vertebrates
Zhao, J., Lendahl, U., & Nistér, M. (2012) · Cellular and Molecular Life Sciences · doi:10.1007/s00018-012-1066-6 · Cited by 105
Mitofusins deficiency elicits mitochondrial metabolic reprogramming to pluripotency
Son, M. J., Kwon, Y., Son, M.-Y., Seol, B., Choi, H.-S., Ryu, S.-W., Choi, C., & Cho, Y. S. (2015) · Cell Death and Differentiation · doi:10.1038/cdd.2015.43 · Cited by 99
Mitochondrial Dysfunction in Cardiovascular Diseases: Potential Targets for Treatment
Yang, J., Guo, Q., Feng, X., Liu, Y., & Zhou, Y. (2022) · Frontiers in Cell and Developmental Biology · doi:10.3389/fcell.2022.841523 · Cited by 105
Ježek, P., & Plecitá‐Hlavatá, L. (2009) · The International Journal of Biochemistry & Cell Biology · doi:10.1016/j.biocel.2009.02.014 · Cited by 106
Mitochondrial-Shaping Proteins in Cardiac Health and Disease – the Long and the Short of It!
Ong, S., Kalkhoran, S. B., Hernández‐Reséndiz, S., Samangouei, P., Ong, S., & Hausenloy, D. J. (2017) · Cardiovascular Drugs and Therapy · doi:10.1007/s10557-016-6710-1 · Cited by 103
Lackner, L. L., & Nunnari, J. M. (2010) · Chemistry & Biology · doi:10.1016/j.chembiol.2010.05.016 · Cited by 101
Hasnat, M., Yuan, Z., Naveed, M., Asifullah, K., Raza, F., Xu, D., Ullah, A., Sun, L., Zhang, L., & Jiang, Z. (2018) · Cell Biology and Toxicology · doi:10.1007/s10565-018-9447-8 · Cited by 100
Lysosomal Regulation of Inter-mitochondrial Contact Fate and Motility in Charcot-Marie-Tooth Type 2
Wong, Y. C., Peng, W., & Krainc, D. (2019) · Developmental Cell · doi:10.1016/j.devcel.2019.05.033 · Cited by 107
Veeresh, P., Kaur, H., Sarmah, D., Mounica, L., Verma, G., Kotian, V., Kesharwani, R., Kalia, K., Borah, A., Wang, X., et al. (2019) · Annals of the New York Academy of Sciences · doi:10.1111/nyas.14212 · Cited by 98
Mitochondrial Dynamics and Mitophagy in Cardiometabolic Disease
Lin, J., Duan, J., Wang, Q., Xu, S., Zhou, S., & Yao, K. (2022) · Frontiers in Cardiovascular Medicine · doi:10.3389/fcvm.2022.917135 · Cited by 103
Lei, Y., Gan, M., Qiu, Y., Chen, Q., Wang, X., Liao, T., Zhao, M., Chen, L., Zhang, S., Zhao, Y., et al. (2024) · Cellular & Molecular Biology Letters · doi:10.1186/s11658-024-00572-y · Cited by 111
The Respiratory Chain Supercomplex Organization Is Independent of COX7a2l Isoforms
Mourier, A., Matic, S., Ruzzenente, B., Larsson, N., & Milenkovic, D. (2014) · Cell Metabolism · doi:10.1016/j.cmet.2014.11.005 · Cited by 99
Zhang, M., Bener, M. B., Jiang, Z., Wang, T., Esencan, E., Scott, R., Horváth, T. L., & Seli, E. U. (2019) · Aging · doi:10.18632/aging.102024 · Cited by 99
Mitochondrial dynamics during spermatogenesis
Varuzhanyan, G., & Chan, D. C. (2020) · Journal of Cell Science · doi:10.1242/jcs.235937 · Cited by 106
Self-citationSingaravelu, K., Nelson, C., Bakowski, D., de Brito, O. M., Ng, S.-W., Capite, J. L. D., Powell, T., Scorrano, L., & Parekh, A. B. (2011) · Journal of Biological Chemistry · doi:10.1074/jbc.m110.174029 · Cited by 101
White, K., Davies, V. J., Hogan, V. E., Piechota, M. J., Nichols, P. P., Turnbull, D. M., & Votruba, M. (2009) · Investigative Ophthalmology & Visual Science · doi:10.1167/iovs.08-2913 · Cited by 98
Gannon, A. M., Stämpfli, M. R., & Foster, W. G. (2013) · Biology of Reproduction · doi:10.1095/biolreprod.112.106617 · Cited by 98
Muscle choline kinase beta defect causes mitochondrial dysfunction and increased mitophagy
Mitsuhashi, S., Hatakeyama, H., Karahashi, M., Koumura, T., Nonaka, I., Hayashi, Y. K., Noguchi, S., Sher, R. B., Nakagawa, Y., Manfredi, G., et al. (2011) · Human Molecular Genetics · doi:10.1093/hmg/ddr305 · Cited by 95
The Interplay between Mitochondrial Morphology and Myomitokines in Aging Sarcopenia
Romanello, V. (2020) · International Journal of Molecular Sciences · doi:10.3390/ijms22010091 · Cited by 101
Meeusen, S., & Nunnari, J. M. (2005) · Current Opinion in Cell Biology · doi:10.1016/j.ceb.2005.06.014 · Cited by 97
Drug delivery by polymeric nanoparticles induces autophagy in macrophages
Eidi, H., Joubert, O., Némos, C., Grandemange, S., Mograbi, B., Foliguet, B., Tournebize, J., Maincent, P., Faou, A. L., Aboukhamis, I., et al. (2011) · International Journal of Pharmaceutics · doi:10.1016/j.ijpharm.2011.11.020 · Cited by 96
The Maintenance of Mitochondrial DNA Integrity and Dynamics by Mitochondrial Membranes
Chapman, J., Ng, Y. S., & Nicholls, T. J. J. (2020) · Life · doi:10.3390/life10090164 · Cited by 100
Sidarala, V., Zhu, J., Levi-D’Ancona, E., Pearson, G. L., Reck, E. C., Walker, E. M., Kaufman, B. A., & Soleimanpour, S. A. (2022) · Nature Communications · doi:10.1038/s41467-022-29945-7 · Cited by 100
HUMMR, a hypoxia- and HIF-1α–inducible protein, alters mitochondrial distribution and transport
Li, Y., Lim, S., Hoffman, D. L., Aspenström, P., Federoff, H. J., & Rempe, D. A. (2009) · The Journal of Cell Biology · doi:10.1083/jcb.200811033 · Cited by 99
Arnold, S., & Beyer, C. (2009) · Journal of Neurochemistry · doi:10.1111/j.1471-4159.2009.06133.x · Cited by 97
Zhang, Y., Yang, L., Yuan-fu, G., Fan, Z., Cai, X., Liu, M., Guo, X., Gao, C., & Xia, Z. (2013) · Molecular and Cellular Endocrinology · doi:10.1016/j.mce.2013.08.004 · Cited by 96
Opening the doors to cytochrome c: Changes in mitochondrial shape and apoptosis
Scorrano, L. (2009) · The International Journal of Biochemistry & Cell Biology · doi:10.1016/j.biocel.2009.04.016 · Cited by 96
Highlighting the endoplasmic reticulum-mitochondria connection: Focus on Mitofusin 2
Filadi, R., Greotti, E., & Pizzo, P. (2018) · Pharmacological Research · doi:10.1016/j.phrs.2018.01.003 · Cited by 104
Zhong, X., Cui, P., Cai, Y., Wang, L., He, X., Long, P., Lu, K., Yan, R., Zhang, Y., Pan, X., et al. (2018) · Cell Metabolism · doi:10.1016/j.cmet.2018.11.007 · Cited by 96
Mitochondrial dysfunction in glaucoma: Understanding genetic influences
Lascaratos, G., Garway‐Heath, D. F., Willoughby, C. E., Chau, K., & Schapira, A. H. V. (2011) · Mitochondrion · doi:10.1016/j.mito.2011.11.004 · Cited by 97
Mitochondrial fusion provides an ‘initial metabolic complementation’ controlled by mtDNA
Yang, L., Long, Q., Liu, J., Tang, H., Li, Y., Bao, F., Qin, D., Pei, D., & Liu, X. (2015) · Cellular and Molecular Life Sciences · doi:10.1007/s00018-015-1863-9 · Cited by 95
Mechanistic perspective of mitochondrial fusion: Tubulation vs. fragmentation
Escobar‐Henriques, M., & den Brave, F. (2012) · Biochimica et Biophysica Acta (BBA) - Molecular Cell Research · doi:10.1016/j.bbamcr.2012.07.016 · Cited by 100
Molecular Biology of the Stress Response in the Early Embryo and its Stem Cells
Puscheck, E. E., Awonuga, A. O., Yang, Y., Jiang, Z., & Rappolee, D. A. (2015) · Advances in experimental medicine and biology · doi:10.1007/978-1-4939-2480-6_4 · Cited by 96
Cherok, E., Xu, S., Li, S., Das, S., Meltzer, W. A., Zalzman, M., Wang, C., & Karbowski, M. (2016) · Molecular Biology of the Cell · doi:10.1091/mbc.e16-04-0208 · Cited by 94
Mitofusin gain and loss of function drive pathogenesis in Drosophila models of CMT2A neuropathy
Fissi, N. E., Rojo, M., Aouane, A., Karataş, E., Poliacikova, G., David, C., Royet, J., & Rival, T. (2018) · EMBO Reports · doi:10.15252/embr.201745241 · Cited by 96
Natural history of Charcot-Marie-Tooth disease type 2A: a large international multicentre study
Pipis, M., Feely, S. M. E., Polke, J. M., Skorupinska, M., Pérez, L., Shy, R. R., Laurá, M., Morrow, J. M., Moroni, I., Pisciotta, C., et al. (2020) · Brain · doi:10.1093/brain/awaa323 · Cited by 95
Madan, S., Uttekar, B., Chowdhary, S., & Rikhy, R. (2022) · Frontiers in Cell and Developmental Biology · doi:10.3389/fcell.2021.781933 · Cited by 100
Mitochondrial calcium in cardiac ischemia/reperfusion injury and cardioprotection
Bertero, E., Popoiu, T.-A., & Maack, C. (2024) · Basic Research in Cardiology · doi:10.1007/s00395-024-01060-2 · Cited by 111
Multifarious molecular signaling cascades of cardiac hypertrophy: Can the muddy waters be cleared?☆
Balakumar, P., & Jagadeesh, G. (2010) · Pharmacological Research · doi:10.1016/j.phrs.2010.07.003 · Cited by 95
Plecitá‐Hlavatá, L., Lessard, M. D., Šantorová, J., Bewersdorf, J., & Ježek, P. (2008) · Biochimica et Biophysica Acta (BBA) - Bioenergetics · doi:10.1016/j.bbabio.2008.04.002 · Cited by 98
Vallat, J., Ouvrier, R., Pollard, J. D., Magdelaine, C., Zhu, D., Nicholson, G. A., Grew, S., Ryan, M. M., & Funalot, B. (2008) · Journal of Neuropathology & Experimental Neurology · doi:10.1097/nen.0b013e31818b6cbc · Cited by 98
Wakai, T., Harada, Y., Miyado, K., & Kono, T. (2014) · Molecular Human Reproduction · doi:10.1093/molehr/gau064 · Cited by 90
Zhou, Q., Li, H., Li, Y., Tan, M., Fan, S., Cao, C., Meng, F., Zhu, L., Zhao, L., Guan, M., et al. (2019) · JCI Insight · doi:10.1172/jci.insight.121582 · Cited by 94
The Mitochondrial Fission Receptor MiD51 Requires ADP as a Cofactor
Losón, O. C., Liu, R., Rome, M. E., Meng, S., Kaiser, J. T., Shan, S., & Chan, D. C. (2014) · Structure · doi:10.1016/j.str.2014.01.001 · Cited by 94
Self-citationPark, J., Choi, H., Min, J., Kim, B., Lee, S., Yun, J. W., Choi, M., Chang, K., & Lee, D. (2015) · Journal of Neurochemistry · doi:10.1111/jnc.12984 · Cited by 93
Organelle dynamics and dysfunction: A closer link between peroxisomes and mitochondria
Camões, F., Bonekamp, N. A., Delille, H. K., & Schrader, M. (2008) · Journal of Inherited Metabolic Disease · doi:10.1007/s10545-008-1018-3 · Cited by 93
Kondadi, A. K., Anand, R., & Reichert, A. S. (2019) · International Journal of Molecular Sciences · doi:10.3390/ijms20174311 · Cited by 94
Scheffer, D. D. L., Garcia, A. A., Lee, L., Mochly‐Rosen, D., & Ferreira, J. C. B. (2022) · Antioxidants and Redox Signaling · doi:10.1089/ars.2021.0145 · Cited by 96
Wang, W., Lu, J., Zhu, F., Wei, J., Jia, C., Zhang, Y., Zhou, L., Xie, H., & Zheng, S. (2010) · Medical Oncology · doi:10.1007/s12032-010-9779-6 · Cited by 92
The Role of the Transmembrane RING Finger Proteins in Cellular and Organelle Function
Nakamura, N. (2011) · Membranes · doi:10.3390/membranes1040354 · Cited by 92
Galloway, C. A., Lee, H., Nejjar, S., Jhun, B. S., Yu, T., Hsu, W., & Yoon, Y. (2012) · Diabetes · doi:10.2337/db11-1640 · Cited by 92
Rocha, N., Bulger, D. A., Frontini, A., Titheradge, H. L., Gribsholt, S. B., Knox, R. G., Page, M., Harris, J. R., Payne, F., Adams, C., et al. (2017) · eLife · doi:10.7554/elife.23813 · Cited by 93
Yamaoka, S., & Leaver, C. J. (2008) · The Plant Cell · doi:10.1105/tpc.107.055756 · Cited by 91
Rocha, S., Freitas, A., Guimarães, S., Vitorino, R. M. P., Aroso, M., & Gómez-Lázaro, M. (2017) · Antioxidants · doi:10.3390/antiox7010001 · Cited by 93
Mitochondrial Properties in Skeletal Muscle Fiber
Dong, H., & Tsai, S. (2023) · Cells · doi:10.3390/cells12172183 · Cited by 102
Haga, N., Fujita, N., & Tsuruo, T. (2005) · Cancer Science · doi:10.1111/j.1349-7006.2005.00114.x · Cited by 91
Regulation of mitochondrial permeability transition pore by PINK1
Gautier, C., Giaime, E., Caballero, E., Núñez, L., Song, Z., Chan, D. C., Villalobos, C., & Shen, J. (2012) · Molecular Neurodegeneration · doi:10.1186/1750-1326-7-22 · Cited by 93
Self-citationChurch, R. J., Gatti, D. M., Urban, T. J., Long, N., Yang, X., Shi, Q., Eaddy, J. S., Mosedale, M., Ballard, S., Churchill, G. A., et al. (2014) · Food and Chemical Toxicology · doi:10.1016/j.fct.2014.11.008 · Cited by 90
MTCH2-mediated mitochondrial fusion drives exit from naïve pluripotency in embryonic stem cells
Bahat, A., Goldman, A., Zaltsman, Y., Khan, D. H., Halperin, C., Amzallag, E., Krupalnik, V., Mullokandov, M., Silberman, A., Erez, A., et al. (2018) · Nature Communications · doi:10.1038/s41467-018-07519-w · Cited by 90
Role of mitochondrial quality control in the pathogenesis of nonalcoholic fatty liver disease
Li, R., Toan, S., & Zhou, H. (2020) · Aging · doi:10.18632/aging.102972 · Cited by 89
Lee, J., & Song, C. (2021) · Antioxidants · doi:10.3390/antiox10060872 · Cited by 91
Structural implications of mitochondrial dynamics
Bereiter‐Hahn, J., Vöth, M., Mai, S., & Jendrach, M. (2008) · Biotechnology Journal · doi:10.1002/biot.200800024 · Cited by 92
Mitochondrial dynamics in cancer-induced cachexia
van der Ende, M., Grefte, S., Plas, R., Meijerink, J., Witkamp, R. F., Keijer, J., & van Norren, K. (2018) · Biochimica et Biophysica Acta (BBA) - Reviews on Cancer · doi:10.1016/j.bbcan.2018.07.008 · Cited by 87
Jiang, W., Liu, H., Wan, R., Wu, Y., Shi, Z., & Huang, W. (2021) · Ageing Research Reviews · doi:10.1016/j.arr.2021.101315 · Cited by 91
Neutzner, A., & Youle, R. J. (2005) · Journal of Biological Chemistry · doi:10.1074/jbc.m500807200 · Cited by 89
The role of mitochondria in rheumatic diseases
Becker, Y. L. C., Duvvuri, B., Fortin, P. R., Lood, C., & Boilard, E. (2022) · Nature Reviews Rheumatology · doi:10.1038/s41584-022-00834-z · Cited by 81
Norris, K. L., Hao, R., Chen, L., Lai, C.-H., Kapur, M., Shaughnessy, P. J., Chou, D., Yan, J., Taylor, J. P., Engelender, S., et al. (2015) · Journal of Biological Chemistry · doi:10.1074/jbc.m114.634063 · Cited by 88
Zampieri, S., Mammucari, C., Romanello, V., Barberi, L., Pietrangelo, L., Fusella, A., Mosole, S., Gherardi, G., Höfer, C., Löfler, S., et al. (2016) · Physiological Reports · doi:10.14814/phy2.13005 · Cited by 92
Mechanisms, pathophysiological roles and methods for analyzing mitophagy – recent insights
Williams, J. A. R., & Ding, W. (2017) · Biological Chemistry · doi:10.1515/hsz-2017-0228 · Cited by 92
Bernard‐Marissal, N., Chrast, R., & Schneider, B. L. (2018) · Cell Death and Disease · doi:10.1038/s41419-017-0125-1 · Cited by 88
Twig, G., Liu, X., Liesa, M., Wikström, J. D., Molina, A. J. A., Las, G., Yaniv, G., Hajnóczky, G., & Shirihai, O. S. (2010) · American Journal of Physiology-Cell Physiology · doi:10.1152/ajpcell.00427.2009 · Cited by 89
Trevisan, T., Pendin, D., Montagna, A., Bova, S., Ghelli, A. M., & Daga, A. (2018) · Cell Reports · doi:10.1016/j.celrep.2018.04.017 · Cited by 86
Baek, M. L., Lee, J., Pendleton, K. E., Berner, M. J., Goff, E. B., Tan, L., Martinez, S. A., Mahmud, I., Wang, T., Meyer, M. D., et al. (2023) · Oncogene · doi:10.1038/s41388-023-02596-8 · Cited by 88
Homozygous mutations inMFN2cause multiple symmetric lipomatosis associated with neuropathy
Sawyer, S. L., Ng, A. C., Innes, A. M., Wagner, J. D., Dyment, D. A., Tétreault, M., Majewski, J., Boycott, K. M., Screaton, R. A., & Nicholson, G. A. (2015) · Human Molecular Genetics · doi:10.1093/hmg/ddv229 · Cited by 87
Recessive axonal Charcot-Marie-Tooth disease due to compound heterozygous mitofusin 2 mutations
Polke, J. M., Laurá, M., Pareyson, D., Taroni, F., Milani, M., Bergamin, G., Gibbons, V. S., Houlden, H., Chamley, S. C., Blake, J. C., et al. (2011) · Neurology · doi:10.1212/wnl.0b013e3182242d4d · Cited by 87
Shidara, Y., & Hollenbeck, P. J. (2010) · Journal of Neuroscience · doi:10.1523/jneurosci.0529-10.2010 · Cited by 91
Thoudam, T., Jeon, J., Ha, C., & Lee, I. (2016) · Mediators of Inflammation · doi:10.1155/2016/1851420 · Cited by 91
McNew, J. A., Sondermann, H., Tina Munn Yi, L. E. E., Stern, M., & Brandizzí, F. (2013) · Annual Review of Cell and Developmental Biology · doi:10.1146/annurev-cellbio-101512-122328 · Cited by 85
Metadata
- Authors
- Chen, H., Detmer, S. A., Ewald, A. J., Griffin, E. E., Fraser, S. E., & Chan, D. C.
- Affiliations
- California Institute of Technology (US)
- Venue
- The Journal of Cell Biology
- Publisher
- Rockefeller University Press
- Published
- 2003-01-13
- Volume
- 160
- Issue
- 2
- Pages
- 189-200
- ISSN
- 0021-9525 (ISSN-L)
- 1540-8140
- PMC
- PMC2172648
- OpenAlex
- W2073095545
- Cited by
- 2,601
- References
- 52
- Citations by year
- 2026: 111 · 2025: 132 · 2024: 143 · 2023: 149 · 2022: 173 · 2021: 192 · 2020: 170 · 2019: 149 · 2018: 160 · 2017: 127 · 2016: 121 · 2015: 115 · 2014: 126 · 2013: 103 · 2012: 112
- FWCI
- 14.48
- Type
- journal article
- Language
- en
- Open access
- green
- www.ncbi.nlm.nih.gov
- Licence
- cc-by-nc-sa
- Locations
- The Journal of Cell Biology (publishedVersion)
- PubMed Central (publishedVersion, cc-by-nc-sa)
- PubMed (publishedVersion)
- CaltechAUTHORS (California Institute of Technology) (submittedVersion, cc-by-nc-sa)
- Warwick Research Archive Portal (University of Warwick) (submittedVersion)
- Funders
- National Institute of General Medical Sciences (1 R01 GM62967-01, R01GM062967, T32GM007616, GM07616)
- Topics
- Life Sciences › Biochemistry, Genetics and Molecular Biology › Molecular Biology › Mitochondrial Function and Pathology
- Life Sciences › Biochemistry, Genetics and Molecular Biology › Cell Biology › Autophagy in Disease and Therapy
- Life Sciences › Biochemistry, Genetics and Molecular Biology › Molecular Biology › Cell death mechanisms and regulation
- Keywords
- mitofusins, Mfn1, mitofusin 2, mitochondrial fusion, mitochondrial fission, mitochondrial morphology, embryonic development, mitochondrial membrane potential, mitochondrial fragmentation, embryonic fibroblasts, mouse mutants
- MeSH terms
- Animals, Cell Movement, Cells, Cultured, Cytoskeletal Proteins, Embryo, Mammalian, Female, Embryonic and Fetal Development, Fetus, Genes, Lethal, Intracellular Membranes, Male, Membrane Potentials, Membrane Proteins, Mitochondria, Placenta, Trophoblasts, Mice, Knockout, Gene Expression Regulation, Developmental, GTP Phosphohydrolases, Embryo Loss, Mitochondrial Proteins, Membrane Transport Proteins, Mitochondrial Membrane Transport Proteins, Macromolecular Substances, Utrophin, Mice
About these checks
Registry, retraction, Cites and statistics results are computed, not judged, with one exception: a printed reference that no index lists is read once by a model before it counts as a citation error. Claims are extracted by a model and kept only when their quote appears verbatim in the text; each cited source is then checked, with a model’s help, for whether it says what the claim relies on. Those verdicts can be wrong — read the claim’s quote and the cited source before relying on one.
Statistics and arithmetic are recomputed, not judged.
Confidence bands are shown only for fields calibrated on our annotated test set. None is calibrated yet, so no band is shown.
What counts as a claim ›How we measure confidence ›How we check this ›
Are you an author, or do you see a problem with this page? Request a review
