

The DOI matches its Crossref record; 44 of the 44 references it cites were found in a registry or an index.
The positioning and segregation of apical cues during epithelial polarity establishment in Drosophila
Open accessAbstract
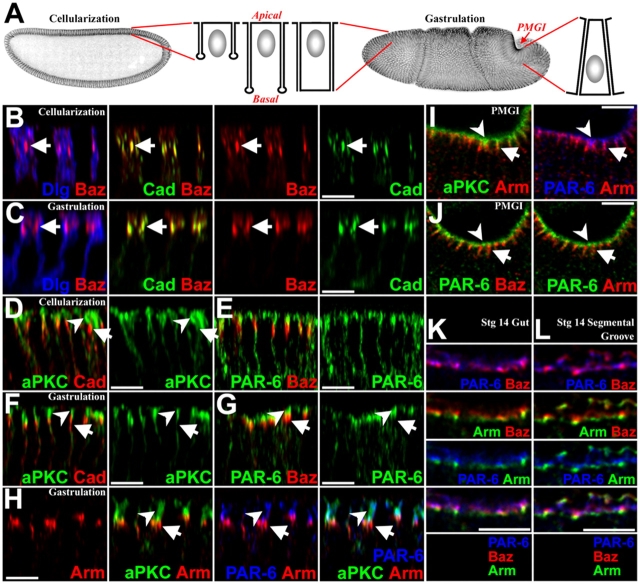
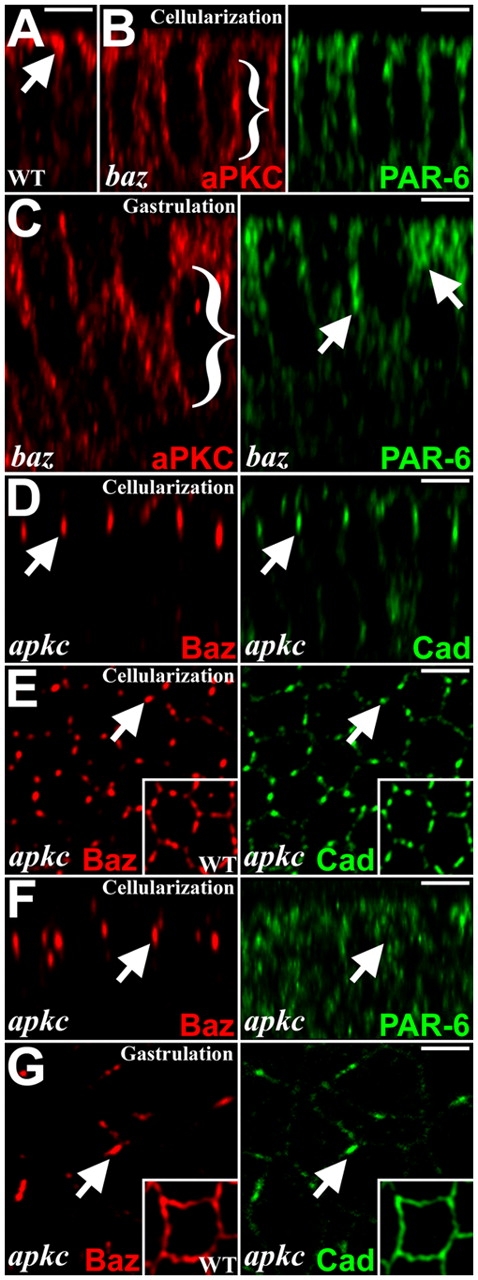
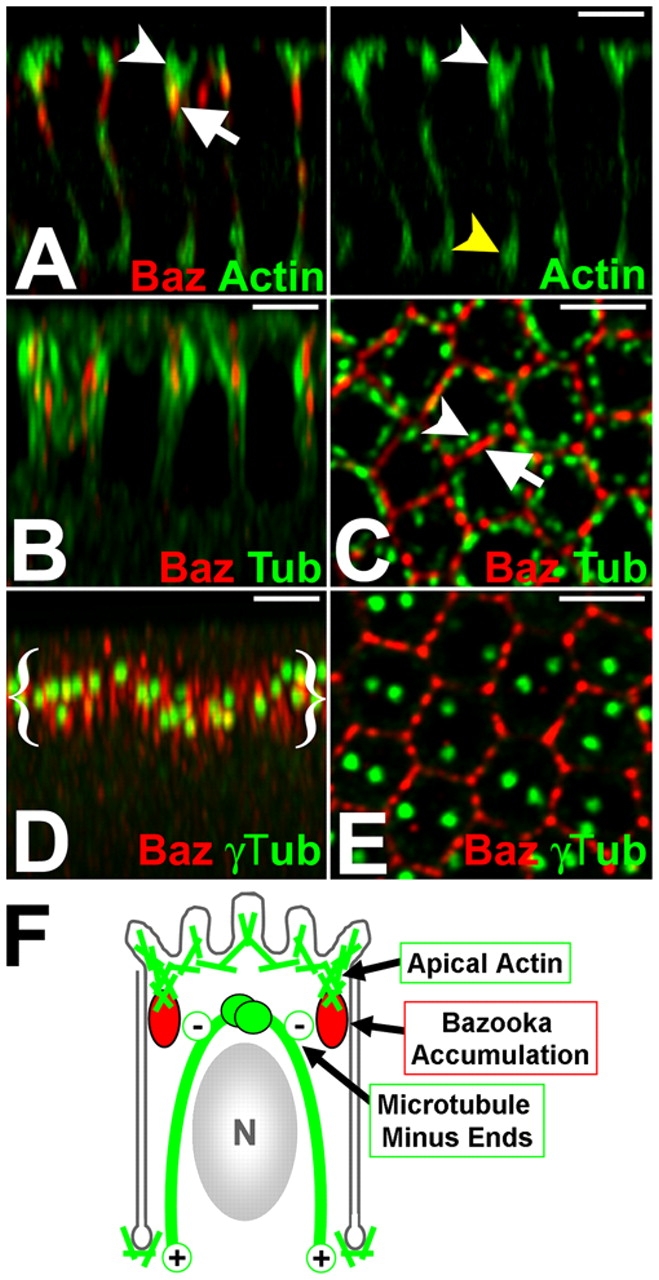
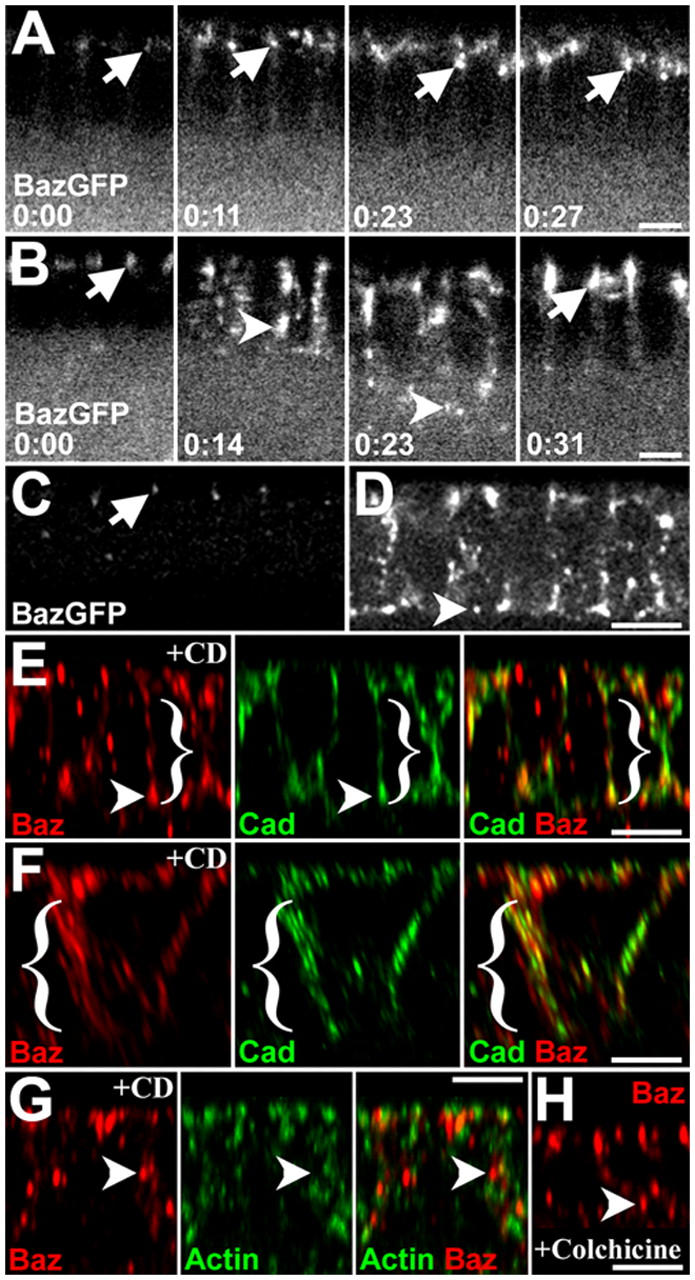
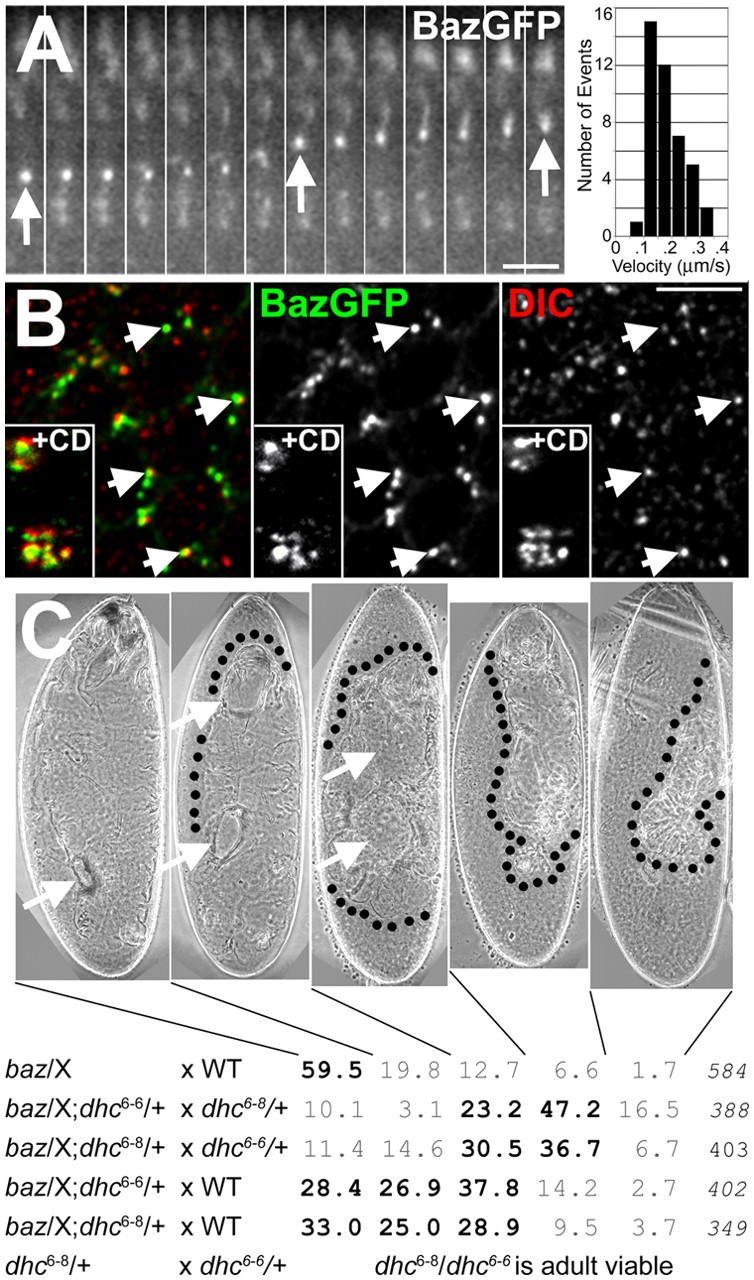
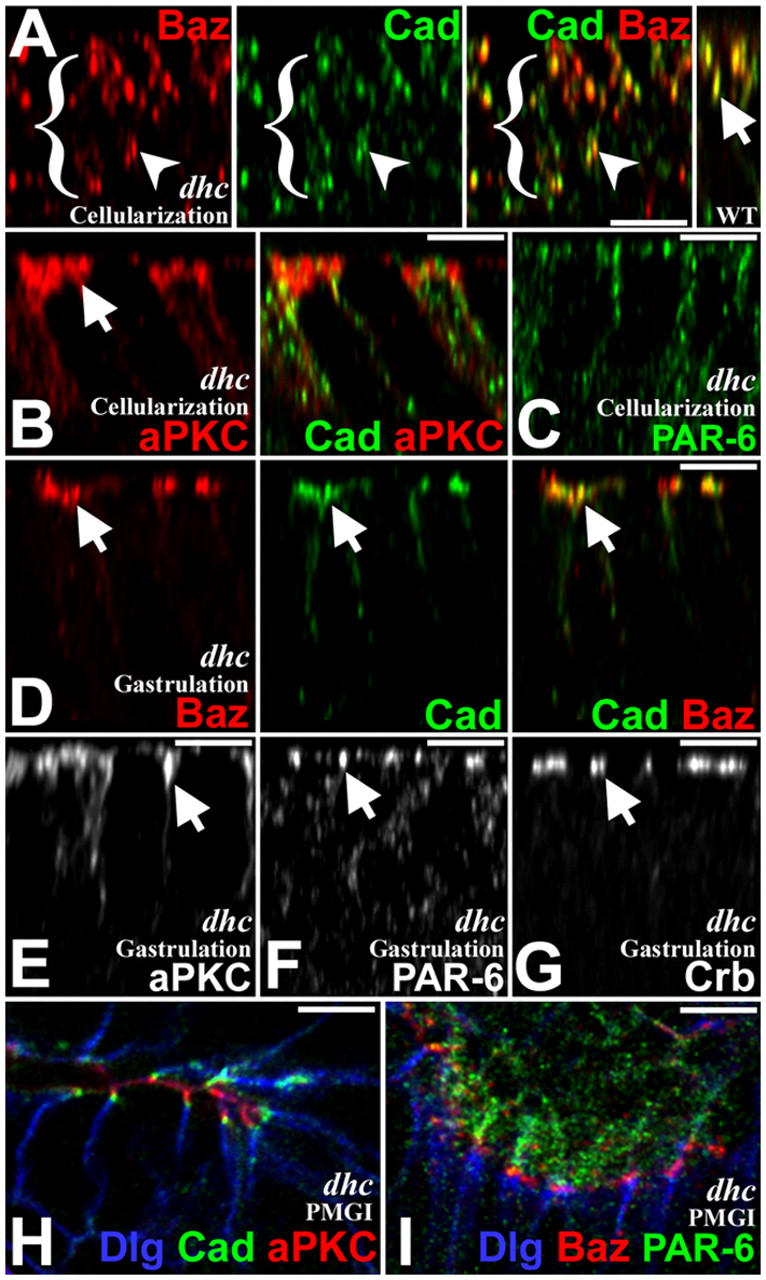
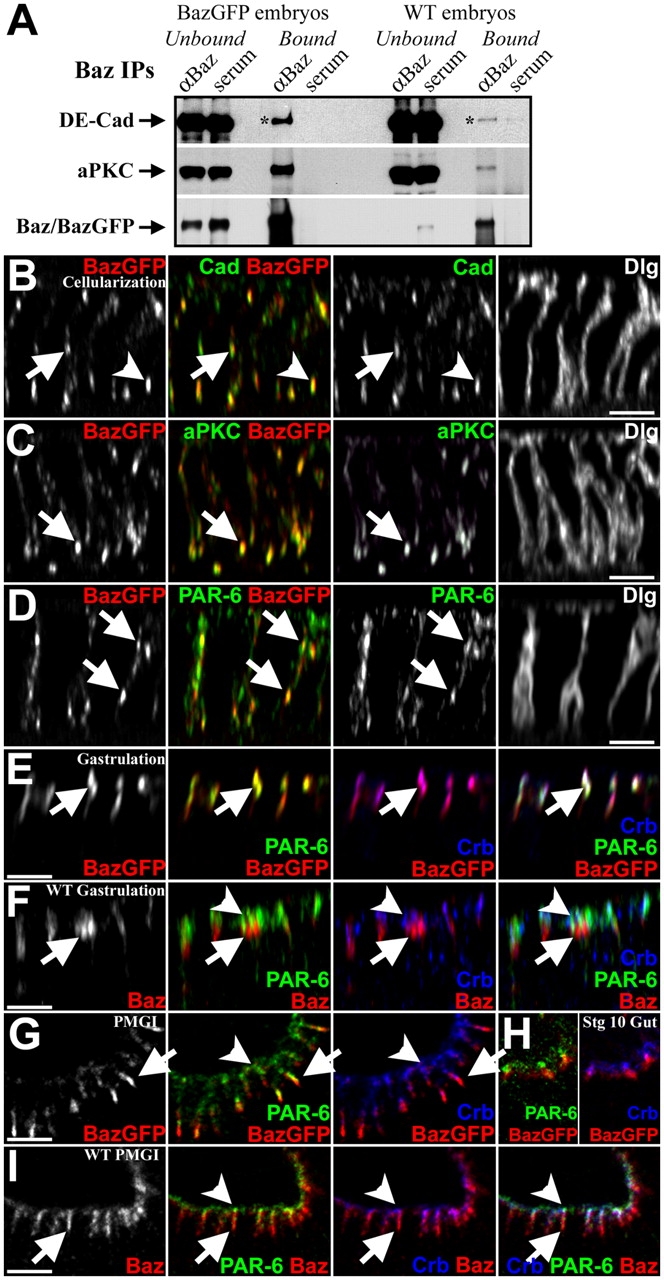
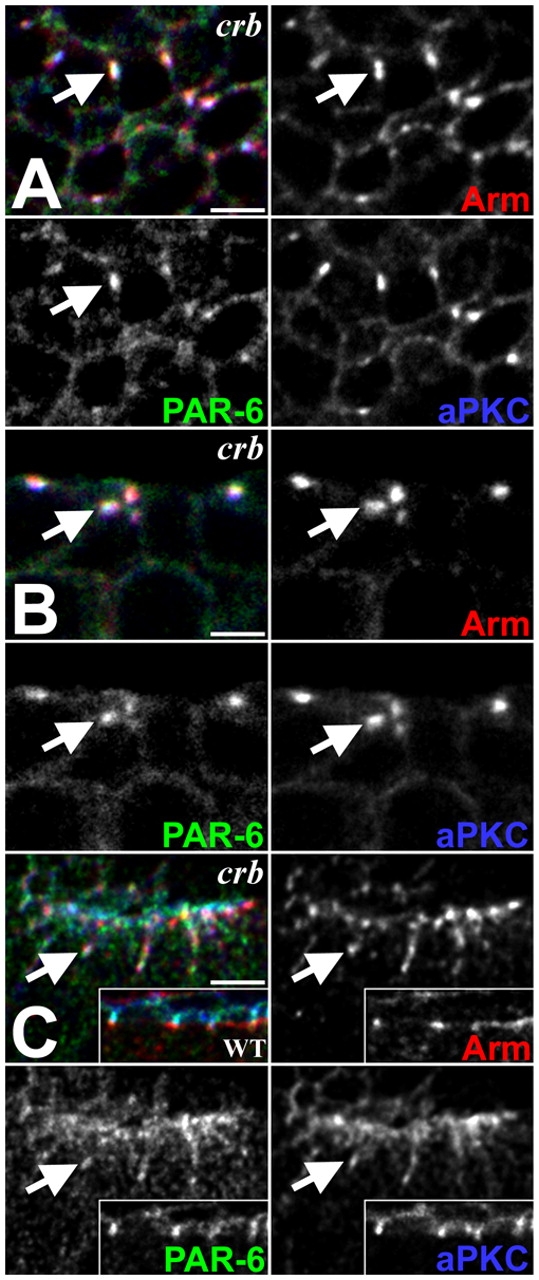
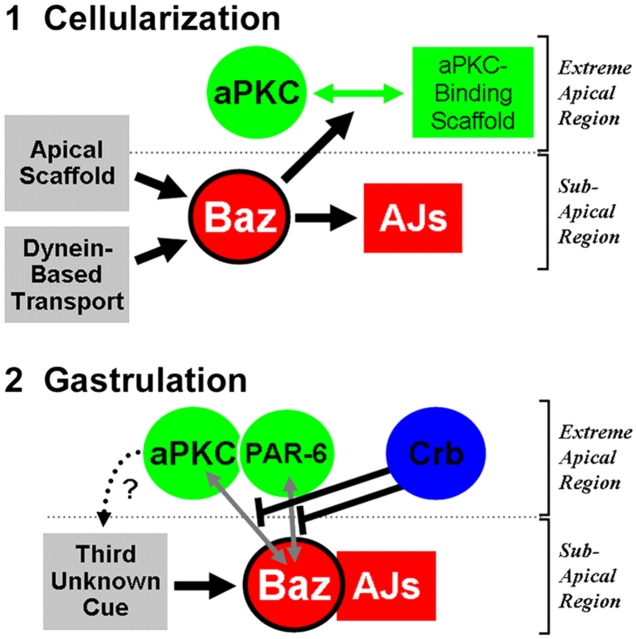
Cell polarity is critical for epithelial structure and function. Adherens junctions (AJs) often direct this polarity, but we previously found that Bazooka (Baz) acts upstream of AJs as epithelial polarity is first established in Drosophila. This prompted us to ask how Baz is positioned and how downstream polarity is elaborated. Surprisingly, we found that Baz localizes to an apical domain below its typical binding partners atypical protein kinase C (aPKC) and partitioning defective (PAR)-6 as the Drosophila epithelium first forms. In fact, Baz positioning is independent of aPKC and PAR-6 relying instead on cytoskeletal cues, including an apical scaffold and dynein-mediated basal-to-apical transport. AJ assembly is closely coupled to Baz positioning, whereas aPKC and PAR-6 are positioned separately. This forms a stratified apical domain with Baz and AJs localizing basal to aPKC and PAR-6, and we identify specific mechanisms that keep these proteins apart. These results reveal key steps in the assembly of the apical domain in Drosophila.
Overview
The claims and statistics of this paper haven’t been checked yet.
Run the check — free, no account needed. It reads the open-access text and checks the sources it cites.
Integrity signals
Registry
Cites
Statistics
Figures
Verification
Claims the paper makes
The claims and statistics of this paper haven’t been checked yet.
Run the check — free, no account needed. It reads the open-access text and checks the sources it cites.
Claims other papers make about this one
Each is checked against this paper’s own text: does it say what the citing paper says it does?
The cited source doesn’t support the claim as written.
In the citing paper
“The dynein-dependent transport of the Drosophila Par3 homolog Bazooka is required for the segregation of apically localized proteins during the establishment of epithelial polarity (Harris and Peifer, 2005).”
From Rassf5 and Ndr kinases act in a novel pathway regulating neuronal polarity through Par3 phosphorylation (2014) · cites this paper as Harris and Peifer, 2005
Checked by a reasoning model — may be wrong.
Experimental — accuracy not yet measured
Self-check
Percentages, sums and reported differences re-computed from the paper’s own numbers.
The self-check needs the paper’s full text.
Citations
Cites
Mutations affecting the pattern of the larval cuticle inDrosophila melanogaster
N�sslein-Volhard, C., Wieschaus, E. F., & Kluding, H. (1984) · Development Genes and Evolution · doi:10.1007/bf00848156 · Cited by 1,552
Etienne-Manneville, S., & Hall, A. (2001) · Cell · doi:10.1016/s0092-8674(01)00471-8 · Cited by 941
A mammalian PAR-3–PAR-6 complex implicated in Cdc42/Rac1 and aPKC signalling and cell polarity
Lin, D., Edwards, A. S., Fawcett, J. P., Mbamalu, G., Scott, J. D., & Pawson, T. (2000) · Nature Cell Biology · doi:10.1038/35019582 · Cited by 743
Adaptation of core mechanisms to generate cell polarity
Nelson, W. J. (2003) · Nature · doi:10.1038/nature01602 · Cited by 716
Munro, E., Nance, J., & Priess, J. (2004) · Developmental Cell · doi:10.1016/j.devcel.2004.08.001 · Cited by 696
Complete polarization of single intestinal epithelial cells upon activation of LKB1 by STRAD.
Baas, A., Kuipers, J., van der Wel, N. N., Batlle, E., Koerten, H., Peters, P., & Clevers, H. (2004) · Cell · doi:10.1016/s0092-8674(04)00114-x · Cited by 562
Mutations affecting the pattern of the larval cuticle inDrosophila melanogaster
Wieschaus, E. F., N�sslein-Volhard, C., & J�rgens, G. (1984) · Development Genes and Evolution · doi:10.1007/bf00848158 · Cited by 556
Epithelial Cell Polarity and Cell Junctions inDrosophila
Tepaß, U., Tanentzapf, G., Ward, R., & Fehon, R. G. (2001) · Annual Review of Genetics · doi:10.1146/annurev.genet.35.102401.091415 · Cited by 549
Par-3 controls tight junction assembly through the Rac exchange factor Tiam1
Chen, X., & Macara, I. G. (2005) · Nature Cell Biology · doi:10.1038/ncb1226 · Cited by 474
Wodarz, A., Ramrath, A., Grimm, A., & Knust, E. (2000) · The Journal of Cell Biology · doi:10.1083/jcb.150.6.1361 · Cited by 472
Cited by
Sorted by citations
Items 201–295 of 295
Sen, A., Sun, R., & Krahn, M. P. (2015) · Journal of Biological Chemistry · doi:10.1074/jbc.m114.629014 · Cited by 22
Sun, J., Macabenta, F., Ákos, Z., & Stathopoulos, A. (2020) · Genetics · doi:10.1534/genetics.120.303258 · Cited by 15
Partial Functional Diversification ofDrosophila melanogasterSeptin GenesSep2andSep5
O’Neill, R. S., & Clark, D. V. (2016) · G3 Genes Genomes Genetics · doi:10.1534/g3.116.028886 · Cited by 15
Montoyo-Rosario, J. G., Armenti, S. T., Zilberman, Y., & Nance, J. (2020) · Genetics · doi:10.1534/genetics.120.303085 · Cited by 14
Key Role for CRB2 in the Maintenance of Apicobasal Polarity in Retinal Pigment Epithelial Cells
Paniagua, A. E., Segurado, A., Dolón, J. F., Esteve-Rudd, J., Velasco, A., Williams, D. S., & Lillo, C. (2021) · Frontiers in Cell and Developmental Biology · doi:10.3389/fcell.2021.701853 · Cited by 13
Anllo, L., & Schüpbach, T. (2016) · Developmental Biology · doi:10.1016/j.ydbio.2016.04.017 · Cited by 12
Redundant regulation of localization and protein stability of DmPar3
Kullmann, L., & Krahn, M. P. (2018) · Cellular and Molecular Life Sciences · doi:10.1007/s00018-018-2792-1 · Cited by 12
Girdin is a component of the lateral polarity protein network restricting cell dissemination
Biehler, C., Wang, L., Sévigny, M., Jetté, A., Gamblin, C. L., Catterall, R., Houssin, É., McCaffrey, L. M., & Laprise, P. (2020) · PLoS Genetics · doi:10.1371/journal.pgen.1008674 · Cited by 11
Mechanochemical induction of wrinkling morphogenesis on elastic shells
Zakharov, A. P., & Dasbiswas, K. (2021) · Soft Matter · doi:10.1039/d1sm00003a · Cited by 11
Modeling mechanochemical pattern formation in elastic sheets of biological matter
Zakharov, A. P., & Dasbiswas, K. (2021) · The European Physical Journal E · doi:10.1140/epje/s10189-021-00086-x · Cited by 11
Naturale, V. F., Pickett, M., & Feldman, J. (2023) · Developmental Cell · doi:10.1016/j.devcel.2023.07.008 · Cited by 8
Adherens Junctions in Mammalian Development, Homeostasis and Disease: Lessons from Mice
Boggetti, B., & Niessen, C. M. (2012) · Sub-cellular biochemistry/Subcellular biochemistry · doi:10.1007/978-94-007-4186-7_14 · Cited by 11
Apicobasal polarity and its role in cancer progression
Lo, P., Hawrot, H., & Γεωργίου, Μ. (2012) · BioMolecular Concepts · doi:10.1515/bmc-2012-0020 · Cited by 10
Yamashita, K., Mizuno, K., Furukawa, K. T., Hirose, H., Sakurai, N., Masuda‐Hirata, M., Amano, Y., Hirose, T., Suzuki, A., & Ohno, S. (2020) · Journal of Cell Science · doi:10.1242/jcs.244830 · Cited by 9
Ying, Z., Fang, L., Du, D., Zhou, W., Feng, X., Chen, J., Zhang, Z., & Chen, Z. (2008) · Acta Biochimica et Biophysica Sinica · doi:10.1093/abbs/40.8.729 · Cited by 9
Autonomous epithelial folding induced by an intracellular mechano–polarity feedback loop
Wen, F.-L., Kwan, C. W., Wang, Y., & Shibata, T. (2021) · PLoS Computational Biology · doi:10.1371/journal.pcbi.1009614 · Cited by 8
Origin and development of primary animal epithelia
Doerr, S., Zhou, P., & Ragkousi, K. (2023) · BioEssays · doi:10.1002/bies.202300150 · Cited by 6
Phase Separation in Cell Polarity
Wei, H., & Wen, W. (2021) · Biochemistry · doi:10.1021/acs.biochem.1c00372 · Cited by 8
Schmidt, A., Finegan, T. M., Häring, M., Kong, D., Fletcher, A., Alam, Z., Grosshans, J., Wolf, F., & Peifer, M. (2023) · bioRxiv · doi:10.1091/mbc.e23-03-0077 · Cited by 8
Self-citationOhno, S., Goulas, S., & Hirose, T. (2015) · Springer eBooks · doi:10.1007/978-3-319-14463-4_1 · Cited by 10
Mishra, M., Rentsch, M., & Knust, E. (2012) · European Journal of Cell Biology · doi:10.1016/j.ejcb.2012.03.006 · Cited by 7
The Ski2-family helicase Obelus regulates Crumbs alternative splicing and cell polarity
Vichas, A., Laurie, M. T., & Zallen, J. A. (2015) · The Journal of Cell Biology · doi:10.1083/jcb.201504083 · Cited by 7
Troponin-I mediates the localization of selected apico-basal cell polarity signaling proteins
Casas‐Tintó, S., & Ferrús, A. (2019) · Journal of Cell Science · doi:10.1242/jcs.225243 · Cited by 7
Intercellular Junctions: Actin the PARt
Shen, L., & Turner, J. R. (2008) · Current Biology · doi:10.1016/j.cub.2008.10.010 · Cited by 7
Pittman, K. J., & Skop, A. R. (2012) · Cytoskeleton · doi:10.1002/cm.21053 · Cited by 6
Adherens junctions and cadherins in Drosophila development.
Letizia, A., & Llimargas, M. (2012) · Sub-cellular biochemistry · doi:10.1007/978-94-007-4186-7_11 · Cited by 6
Confinement promotes nematic alignment of spindle-shaped cells during Drosophila embryogenesis
Ray, T., Shi, D., & Harris, T. (2024) · Development · doi:10.1242/dev.202577 · Cited by 5
Self-citationGu, L., Sauceda, R., Brar, J., Fessahaye, F., Joo, M., Lee, J., Nguyen, J., Teng, M., & Weng, M. (2024) · Molecular Biology of the Cell · doi:10.1091/mbc.e24-04-0177 · Cited by 5
A novel role for retromer in the control of epithelial cell polarity
Pocha, S. M., & Wassmer, T. (2011) · Communicative & Integrative Biology · doi:10.4161/cib.17658 · Cited by 5
Dual Function of Par3 in Tumorigenesis
Lv, T., Xu, J., Yuan, H., Wang, J., & Jiang, X. (2022) · Frontiers in Oncology · doi:10.3389/fonc.2022.915957 · Cited by 5
Fehon, R. G. (2006) · Nature · doi:10.1038/nature05036 · Cited by 5
Nuf and Rip11 requirement for polarity determinant recycling duringDrosophiladevelopment
Calero-Cuenca, F. J., & Sotillos, S. (2016) · Small GTPases · doi:10.1080/21541248.2016.1235386 · Cited by 5
P ar3 in chick lens placode development
Melo, M. D. O., Borges, R. M., & Yan, C. Y. I. (2017) · genesis · doi:10.1002/dvg.23032 · Cited by 5
Axon Regeneration: Antagonistic Signaling Pairs in Neuronal Polarization
Hapak, S. M., Ghosh, S., & Rothlin, C. V. (2018) · Trends in Molecular Medicine · doi:10.1016/j.molmed.2018.05.007 · Cited by 5
The adipose tissue has an apical-basal polarity required for Col IV–dependent cell–cell adhesion
Almasoud, J., Andrieu, C., Lee, B. H., & Franz, A. (2025) · The Journal of Cell Biology · doi:10.1083/jcb.202504139 · Cited by 3
Development and Cell Polarity of the C. elegans Intestine
Bossinger, O., & Hoffm, M. (2012) · InTech eBooks · doi:10.5772/35115 · Cited by 3
RalGTPase Controls Cell Polarity Organization during Epithelial Tissue Remodeling
Belaiche, Y. (2014) · Cell & Developmental Biology · doi:10.4172/2168-9296.1000134 · Cited by 3
Establishment and Maintenance of Epithelial Polarization
Bergemann, A. D. (2020) · Physiology in health and disease · doi:10.1007/978-3-030-52780-8_3 · Cited by 3
Martín‐Belmonte, F., Bernascone, I., & Gálvez-Santisteban, M. (2015) · Elsevier eBooks · doi:10.1016/b978-0-12-394447-4.20072-2 · Cited by 3
Wetting of junctional condensates along the apical interface promotes tight junction belt formationPreprint
García, K. P., Martin-Lemaitre, C., & Honigmann, A. (2022) · bioRxiv (Cold Spring Harbor Laboratory) · doi:10.1101/2022.12.16.520750 · Cited by 3
Too old for hide-and-seek: Cell maturation reveals hidden apical junctional organization
Jensen, C. C., & Peifer, M. A. (2024) · Proceedings of the National Academy of Sciences · doi:10.1073/pnas.2401735121 · Cited by 2
Self-citationSchmidt, A., Li, L., Yan, S., & Großhans, J. (2022) · Developmental Biology · doi:10.1016/j.ydbio.2022.04.012 · Cited by 2
Cell Polarity in Drosophila Retina
Nam, S. (2013) · Springer eBooks · doi:10.1007/978-1-4614-8232-1_5 · Cited by 2
Epithelial Apicobasal Polarity in the Drosophila Embryo
Jiang, T., David, D. J. V., & Harris, T. (2015) · Springer eBooks · doi:10.1007/978-3-319-14463-4_7 · Cited by 2
Self-citationNeisch, A. L., Avery, A. W., Li, M.-G., & Hays, T. S. (2017) · Elsevier eBooks · doi:10.1016/b978-0-12-809471-6.00021-8 · Cited by 1
Cdc42 promotes epithelial morphogenesis by coupling Par-complex and Crumbs recruitment via Par6-aPKCPreprint
de Almeida, F. N., Walther, R. F., Pressé, M. T., Vlassaks, E., & Pichaud, F. (2019) · bioRxiv · doi:10.1101/513028 · Cited by 1
Martín‐Belmonte, F., Bernascone, I., & Gálvez-Santisteban, M. (2016) · Elsevier eBooks · doi:10.1016/b978-0-12-821618-7.20072-2 · Cited by 1
Almasoud, J., Andrieu, C., Lee, B. H., & Franz, A. (2025) · bioRxiv (Cold Spring Harbor Laboratory) · doi:10.1101/2025.04.17.649307 · Cited by 1
Drosophila: A Model System That Allows in vivo Manipulation and Study of Epithelial Cell Polarity
Leibfried, A., & Bellaı̈che, Y. (2012) · InTech eBooks · doi:10.5772/37120
O papel do compexo PAR durante a embriogênese do placóide do cristalino.
Melo, M. D. O. (2014) · Digital Library of Theses and Dissertations (Universidade de São Paulo) · doi:10.11606/t.42.2014.tde-25112014-110540
Morphogenesis in Drosophila melanogaster : an in vitro analysis
Scarborough, J. A. (2007) · St Andrews Research Repository (St Andrews Research Repository)
Mutational Analysis of FERM Domain Proteins CG34347 and Cdep in Drosophila
Milic, M., & Tepaß, U. (2012) · Library and Archives Canada (Government of Canada)
Development of the first vertebrate epithelium
Wei, J. (2011) · The University of Bath Online Publications Store (The University of Bath)
Functional analysis of the Drosophila gene smallish (CG43427)
Beati, S. A. H. (2013) · eDiss (Georg-August-Universität Göttingen) · doi:10.53846/goediss-4055
Characterizing the Role of RhoGAP19D in Drosophila Epithelial Development
Tak, J.-H. (2012) · TSpace (University of Toronto)
Lei, V. J. (2010) · cIRcle (University of British Columbia) · doi:10.14288/1.0069111
REGULATIONOF CELL POLARITYAND SELF-RENEWALIN DROSOPHILA NEURAL STEM CELLS
Chabu, C. Y. (2008)
Regulation of Epithelial Morphogenesis by the Drosophila Folded gastrulation Signaling Pathway
Manning, A. J. (2019) · Carolina Digital Repository (University of North Carolina at Chapel Hill) · doi:10.17615/7p4f-8e18
Schmoranzer, J., Fawcett, J. P., Segura, M., Tan, S. C., Vallee, R. B., Pawson, T. J., & Gundersen, G. G. (2009)
David, D. J. V. (2013) · TSpace (University of Toronto)
Shao, W. (2011) · TSpace (University of Toronto)
Regulation and function of actin nucleators Dia and FMNL in the early Drosophila embryo
Schmidt, A. (2018) · eDiss (Georg-August-Universität Göttingen) · doi:10.53846/goediss-7145
The early Development of the Germline in Drosophila melanogaster
Hertel, A. (2018) · eDiss (Georg-August-Universität Göttingen) · doi:10.53846/goediss-7187
Emergence of the subapical domain is associated with the midblastula transitionPreprint
Schmidt, A., & Großhans, J. (2019) · bioRxiv (Cold Spring Harbor Laboratory) · doi:10.1101/713719
Green, K. J., & Dubash, A. D. (2011) · Faculty Opinions – Post-Publication Peer Review of the Biomedical Literature · doi:10.3410/f.7099956.8661067
Lee, C. (2007) · Faculty Opinions – Post-Publication Peer Review of the Biomedical Literature · doi:10.3410/f.1090631.543929
Cell Polarity in Drosophila Retina
Nam, S. (2020) · Springer eBooks · doi:10.1007/978-3-030-42246-2_5
Macara, I. G. (2018) · Faculty Opinions – Post-Publication Peer Review of the Biomedical Literature · doi:10.3410/f.734256859.793552125
Llimargas, M. (2018) · Faculty Opinions – Post-Publication Peer Review of the Biomedical Literature · doi:10.3410/f.734256859.793552663
Abdelilah‐Seyfried, S. (2007) · Faculty Opinions – Post-Publication Peer Review of the Biomedical Literature · doi:10.3410/f.1063863.520041
Kim, S., Shahab, J., Vogelsang, E., & Wodarz, A. (2024) · Biology Open · doi:10.1242/bio.060544
Daley, W. P. (2011) · Scholars Archive - University at Albany (University at Albany, State University of New York) · doi:10.54014/21qw-pabd
Mahadevan, T., Figard, L., Seede, H., Sehgal, P., Geng, Y., McDonald, K., Golding, I., & Sokac, A. M. (2025) · bioRxiv (Cold Spring Harbor Laboratory) · doi:10.1101/2025.07.29.667534
Babu, A. P., Muralidharan, S., Kogan, K., Kotila, T., Hietakangas, V., Mattila, J., & Poukkula, M. (2025) · bioRxiv (Cold Spring Harbor Laboratory) · doi:10.1101/2025.09.12.675872
ProTrack3D: a comprehensive tool for segmentation and tracking of proteins with split and fusion
Gautam, R., Jiao, Y., Pang, Y., Weng, M., & Yang, M. (2025) · BMC Bioinformatics · doi:10.1186/s12859-025-06307-w
Mapping Subcellular Forces Controlling Morphogenesis
Rauzi, M. (2010) · theses.fr (ABES) · doi:10.70675/6761117eza93fz432eza7b4z014a2ab8fc5c
Cell polarity in hepatic cells physiopathology
Akkari, L. (2010) · theses.fr (ABES) · doi:10.70675/50d0b5fez8356z488fzb2b0z029ae5e17d3a
Role of crumbs and bazooka in the organization and distribution of DE-cadherin in Drosophila embryo
Aksenova, V. (2017) · theses.fr (ABES) · doi:10.70675/5067594bzfce9z45acz9961zbfc33be662bd
Studying the formation of tricellular junction upon epithelial cell division in Drosophila
Wang, Z. (2017) · theses.fr (ABES) · doi:10.70675/7bf64dc6z7648z4185zbce1z11f7ddf7ee90
Planar polarization of a mono-ciliated epithelium : the zebrafish floor-plate
Donati, A. (2019) · theses.fr (ABES) · doi:10.70675/acc1a95cz8229z4c8dz98a0zb840ff0fb208
Roles of bi and tricellular junctions in the homeostasis of the Drosophila melanogaster notum
de Bournonville, T. E. (2021) · theses.fr (ABES) · doi:10.70675/d7d07b1azf46cz4c38z927fz53a35c50f01d
Study of septin 9 in the cell polarity and development of cholangiocarcinoma
Cai, T. (2022) · theses.fr (ABES) · doi:10.70675/c3888784z575bz4056z8b60z98cb8e7e8719
Opposing actomyosin pools establish epithelial polarity during naive pluripotency exit
Shi, Y., Manzi, N. I., Grater, N., Kopparapu, N., Ohler, L. S., de Jesus, B. N., & Dickinson, D. J. (2026) · The Journal of Cell Biology · doi:10.1083/jcb.202408198
aPKC exclusion from the apical cortex in enteroblasts maintains stem cell homeostasis in Drosophila
Izumi, Y., & Furuse, M. (2026) · The Journal of Cell Biology · doi:10.1083/jcb.202509240
Nayak, A. P., & Glotzer, M. (2026) · bioRxiv (Cold Spring Harbor Laboratory) · doi:10.64898/2026.09.21.753314
Cell and nuclear scaling constrains tissue fluidity in a doubly-dense remodeling epithelium
Russell, L. J., Budhathoki, R., Weber, H. D., Loerke, D., & Blankenship, J. T. (2026) · Development · doi:10.1242/dev.205317
Metadata
- Authors
- Harris, T. J. C., & Peifer, M.
- Affiliations
- University of North Carolina at Chapel Hill (US)
- Corresponding author
- Peifer, Mark
- Venue
- The Journal of Cell Biology
- Publisher
- Rockefeller University Press
- Published
- 2005-08-29
- Volume
- 170
- Issue
- 5
- Pages
- 813-823
- ISSN
- 0021-9525 (ISSN-L)
- 1540-8140
- PMC
- PMC2171335
- OpenAlex
- W2089839677
- Cited by
- 295
- References
- 44
- Citations by year
- 2026: 5 · 2025: 5 · 2024: 5 · 2023: 5 · 2022: 13 · 2021: 12 · 2020: 13 · 2019: 16 · 2018: 12 · 2017: 20 · 2016: 13 · 2015: 16 · 2014: 10 · 2013: 13 · 2012: 24
- FWCI
- 6.80
- Type
- journal article
- Language
- en
- Open access
- green
- www.ncbi.nlm.nih.gov
- Licence
- cc-by-nc-sa
- Locations
- The Journal of Cell Biology (publishedVersion)
- PubMed Central (publishedVersion, cc-by-nc-sa)
- PubMed (publishedVersion)
- OSTI OAI (U.S. Department of Energy Office of Scientific and Technical Information) (submittedVersion)
- Carolina Digital Repository (University of North Carolina at Chapel Hill) (submittedVersion)
- UNC Libraries
- Funders
- National Institutes of Health
- Canadian Institutes of Health Research
- Natural Sciences and Engineering Research Council of Canada
- National Institute of General Medical Sciences (GM-47857, R01GM047857)
- Topics
- Life Sciences › Biochemistry, Genetics and Molecular Biology › Molecular Biology › Developmental Biology and Gene Regulation
- Life Sciences › Biochemistry, Genetics and Molecular Biology › Cell Biology › Cellular Mechanics and Interactions
- Life Sciences › Biochemistry, Genetics and Molecular Biology › Cell Biology › Hippo pathway signaling and YAP/TAZ
- Keywords
- epithelial polarity, Bazooka, adherens junctions, apical domain, atypical protein kinase C, Par6, protein segregation
- MeSH terms
- Actins, Animals, Cytoskeleton, Drosophila melanogaster, Dyneins, Epithelial Cells, Membrane Proteins, Microtubules, Protein Kinase C, Proteins, Recombinant Fusion Proteins, Body Patterning, Protein Transport, Adherens Junctions, Drosophila Proteins, Intracellular Signaling Peptides and Proteins
About these checks
Registry, retraction, Cites and statistics results are computed, not judged, with one exception: a printed reference that no index lists is read once by a model before it counts as a citation error. Claims are extracted by a model and kept only when their quote appears verbatim in the text; each cited source is then checked, with a model’s help, for whether it says what the claim relies on. Those verdicts can be wrong — read the claim’s quote and the cited source before relying on one.
Statistics and arithmetic are recomputed, not judged.
Confidence bands are shown only for fields calibrated on our annotated test set. None is calibrated yet, so no band is shown.
What counts as a claim ›How we measure confidence ›How we check this ›
Are you an author, or do you see a problem with this page? Request a review
