

The DOI matches its Crossref record; 30 of the 30 references it cites were found in a registry or an index.
Autophagosomes initiate distally and mature during transport toward the cell soma in primary neurons
Open accessAbstract
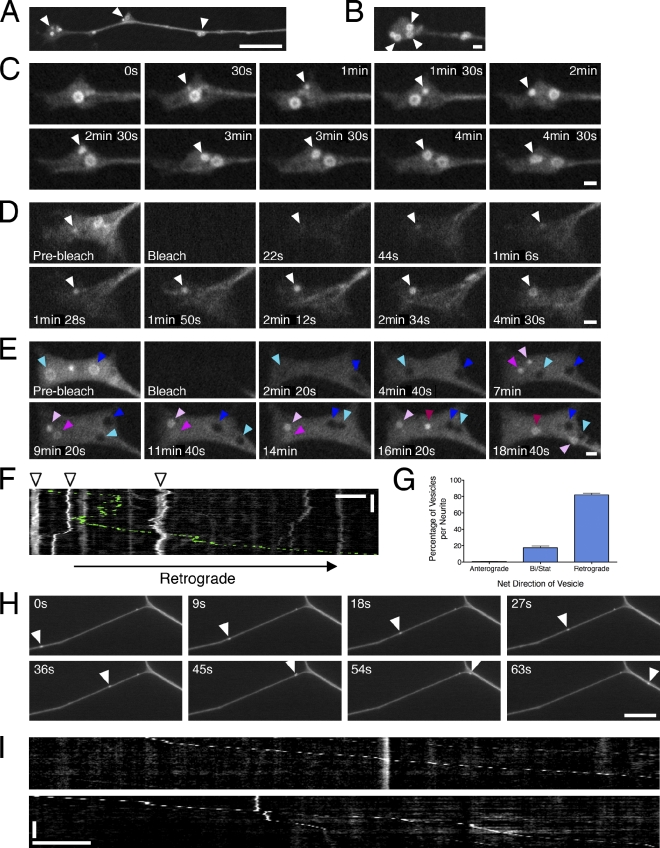
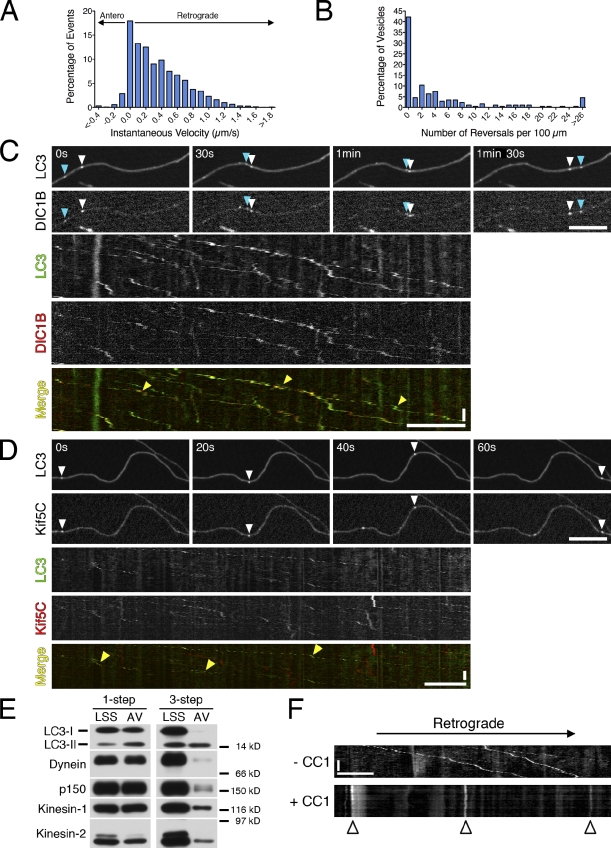
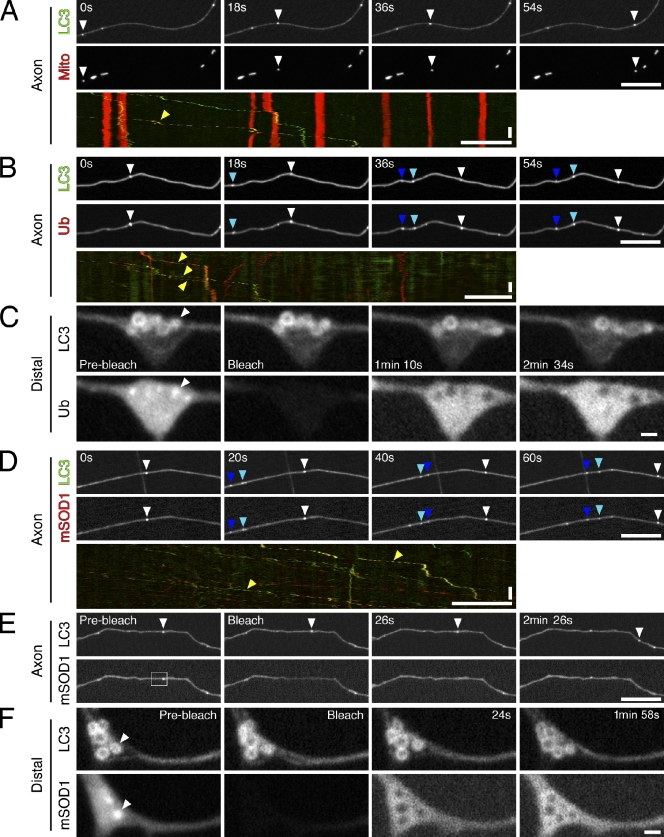
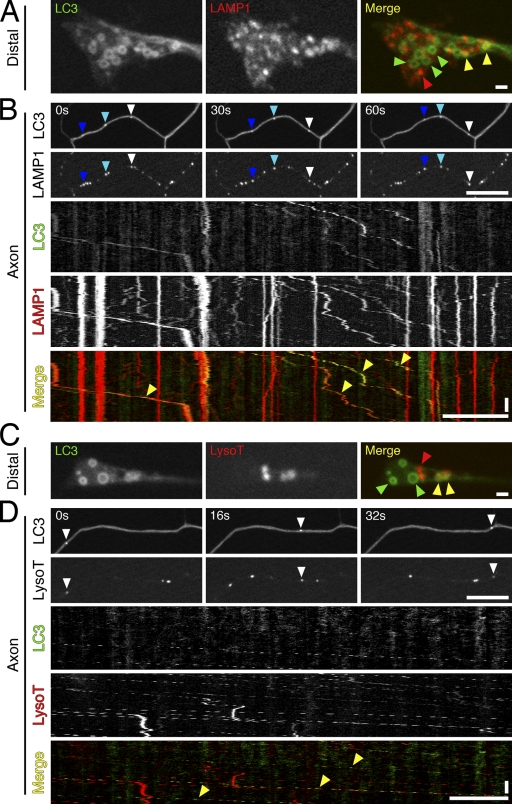
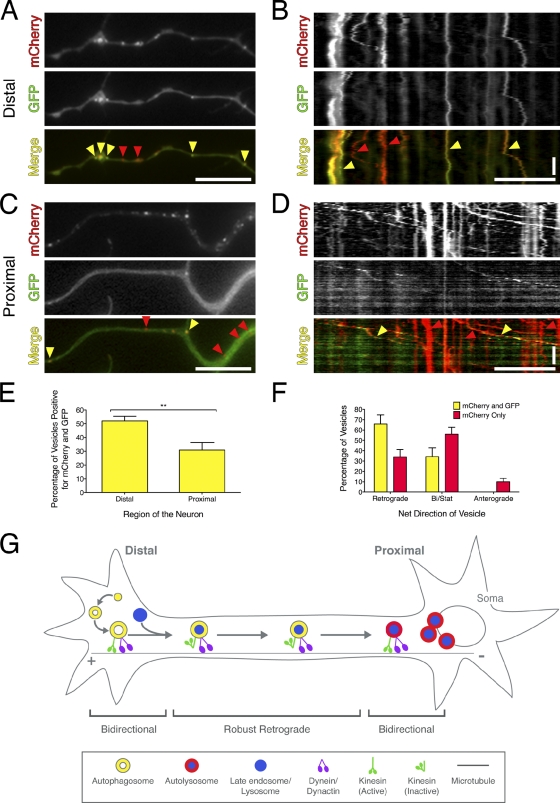
Autophagy is an essential cellular degradation pathway in neurons; defects in autophagy are sufficient to induce neurodegeneration. In this paper, we investigate autophagosome dynamics in primary dorsal root ganglion neurons. Autophagosome biogenesis occurs distally in a constitutive process at the neurite tip. Autophagosomes initially move bidirectionally and then switch to unidirectional, processive movement toward the cell soma driven by dynein. Autophagosomes copurify with anterograde and retrograde motors, suggesting that the activity of bound kinesin motors is effectively down-regulated to yield robust retrograde motility driven by dynein. Both organelle and soluble cargoes are internalized into autophagosomes, including mitochondria and ubiquitin. As autophagosomes move distally to proximally, they undergo maturation and become increasingly acidified, consistent with the formation of an autolysosomal compartment that may more efficiently degrade cargo. This maturation is accompanied by a switch to bidirectional motility characteristic of lysosomes. Together, autophagosome biogenesis and maturation in primary neurons is a constitutive process that is spatially and temporally regulated along the axon.
Overview
The claims and statistics of this paper haven’t been checked yet.
Run the check — free, no account needed. It reads the open-access text and checks the sources it cites.
Integrity signals
Registry
Cites
Statistics
Figures
Verification
Claims the paper makes
The claims and statistics of this paper haven’t been checked yet.
Run the check — free, no account needed. It reads the open-access text and checks the sources it cites.
Claims other papers make about this one
Each is checked against this paper’s own text: does it say what the citing paper says it does?
The source backs part of the claim, not all of it — or backs it for a different population, condition or comparison.
In the citing paper
“Lysosomes fuse with autophagosome in the distal axon, and they mature on the way back to the soma (Maday et al., 2012).”
From TMEM55B promotes anterograde transport and distal axonal distribution of LAMP1-positive organelles (2026) · cites this paper as Maday et al., 2012
Experimental — accuracy not yet measuredThe cited source says what the claim attributes to it.
In the citing paper
“Autophagosome trafficking along axons was recently described.31”
From Measurement of autophagy flux in the nervous system in vivo (2013) · cites this paper as [31]
The cited source says what the claim attributes to it.
In the citing paper
“Remarkably, the velocities obtained were in the same order of magnitude to the ones recently reported for autophagosomes in axons of DRGs obtained from LC3-GFP transgenic mice.31”
From Measurement of autophagy flux in the nervous system in vivo (2013) · cites this paper as [31]
In the citing paper
“Newly-formed autophagosomes in neuronal processes undergo retrograde transport to the soma and proximal segments of neurites to fuse with somatodendritic lysosomes for cargo degradation, with maturation and acidification of the autophagosomal lumen developing en passant [370,372,374].”
From Autophagy and ALS: mechanistic insights and therapeutic implications (2022) · cites this paper as [372]
In the citing paper
“Autophagy initiation typically begins outside of the soma, in the distal axon tip [370,372,373].”
From Autophagy and ALS: mechanistic insights and therapeutic implications (2022) · cites this paper as [372]
In the citing paper
“Bidirectional movements have been reported for a variety of organelles and vesicles (Welte, 2004), including even those that move persistently in one direction, such as mitochondria (Saxton and Hollenbeck, 2012), autophagosomes (Maday et al., 2012), and vesicles (Encalada et al., 2011), as they undergo axonal transport.”
From Microtubule motors transport phagosomes in the RPE, and lack of KLC1 leads to AMD-like pathogenesis (2015) · cites this paper as Maday et al., 2012
In the citing paper
“puncta may be numerous in neurites, especially within dystrophic swellings and, in many cases, these vacuoles are amphisomes or autolysosomes, reflecting the delayed or inhibited degradation of LC3 despite the presence of abundant hydrolase activity [77,84].”
From Guidelines for the use and interpretation of assays for monitoring autophagy (4th edition) 1 (2021) · cites this paper as [84]
Self-check
Percentages, sums and reported differences re-computed from the paper’s own numbers.
The self-check needs the paper’s full text.
Citations
Cites
Autophagy fights disease through cellular self-digestion
Mizushima, N., Levine, B., Cuervo, A. M., & Klionsky, D. J. (2008) · Nature · doi:10.1038/nature06639 · Cited by 6,452
Pankiv, S., Clausen, T. H., Lamark, T., Brech, A., Bruun, J.-A., Outzen, H., Øvervatn, A., Bjørkøy, G., & Johansen, T. (2007) · Journal of Biological Chemistry · doi:10.1074/jbc.m702824200 · Cited by 4,578
Motor Neuron Degeneration in Mice that Express a Human Cu,Zn Superoxide Dismutase Mutation
Gurney, M. E., Pu, H., Chiu, A. Y., Dal Canto, M. C., Polchow, C. Y., Alexander, D. D., Caliendo, J., Hentati, A., Kwon, Y. W., Deng, H.-X., et al. (1994) · Science · doi:10.1126/science.8209258 · Cited by 4,143
Parkin is recruited selectively to impaired mitochondria and promotes their autophagy
Narendra, D., Tanaka, A., Suen, D.-F., & Youle, R. J. (2008) · The Journal of Cell Biology · doi:10.1083/jcb.200809125 · Cited by 4,026
Suppression of basal autophagy in neural cells causes neurodegenerative disease in mice
Hara, T., Nakamura, K., Matsui, M., Yamamoto, A., Nakahara, Y., Suzuki-Migishima, R., Yokoyama, M., Mishima, K., Saito, I., Okano, H., et al. (2006) · Nature · doi:10.1038/nature04724 · Cited by 3,882
Loss of autophagy in the central nervous system causes neurodegeneration in mice
Komatsu, M., Waguri, S., Chiba, T., Murata, S., Iwata, J.-I., Tanida, I., Ueno, T., Koike, M., Uchiyama, Y., Kominami, E., et al. (2006) · Nature · doi:10.1038/nature04723 · Cited by 3,500
Autophagosome formation: core machinery and adaptations
Xie, Z., & Klionsky, D. J. (2007) · Nature Cell Biology · doi:10.1038/ncb1007-1102 · Cited by 2,237
Mizushima, N., Yamamoto, A., Matsui, M., Yoshimori, T., & Ohsumi, Y. (2004) · Molecular Biology of the Cell · doi:10.1091/mbc.e03-09-0704 · Cited by 2,105
Mitochondria Supply Membranes for Autophagosome Biogenesis during Starvation
Hailey, D. W., Rambold, A. S., Satpute‐Krishnan, P., Mitra, K., Sougrat, R., Kim, P. K., & Lippincott‐Schwartz, J. (2010) · Cell · doi:10.1016/j.cell.2010.04.009 · Cited by 1,491
A subdomain of the endoplasmic reticulum forms a cradle for autophagosome formation
Hayashi-Nishino, M., Fujita, N., Noda, T., Yamaguchi, A., Yoshimori, T., & Yamamoto, A. (2009) · Nature Cell Biology · doi:10.1038/ncb1991 · Cited by 1,083
Cited by
Sorted by citations
Items 301–400 of 681
Kymolyzer, a Semi‐Autonomous Kymography Tool to Analyze Intracellular Motility
Basu, H., Ding, L., Pekkurnaz, G., Cronin, M., & Schwarz, T. L. (2020) · Current Protocols in Cell Biology · doi:10.1002/cpcb.107 · Cited by 29
“…cargo trafficking in a diverse array of biological samples where movement occurs along a defined axis, such as in neuronal axons and dendrites (Maday, Wallace, & Holzbaur, 2012; Pekkurnaz et al., 2014; Rangaraju, Lauterbach, & Schuman, 2019; Wang & Schwarz, 2009) and in other extended…”
BackgroundAluminum neurotoxicity and autophagy: a mechanistic view
Makhdoomi, S., Ariafar, S., Mirzaei, F., & Mohammadi, M. (2022) · Neurological Research · doi:10.1080/01616412.2022.2132727 · Cited by 29
“during retrograde movement along axons to cell somas [87].”
BackgroundSaffari, A., Brechmann, B., Böger, C., Saber, W. A., Jumo, H., Whye, D., Wood, D., Wahlster, L., Alecu, J. E., Ziegler, M., et al. (2024) · Nature Communications · doi:10.1038/s41467-023-44264-1 · Cited by 32
Aging Differentially Affects Axonal Autophagosome Formation and Maturation
Tsong, H., Holzbaur, E. L. F., & Stavoe, A. K. (2023) · Autophagy · doi:10.1080/15548627.2023.2236485 · Cited by 31
“Cg-Tg(CAG-EGFP/LC3)53 Nmi/ NmiRbrc transgenic mice [15,16,27,29], while the mCh-eGFP-LC3B tandem probe was transiently transfected into DRG neurons after isolation.”
BackgroundMethodInfluentialSelf-citationWu, T., He, K., Zhan, Q., Ang, S., Ying, J., Zhang, S., Zhang, T., Xue, Y., Chen, Y., & Tang, M. X. (2015) · Toxicology Research · doi:10.1039/c5tx00127g · Cited by 28
Myotubularin-related phosphatase 5 is a critical determinant of autophagy in neurons
Chua, J. P., Bedi, K., Paulsen, M. T., Ljungman, M. E., Tank, E. M. H., Kim, E. S., McBride, J. P., Colon, J., Ward, M. E., Weisman, L. S., et al. (2022) · Current Biology · doi:10.1016/j.cub.2022.04.053 · Cited by 28
McLinden, K. A. (2012) · Brain Disorders & Therapy · doi:10.4172/2168-975x.s1-001 · Cited by 30
Boecker, C. A., & Holzbaur, E. L. F. (2019) · Current Opinion in Neurobiology · doi:10.1016/j.conb.2019.01.005 · Cited by 26
“These findings suggest that a subset of endosomal cargo is degraded locally in the distal axon, in contrast to autophagic cargos which have been shown to be transported back to the cell soma, maturing en route to autophagolyosomes competent to degrade cargos [12,16].”
BackgroundInfluentialSelf-citationvon Kleist, L., Ariunbat, K., Braren, I., Stauber, T., Storch, S., & Danyukova, T. (2018) · Molecular Genetics and Metabolism · doi:10.1016/j.ymgme.2018.09.009 · Cited by 27
Macroautophagy and Mitophagy in Neurodegenerative Disorders: Focus on Therapeutic Interventions
Magalhães, J. D., Fão, L., Vilaça, R., Cardoso, S. M., & Rego, A. C. (2021) · Biomedicines · doi:10.3390/biomedicines9111625 · Cited by 29
“The autophagosomes derived from distal axons contain cytoplasmic content, and at least 10% of the population contains fragments of mitochondria [62], supporting a role for autophagy-dependent degradation of mitochondria.”
BackgroundDynein and dynactin move long-range but are delivered separately to the axon tip
Fellows, A. D., Bruntraeger, M. B., Burgold, T., Bassett, A. R., & Carter, A. P. (2024) · The Journal of Cell Biology · doi:10.1083/jcb.202309084 · Cited by 27
Disruption in the autophagic process underlies the sensory neuropathy indystonia musculorummice
Ferrier, A., Repentigny, Y. D., Lynch‐Godrei, A., Gibeault, S., Eid, W., Kuo, D. Z., Zha, X., & Kothary, R. (2015) · Autophagy · doi:10.1080/15548627.2015.1052207 · Cited by 27
“This dependence on the cytoskeleton is because autophagosomes form distally in the axon and are transported in a retrograde manner toward the soma in order to fuse with lysosomes.(17) Indeed, perturbing the stability of MTs or motor protein function disrupts autophagic flux,(18-20) which in turn can lead to the demise…”
BackgroundHow neurons maintain their axons long-term: an integrated view of axon biology and pathology
Smith, G. A., Sweeney, S. T., O’Kane, C. J., & Prokop, A. (2023) · Frontiers in Neuroscience · doi:10.3389/fnins.2023.1236815 · Cited by 28
Prelysosomal Compartments in the Unconventional Secretion of Amyloidogenic Seeds
Madsen, H. B., & Vilhardt, F. (2017) · International Journal of Molecular Sciences · doi:10.3390/ijms18010227 · Cited by 26
“Autophagosomes are decorated with both kinesin and dynein motors indicating that either motor can be silenced for vectorial transport [156].”
BackgroundAutophagy and Redox Homeostasis in Parkinson’s: A Crucial Balancing Act
Jiménez-Moreno, N., & Lane, J. D. (2020) · Oxidative Medicine and Cellular Longevity · doi:10.1155/2020/8865611 · Cited by 26
“For example, in neurons of the dorsal root ganglia (DRG), autophagy is triggered almost exclusively at the distal tip, whereas in hippocampal primary neurons, it can be initiated in the cell body, dendrites, and axonal regions proximal to the cell body [111, 112].”
BackgroundOptineurin defects cause TDP43-pathology with autophagic vacuolar formation
Kurashige, T., Kuramochi, M., Ohsawa, R., Yamashita, Y., Shioi, G., Morino, H., Kamada, M., Ayaki, T., Ito, H., Sotomaru, Y., et al. (2020) · Neurobiology of Disease · doi:10.1016/j.nbd.2020.105215 · Cited by 27
Aberrant Stress Granule Dynamics and Aggrephagy in ALS Pathogenesis
Zhang, Y., Gu, J., & Sun, Q. (2021) · Cells · doi:10.3390/cells10092247 · Cited by 28
“Mutant SOD1 aggregates can be recognized by p62 and targeted for autophagic deg‐ radation [36,37].”
BackgroundRetrograde Axonal Autophagy and Endocytic Pathways Are Parallel and Separate in Neurons
Kulkarni, V. V., Stempel, M. H., Anand, A., Sidibe, D. K., & Maday, S. (2022) · Journal of Neuroscience · doi:10.1523/jneurosci.1292-22.2022 · Cited by 28
Self-citationRint1 inactivation triggers genomic instability, ER stress and autophagy inhibition in the brain
Grigaravičius, P., Kaminska, E. K., Hübner, C. A., McKinnon, P. J., von Deimling, A., & Frappart, P. (2015) · Cell Death and Differentiation · doi:10.1038/cdd.2015.113 · Cited by 25
“In the neurons, autophagosomes formed in distal axons mature and fuse with late endosomes and/or lysosomes during transport towards the cell soma.(66) It was shown that disruption of autophagosome transport on microtubules by vinblastin led to the inhibition of autophagosome and lysosome fusion and to accumulation of…”
BackgroundDo we age because we have mitochondria?
Bereiter‐Hahn, J. (2013) · PROTOPLASMA · doi:10.1007/s00709-013-0515-x · Cited by 25
Lysosomes relax in the cellular suburbs
Gowrishankar, S., & Ferguson, S. M. (2016) · The Journal of Cell Biology · doi:10.1083/jcb.201602082 · Cited by 25
“Other sorting receptors such as sortilin, lipoprotein receptors, and LIMP2 (also known as SCA RB2) have been implicated in M6PR-independent sorting of lysosomal hydrolases (Reczek et al., 2007; Markmann et al., 2015).”
BackgroundJeon, D., Kim, S.-W., & Kim, H. S. (2019) · Animal Cells and Systems · doi:10.1080/19768354.2019.1588163 · Cited by 26
“*p < 0.05; **p < 0.01. et al. 2013) because Rab7 designates the maturation of endosomes and autophagosomes (Maday et al. 2012, Hyttinen et al. 2013) and participates in the fusion step with lysosomes (Agola et al. 2012).”
BackgroundInfluentialJia, N., Ganesan, D., Guan, H., Jeong, Y. Y., Han, S., Rajapaksha, G., Nissenbaum, M., Kusnecov, A. W., & Cai, Q. (2024) · Autophagy · doi:10.1080/15548627.2024.2392408 · Cited by 27
“Second, studies by us and others have established that newly formed AVs rapidly fuse with RAB7-associated late endosomes to form amphisomes, enabling retrograde transport of AVs toward the soma for cargo clearance within lysosomes [15,18,20,78].”
Tempes, A., Węsławski, J., Brzozowska, A., & Jaworski, J. (2020) · Journal of Neurochemistry · doi:10.1111/jnc.15010 · Cited by 24
Cocaine-induced locomotor stimulation involves autophagic degradation of the dopamine transporter
Harraz, M. M., Guha, P., Kang, I. G., Semenza, E. R., Malla, A. P., Song, Y. J., Reilly, L., Treisman, I., Cortés, P., Coggiano, M. A., et al. (2021) · Molecular Psychiatry · doi:10.1038/s41380-020-00978-y · Cited by 24
Majumder, P., Edmison, D., Rodger, C. E., Patel, S., Reid, E., & Gowrishankar, S. (2022) · Molecular Biology of the Cell · doi:10.1091/mbc.e21-09-0473 · Cited by 25
“We speculate that this arises from gradual accumulation of immature axonal autophagosomes which depend on the fusion with and retrograde transport of axonal LAMP1-positive organelles for their clearance (Maday et al. , 2012; Cheng et al. , 2015).”
The active zone protein Clarinet regulates synaptic sorting of ATG-9 and presynaptic autophagy
Zhao, X., Yang, S., Kargbo-Hill, S. E., Clark, B., Manning, L., & Colón‐Ramos, D. A. (2023) · PLoS Biology · doi:10.1371/journal.pbio.3002030 · Cited by 26
Kulkarni, A., Khan, Y., & Ray, K. (2016) · The FASEB Journal · doi:10.1096/fj.201600759rrr · Cited by 23
“Thebidirectional GPAC-AChEmovements resembled those of earlyphagosomes at the cell periphery (34) that were attributed to the kinesin-1 and multiple Dynein motors (35).”
BackgroundLuis-Ravelo, D., Estévez-Silva, H. M., Barroso‐Chinea, P., Afonso‐Oramas, D., Salas-Hernández, J., Rodríguez-Núñez, J., Acevedo‐Arozena, A., Marcellino, D. J., & González‐Hernández, T. (2017) · Experimental Neurology · doi:10.1016/j.expneurol.2017.10.019 · Cited by 23
Autophagy at synapses in neurodegenerative diseases
Lee, W., & Kim, S. H. (2019) · Archives of Pharmacal Research · doi:10.1007/s12272-019-01148-7 · Cited by 23
The Role of LRRK2 in Intracellular Organelle Dynamics
Boecker, C. A. (2023) · Journal of Molecular Biology · doi:10.1016/j.jmb.2023.167998 · Cited by 24
Oetjen, S., Kuhl, D., & Hermey, G. (2016) · Journal of Neurochemistry · doi:10.1111/jnc.13744 · Cited by 22
The challenges of axon survival: Introduction to the special issue on axonal degeneration
Coleman, M. P. (2013) · Experimental Neurology · doi:10.1016/j.expneurol.2013.06.007 · Cited by 22
“For one cargo at least, axonal mitochondria, a small percentage of which traffic along axons, this transport disruption is separable from the disease process (Marinkovic et al., 2012).”
Ebrahimi‐Fakhari, D., Alecu, J. E., Brechmann, B., ZIEGLER, M. L., Eberhardt, K., Jumo, H., D’Amore, A., Habibzadeh, P., Faghihi, M. A., Bleecker, J. D., et al. (2021) · Brain Communications · doi:10.1093/braincomms/fcab221 · Cited by 22
Jiménez-Moreno, N., Stathakos, P., Caldwell, M. A., & Lane, J. D. (2017) · Cells · doi:10.3390/cells6030024 · Cited by 22
“Additional considerations are needed when applying these parameters to neurons in culture, due to the spatial separation between peripherally-assembled autophagosomes and the lysosomal population, and the complex autophagosome assembly and transport-coupled maturation itinerary in these cells [77].”
BackgroundLu, J., Florio, D. N. D., Boya, P., Maday, S., Springer, W., & Chu, C. T. (2025) · Autophagy · doi:10.1080/15548627.2025.2581217 · Cited by 22
“Following formation, autophagosomes undergo directed dynein-mediated transport to the soma [53,54,58–60].”
Self-citationChoreographing the motor-driven endosomal dance
Jongsma, M. L. M., Bakker, N., & Neefjes, J. (2022) · Journal of Cell Science · doi:10.1242/jcs.259689 · Cited by 25
Mitophagy and long-term neuronal homeostasis
Markaki, M., Tsagkari, D., & Tavernarakis, N. (2023) · Journal of Cell Science · doi:10.1242/jcs.260638 · Cited by 22
HIV-associated neurodegeneration: exploitation of the neuronal cytoskeleton
Wenzel, E. D., Avdoshina, V., & Mocchetti, I. (2019) · Journal of NeuroVirology · doi:10.1007/s13365-019-00737-y · Cited by 21
“In neurons, autophagy is slightly different from that in other cells because autophagosomes are formed at the neurite tip and undergo dynein-mediated retrograde transport to their site of functionality, the soma (Maday et al. 2012).”
BackgroundThe Autophagosomes Containing Dengue Virus Proteins and Full-Length Genomic RNA Are Infectious
Wu, S., Chen, Y., Lee, Y., Lin, C., Lan, S., Lan, K.-Y., Chu, M., Lin, P., Yang, Z.-L., Chen, Y., et al. (2021) · Viruses · doi:10.3390/v13102034 · Cited by 22
Mitochondrial damage triggers the concerted degradation of negative regulators of neuronal autophagy
Basak, B., & Holzbaur, E. L. F. (2025) · Nature Communications · doi:10.1038/s41467-025-62379-5 · Cited by 22
“The autop-hagosome matures as it traf fi cs retrogradely to the soma where its fuses with the acidic lysosome to mediate degradation of its cargo 9,11 .”
Self-citationβ-arrestin1 promotes tauopathy by transducing GPCR signaling, disrupting microtubules and autophagy
Woo, J. A., Yan, Y., Kee, T. R., Cazzaro, S., Percy, K. C. M., Wang, X., Liu, T., Liggett, S. B., & Kang, D. E. (2021) · Life Science Alliance · doi:10.26508/lsa.202101183 · Cited by 20
“…not alter tau mRNA but increases tau protein stability, we initially focused on the p62-LC3 autophagy machinery because microtubule-based transport facilitates the coming together of p62-bound cargo with LC3+ autophagosomes (Lee et al, 2011; Maday et al, 2012; Cheng et al, 2015; Wang et al, 2015).”
BackgroundMINFLUX reveals dynein stepping in live neurons
Schleske, J. M., Hubrich, J., Wirth, J. O., D’Este, E., Engelhardt, J., & Hell, S. W. (2024) · Proceedings of the National Academy of Sciences · doi:10.1073/pnas.2412241121 · Cited by 17
“Therefore, not only unidirectional but also bidirectional cargo movement has often been observed (21, 38, 40, 42).”
Alteration of Dynein Function Affects α-Synuclein Degradation via the Autophagosome-Lysosome Pathway
Li, D., Shi, J., Mao, C., Liu, S., Wang, J.-D., Chen, J., Wang, F., Yang, Y., Hu, W., Hu, L., et al. (2013) · International Journal of Molecular Sciences · doi:10.3390/ijms141224242 · Cited by 20
“In this maturation and fusion progress, dynein and kinesin are also involved [12].”
BackgroundXiong, W., Wei, W., Qi, Y., Du, Z., Qu, T., Liu, K., & Gong, S. (2020) · Neuroscience · doi:10.1016/j.neuroscience.2020.01.032 · Cited by 20
Optimizing mitochondrial maintenance in extended neuronal projections
Agrawal, A., & Koslover, E. F. (2021) · PLoS Computational Biology · doi:10.1371/journal.pcbi.1009073 · Cited by 22
“The marked mitochondria are then targeted for encapsulation by autophagosomes, which transport them back to the soma for recycling while fusing with proximally located fully acidified lysosomes en route [50, 60].”
Development of a specific live-cell assay for native autophagic flux
Safren, N., Tank, E. M. H., Malik, A. M., Chua, J. P., Santoro, N., & Barmada, S. J. (2021) · Journal of Biological Chemistry · doi:10.1016/j.jbc.2021.101003 · Cited by 18
“GFP-LC3 puncta within axons traveled in a bidirectional manner at varying speeds (Supplemental Movie 4), similar to what has been previously observed in dorsal root ganglion neurons from GFP-LC3 mice (48, 62).”
BackgroundResultChen, L., Shao, Q., Zhang, W., Yang, M., Chang, Q., Chen, R., & Chen, J. (2019) · Human Molecular Genetics · doi:10.1093/hmg/ddz230 · Cited by 20
“Dynein is the major motor that drives retrograde transport of autophagosomes from the distal axons to somas of neurons (29,30).”
BackgroundComparative analysis of axonal transport markers in primary mammalian neurons
Klinman, E., & Holzbaur, E. L. F. (2015) · Methods in cell biology · doi:10.1016/bs.mcb.2015.06.011 · Cited by 20
Self-citationPurkinje Cells Are More Vulnerable to the Specific Depletion of Cathepsin D Than to That of Atg7
Koike, M., Shibata, M., Sunabori, T., Yamaguchi, J., Sakimura, K., Komatsu, M., Tanaka, K., & Uchiyama, Y. (2017) · American Journal Of Pathology · doi:10.1016/j.ajpath.2017.02.020 · Cited by 20
Krzystek, T. J., White, J. A., Rathnayake, R., Thurston, L., Hoffmar-Glennon, H., Li, Y., & Gunawardena, S. (2022) · Autophagy · doi:10.1080/15548627.2022.2119351 · Cited by 19
“In parallel, ATG5/Atg5 (autophagy related 5)-dependent phagophore (PG) expansion [19,20] forms a nascent autophagosome (AP) in distal axons, marked by Atg8/MAP1LC3/LC3 (Autophagy-related 8/micro-tubule associated protein 1 light chain 3) [21,22].”
BackgroundThe Role of Mitophagy in Various Neurological Diseases as a Therapeutic Approach
Kaur, S., Sharma, N., Kumar, V., Sharma, D., Devi, B., Kapil, L., Singh, C., & Singh, A. (2022) · Cellular and Molecular Neurobiology · doi:10.1007/s10571-022-01302-8 · Cited by 21
“Autophagosomes are formed in the growth cones of neurons and neuromuscular junctions by in vivo processes (Al-Bari and Alim 2020) (Maday et al. 2012) (Neisch et al.”
BackgroundBrain-derived neurotrophic factor stimulates the retrograde pathway for axonal autophagy
Sidibe, D. K., Kulkarni, V. V., Dong, A., Herr, J. B., Vogel, M. C., Stempel, M. H., & Maday, S. (2022) · Journal of Biological Chemistry · doi:10.1016/j.jbc.2022.102673 · Cited by 23
“A significant population of autophagosomes present in the soma originate from the axon (25, 26, 29).”
BackgroundInfluentialSelf-citationJasutkar, H. G., Wasserlein, E. M., Ishola, A. O., Litt, N. A., Staniszewski, A., Arancio, O., & Yamamoto, A. (2024) · Autophagy · doi:10.1080/15548627.2024.2368335 · Cited by 20
Retrograde NGF Axonal Transport—Motor Coordination in the Unidirectional Motility Regime
Chowdary, P. D., Che, D. L., Zhang, K., & Cui, B. (2015) · Biophysical Journal · doi:10.1016/j.bpj.2015.04.036 · Cited by 21
The lifecycle of the neuronal microtubule transport machinery
Twelvetrees, A. E. (2020) · Seminars in Cell and Developmental Biology · doi:10.1016/j.semcdb.2020.02.008 · Cited by 22
“elongation [96], retrograde neurotrophic signaling [97,98] and autophagy [99].”
Liu, Z.-D., Zhang, S., Jianjin, H., Xie, T., & Kang, J. (2016) · Protein & Cell · doi:10.1007/s13238-016-0301-6 · Cited by 19
“As an important cargo binding subunit of dynein (Ha et al., 2008), dynein intermediate chains (DYNC1I1 and DYNC1I2) are necessary for the functional integrity of dynein (Figs.”
BackgroundInfluentialAstrocytes eyeball axonal mitochondria
Burdett, T. C., & Freeman, M. R. (2014) · Science · doi:10.1126/science.1258295 · Cited by 19
Durairajan, S. S. K., Selvarasu, K., Singh, A. K., Patnaik, S., Iyaswamy, A., Jaiswal, Y., Williams, L. L., & Huang, J. (2024) · Frontiers in Cellular Neuroscience · doi:10.3389/fncel.2024.1432002 · Cited by 18
Ishikawa, K., Saiki, S., Furuya, N., Imamichi, Y., Tsuboi, Y., & Hattori, N. (2018) · Neuroscience Letters · doi:10.1016/j.neulet.2018.10.036 · Cited by 18
Mitophagy mechanisms in neuronal physiology and pathology during ageing
Markaki, M., Tsagkari, D., & Tavernarakis, N. (2021) · Biophysical Reviews · doi:10.1007/s12551-021-00894-7 · Cited by 18
Zhang, J., Twelvetrees, A. E., Lazarus, J. E., Blasier, K. R., Yao, X., Inamdar, N. A., Holzbaur, E. L. F., Pfister, K. K., & Xiang, X. (2013) · Cytoskeleton · doi:10.1002/cm.21102 · Cited by 18
“…prion protein vesicles [Bass and Buster 2004; Ha et al., 2008; Zhang et al., 2009; Encalada et al., 2011; Pandey and Smith 2011; Yi et al., 2011; Maday et al., 2012; Mitchell et al., 2012; Sheng and Cai 2012; Zhou et al., 2012], but how dynein interacts with all these cargoes requires further…”
BackgroundSelf-citationTwelvetrees, A. E., Hendricks, A. G., & Holzbaur, E. L. F. (2012) · Cell · doi:10.1016/j.cell.2012.05.001 · Cited by 18
Self-citationWiesner, D., Sinniger, J., Henriques, A., Dieterle, S., Müller, H.-P., Rasche, V., Ferger, B., Dirrig‐Grosch, S., Soylu-Kucharz, R., Petersén, Å., et al. (2014) · Human Molecular Genetics · doi:10.1093/hmg/ddu741 · Cited by 18
An essential step of kinetochore formation controlled by the SNARE protein Snap29
Morelli, E., Mastrodonato, V., Beznoussenko, G. V., Mironov, A., Tognon, E., & Vaccari, T. (2016) · The EMBO Journal · doi:10.15252/embj.201693991 · Cited by 18
Lysosome Function and Dysfunction in Hereditary Spastic Paraplegias
Edmison, D., Wang, L., & Gowrishankar, S. (2021) · Brain Sciences · doi:10.3390/brainsci11020152 · Cited by 18
Molecular Basis of Neuronal Autophagy in Ageing: Insights from Caenorhabditis elegans
Konstantinidis, G., & Tavernarakis, N. (2021) · Cells · doi:10.3390/cells10030694 · Cited by 19
“Sequestration of mitochondria fragments have been captured into a subpopulation of autophagosomes [98].”
BackgroundAutophagy in axonal and presynaptic development
Crawley, O., & Grill, B. J. (2021) · Current Opinion in Neurobiology · doi:10.1016/j.conb.2021.03.011 · Cited by 17
Sajic, M., Ida, K. K., Canning, R., Gregson, N. A., Duchen, M. R., & Smith, K. J. (2018) · Journal of Neuroinflammation · doi:10.1186/s12974-018-1094-8 · Cited by 19
“In vitro studies have indicated that damaged axonal mitochondria are transported retrogradely to the cell body in order to be degraded [29].”
Axonal mitophagy in retinal ganglion cells
Yang, L., Li, Y., Jiao, Q., Wei, M., Wang, Y., Cui, A., Li, Z., & Li, G. (2024) · Cell Communication and Signaling · doi:10.1186/s12964-024-01761-0 · Cited by 22
“Autopha-gosomes in the axons transport engulfed mitochondria to the soma to complete the autophagy process [8, 9].”
BackgroundInfluentialAutophagy in alzheimer disease pathogenesis and its therapeutic values
Angst, G., Jia, N., Esqueda, L. T., Fan, Y., Cai, Q., & Wang, C. (2025) · Autophagy Reports · doi:10.1080/27694127.2025.2471677 · Cited by 22
Mukem, S., Thongbuakaew, T., & Khornchatri, K. (2021) · Heliyon · doi:10.1016/j.heliyon.2021.e07310 · Cited by 17
“The autophagy-lysosomal degradative pathway is essential for maintaining cellular homeostasis and avoid potential cellular stress (Maday et al., 2012).”
BackgroundMorphology and Transport in Eukaryotic Cells
Agrawal, A., Scott, Z. C., & Koslover, E. F. (2022) · Annual Review of Biophysics · doi:10.1146/annurev-biophys-111121-103956 · Cited by 18
Kostiuchenko, O., Lushnikova, I., Kowalczyk, M., & Skibo, G. G. (2022) · BBA Advances · doi:10.1016/j.bbadva.2022.100066 · Cited by 18
Driving autophagy – the role of molecular motors
Nambiar, A., & Manjithaya, R. R. (2024) · Journal of Cell Science · doi:10.1242/jcs.260481 · Cited by 17
Maintenance mechanisms of circuit-integrated axons
Mariano, V., Domıńguez-Iturza, N., Neukomm, L. J., & Bagni, C. (2018) · Current Opinion in Neurobiology · doi:10.1016/j.conb.2018.08.007 · Cited by 18
Destroy the old to build the new: Activity-dependent lysosomal exocytosis in neurons
Ibata, K., & Yuzaki, M. (2021) · Neuroscience Research · doi:10.1016/j.neures.2021.03.011 · Cited by 18
Axonal Regeneration by Glycosaminoglycan
Sakamoto, K., Ozaki, T., & Kadomatsu, K. (2021) · Frontiers in Cell and Developmental Biology · doi:10.3389/fcell.2021.702179 · Cited by 17
Intra‐axonal protein aggregation in the peripheral nervous system
Vital, A., Meissner, W. G., Canron, M., Martin‐Négrier, M., Bézard, E., Tison, F., & Vital, C. (2014) · Journal of the Peripheral Nervous System · doi:10.1111/jns5.12056 · Cited by 17
“More recently, it was demonstrated that autophagosomes initiate distally the internalization of both organelles and soluble cargoes including ubiquitin (Maday et al., 2012).”
BackgroundSynaptic Vesicle Distribution by Conveyor Belt
Moughamian, A. J., & Holzbaur, E. L. F. (2012) · Cell · doi:10.1016/j.cell.2012.02.007 · Cited by 17
“Analysis of other vesicular cargos undergoing axonal transport, including late endosomes/ lysosomes (Hendricks et al., 2010) and autophagosomes (Maday et al., 2012), shows that both anterograde and retrograde motors can remain tightly associated with cargos, even during long runs driven by the…”
BackgroundSelf-citationSpecific autoantigens in experimental autoimmunity‐associated atherosclerosis
Merched, A. J., Daret, D., Li, L., Franzl, N., & Sauvage‐Merched, M. (2016) · The FASEB Journal · doi:10.1096/fj.201500131 · Cited by 17
Imaging of neuronal mitochondria in situ
Plucińska, G., & Misgeld, T. (2016) · Current Opinion in Neurobiology · doi:10.1016/j.conb.2016.06.006 · Cited by 17
The compartmentalised nature of neuronal mitophagy: molecular insights and implications
Borbolis, F., & Palikaras, K. (2022) · Expert Reviews in Molecular Medicine · doi:10.1017/erm.2022.31 · Cited by 16
“153).”
Potent New Targets for Autophagy Enhancement to Delay Neuronal Ageing
Szinyákovics, J., Keresztes, F., Kiss, E. A., Falcsik, G., Vellai, T., & Kovács, T. (2023) · Cells · doi:10.3390/cells12131753 · Cited by 16
“Taken together, these observations indicate that in neurons, autophagosomes undergo a spatially defined maturation process, which requires endocytosis and retrograde transport [34].”
BackgroundHippman, R. S., Snead, A. M., Petros, Z. A., Korkmaz, M. A., Patel, S., Sotelo, D., Dobria, A., Salkovski, M., Nguyen, T. T. A., Linares-Saldana, R., et al. (2023) · ACS Chemical Neuroscience · doi:10.1021/acschemneuro.3c00573 · Cited by 16
Rab11 regulates autophagy at dendritic spines in an mTOR- and NMDA-dependent manner
Janusz, A., Brzozowska, A., Tempes, A., Urbańska, M., Błażejczyk, M., Miłek, J., Kuźniewska, B., Zeng, J., Węsławski, J., Kisielewska, K., et al. (2024) · Molecular Biology of the Cell · doi:10.1091/mbc.e23-02-0060 · Cited by 16
Hensley, K., Poteshkina, A., Johnson, M. F., Eslami, P., Gabbita, S. P., Hristov, A. M., Venkova-Hristova, K., & Harris‐White, M. E. (2015) · Journal of Neurotrauma · doi:10.1089/neu.2015.4196 · Cited by 16
White, J., Banerjee, R., & Gunawardena, S. (2016) · Marine Drugs · doi:10.3390/md14050102 · Cited by 16
“Defects in autophagy have been reported in many diseases such as AD, PD, ALS, and HD [14,133,134], and all of these diseases exhibit pathologies defined by accumulation of aggregated disease proteins.”
BackgroundInfluentialThakur, R. S., & O’Connor-Giles, K. M. (2025) · Cell Reports · doi:10.1016/j.celrep.2025.115483 · Cited by 23
Pathogenic Aspects and Therapeutic Avenues of Autophagy in Parkinson’s Disease
Kinet, R., & Dehay, B. (2023) · Cells · doi:10.3390/cells12040621 · Cited by 15
“Once closed, the now-called autophagosome can enter a maturation phase, fusing with endosomes to add new material to be degraded [86].”
BackgroundThe tissue- and developmental stage-specific involvement of autophagy genes in aggrephagy
Zheng, H., Yuan, C., Zhang, H., Chen, Y., & Zhang, H. (2019) · Autophagy · doi:10.1080/15548627.2019.1632121 · Cited by 15
“neurons are preferentially generated at the distal tip of the axon, and then undergo retrograde trafficking to the soma, accompanied by stepwise maturation into autolysosomes [31].”
BackgroundLi, H., Li, X., Xu, Z., Lü, J., Cao, C., You, W., Yu, Z., Shen, H., & Chen, G. (2022) · Journal of Neuroscience · doi:10.1523/jneurosci.2030-21.2022 · Cited by 15
“Because of the highly polarized architecture with axons in neurons, neuronal autophagy possesses unique localizations of lysosomes and autophagosomes, in that lysosomes are mainly located in the cell soma, but autophagosomes are preferentially generated at the neurite tip (Maday et al., 2012; T. Wang et al., 2015).”
BackgroundSpatial regulation of endosomes in growing dendrites
Yap, C. C., & Winckler, B. (2022) · Developmental Biology · doi:10.1016/j.ydbio.2022.03.004 · Cited by 14
Disruptions in axonal lysosome transport and its contribution to neurological disease
Paumier, J., & Gowrishankar, S. (2024) · Current Opinion in Cell Biology · doi:10.1016/j.ceb.2024.102382 · Cited by 16
“…decades as well as in iPSC-derived neurons more recently, examining distinct components of lysosomes and fluorescently tagged autophagy proteins have also corroborated that distally forming endo-lysosomes progressively mature and acidify on their retrograde movement back to the soma [11 e 13,19].”
Chen, L., Shao, Q., Zhang, W., Yang, M., Chang, Q., Chen, R., & Chen, J. (2020) · Human Molecular Genetics · doi:10.1093/hmg/ddaa012 · Cited by 14
Axonal transport of Hrs is activity dependent and facilitates synaptic vesicle protein degradation
Birdsall, V., Kirwan, K., Zhu, M. J., Imoto, Y., Wilson, S. M., Watanabe, S., & Waites, C. L. (2022) · Life Science Alliance · doi:10.26508/lsa.202000745 · Cited by 16
“However, the axonal transport of autophagosomes in cultured neurons appears to be a largely constitutive process that is unaffected by stimuli such as synaptic activity and glucose levels (Maday et al, 2012; Maday & Holzbaur, 2012, 2016).”
Hebron, M. L., Algarzae, N. K., Lonskaya, I., & Moussa, C. (2013) · Experimental Neurology · doi:10.1016/j.expneurol.2013.01.009 · Cited by 14
Ryan, T. A., Roper, K. M., Bond, J., Bell, S. M., Sweeney, S. T., & Morrison, E. E. (2018) · The International Journal of Biochemistry & Cell Biology · doi:10.1016/j.biocel.2018.09.008 · Cited by 14
“13 lysosomes and autophagosomes observed (56-58).”
Loss of NDR1/2 kinases impairs endomembrane trafficking and autophagy leading to neurodegeneration
Roşianu, F., Mihaylov, S. R., Eder, N., Martiniuc, A., Claxton, S., Flynn, H. R., Jalal, S., Domart, M., Collinson, L., Skehel, M. J., et al. (2022) · Life Science Alliance · doi:10.26508/lsa.202201712 · Cited by 14
“RFP-labelled autophagosomes predominantly travelled in the retrograde direction, as previously reported (Maday et al, 2012).”
A Study on Autophagy Related Biomarkers in Alzheimer’s Disease Based on Bioinformatics
Li, J., Liu, W., Sun, W., Rao, X., Chen, X., & Yu, L. (2023) · Cellular and Molecular Neurobiology · doi:10.1007/s10571-023-01379-9 · Cited by 14
Metadata
- Authors
- Maday, S., Wallace, K. E., & Holzbaur, E. L. F.
- Affiliations
- University of Pennsylvania (US)
- Corresponding author
- Maday, Sandra
- Holzbaur, Erika L.F.
- Venue
- Journal of Cell Biology
- Publisher
- Rockefeller University Press
- Published
- 2012-02-13
- Volume
- 196
- Issue
- 4
- Pages
- 407-417
- ISSN
- 0021-9525 (ISSN-L)
- 1540-8140
- PMC
- PMC3283992
- OpenAlex
- W2137686667
- Cited by
- 681
- References
- 30
- Citations by year
- 2026: 34 · 2025: 45 · 2024: 56 · 2023: 37 · 2022: 66 · 2021: 65 · 2020: 52 · 2019: 55 · 2018: 53 · 2017: 39 · 2016: 47 · 2015: 52 · 2014: 38 · 2013: 27 · 2012: 13
- FWCI
- 31.13
- Type
- journal article
- Language
- en
- Open access
- hybrid
- doi.org
- Licence
- cc-by-nc-sa
- Locations
- The Journal of Cell Biology (publishedVersion, cc-by-nc-sa)
- Europe PMC (PubMed Central) (publishedVersion, cc-by-nc-sa)
- PubMed Central (publishedVersion, cc-by-nc-sa)
- PubMed (publishedVersion)
- Funders
- National Institute of Neurological Disorders and Stroke (R37NS060698, NS060698, R01NS060698)
- Topics
- Life Sciences › Biochemistry, Genetics and Molecular Biology › Cell Biology › Autophagy in Disease and Therapy
- Life Sciences › Biochemistry, Genetics and Molecular Biology › Cell Biology › Cellular transport and secretion
- Life Sciences › Biochemistry, Genetics and Molecular Biology › Physiology › Calcium signaling and nucleotide metabolism
- Keywords
- autophagosomes, autophagy, dorsal root ganglion neurons, axonal transport, dynein, kinesin, retrograde transport, autophagosome maturation, autolysosomes, lysosomes, mitochondria, ubiquitin, neurodegeneration
- MeSH terms
- Superoxide Dismutase-1, Animals, Autophagy, Axons, Biological Transport, Cell Compartmentation, Dyneins, Fluorescent Antibody Technique, Image Processing, Computer-Assisted, Mice, Transgenic, Neurons, Phagosomes, Superoxide Dismutase, Green Fluorescent Proteins, Mice
About these checks
Registry, retraction, Cites and statistics results are computed, not judged, with one exception: a printed reference that no index lists is read once by a model before it counts as a citation error. Claims are extracted by a model and kept only when their quote appears verbatim in the text; each cited source is then checked, with a model’s help, for whether it says what the claim relies on. Those verdicts can be wrong — read the claim’s quote and the cited source before relying on one.
Statistics and arithmetic are recomputed, not judged.
Confidence bands are shown only for fields calibrated on our annotated test set. None is calibrated yet, so no band is shown.
What counts as a claim ›How we measure confidence ›How we check this ›
Are you an author, or do you see a problem with this page? Request a review
