

The DOI matches its Crossref record; 35 of the 35 references it cites were found in a registry or an index.
Interleukin-18 (Interferon-γ–inducing Factor) Is Produced by Osteoblasts and Acts Via Granulocyte/Macrophage Colony-stimulating Factor and Not Via Interferon-γ to Inhibit Osteoclast Formation
Open accessAbstract
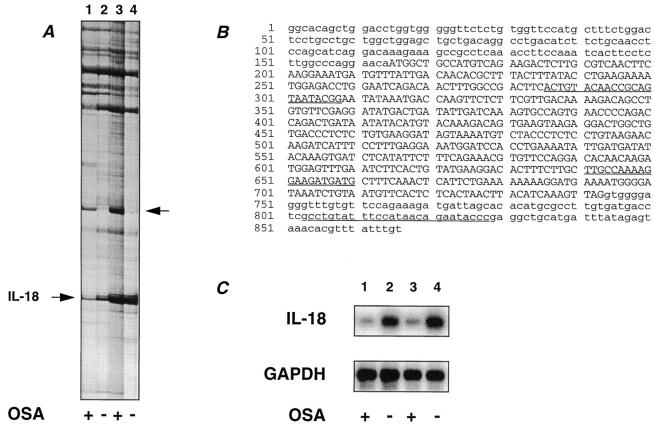
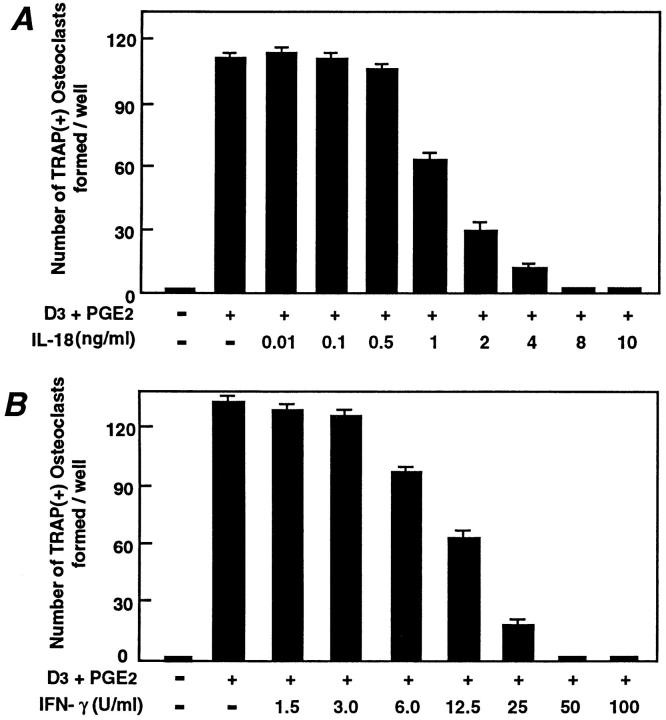
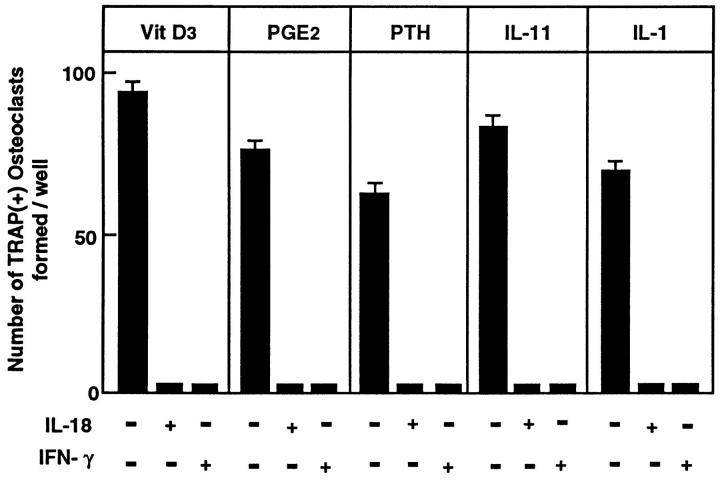
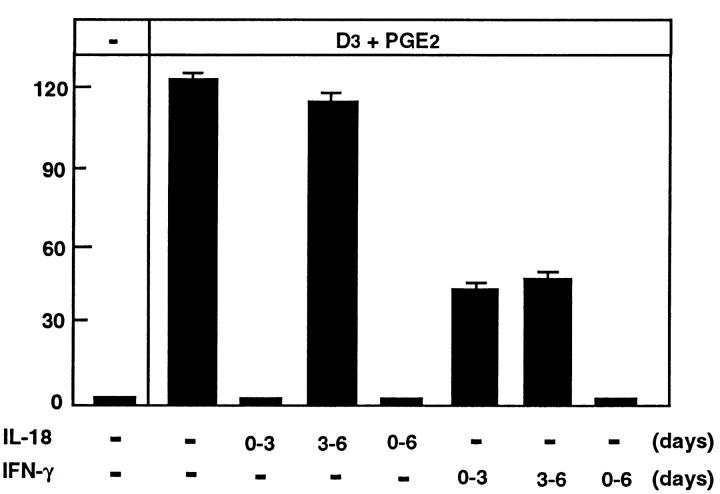
We have established by differential display polymerase chain reaction of mRNA that interleukin (IL)-18 is expressed by osteoblastic stromal cells. The stromal cell populations used for comparison differed in their ability to promote osteoclast-like multinucleated cell (OCL) formation. mRNA for IL-18 was found to be expressed in greater abundance in lines that were unable to support OCL formation than in supportive cells. Recombinant IL-18 was found to inhibit OCL formation in cocultures of osteoblasts and hemopoietic cells of spleen or bone marrow origin. IL-18 inhibited OCL formation in the presence of osteoclastogenic agents including 1α,25-dihydroxyvitamin D3, prostaglandin E2, parathyroid hormone, IL-1, and IL-11. The inhibitory effect of IL-18 was limited to the early phase of the cocultures, which coincides with proliferation of hemopoietic precursors. IL-18 has been reported to induce interferon-γ (IFN-γ) and granulocyte/macrophage colony-stimulating factor (GM–CSF) production in T cells, and both agents also inhibit OCL formation in vitro. Neutralizing antibodies to GM–CSF were able to rescue IL-18 inhibition of OCL formation, whereas neutralizing antibodies to IFN-γ did not. In cocultures with osteoblasts and spleen cells from IFN-γ receptor type II–deficient mice, IL-18 was found to inhibit OCL formation, indicating that IL-18 acted independently of IFN-γ production: IFN-γ had no effect in these cocultures. Additionally, in cocultures in which spleen cells were derived from receptor-deficient mice and osteoblasts were from wild-type mice and vice versa, we identified that the target cells for IFN-γ inhibition of OCL formation were the hemopoietic cells. The work provides evidence that IL-18 is expressed by osteoblasts and inhibits OCL formation via GM–CSF production and not via IFN-γ production.
Overview
The claims and statistics of this paper haven’t been checked yet.
Run the check — free, no account needed. It reads the open-access text and checks the sources it cites.
Integrity signals
Registry
Cites
Statistics
Figures
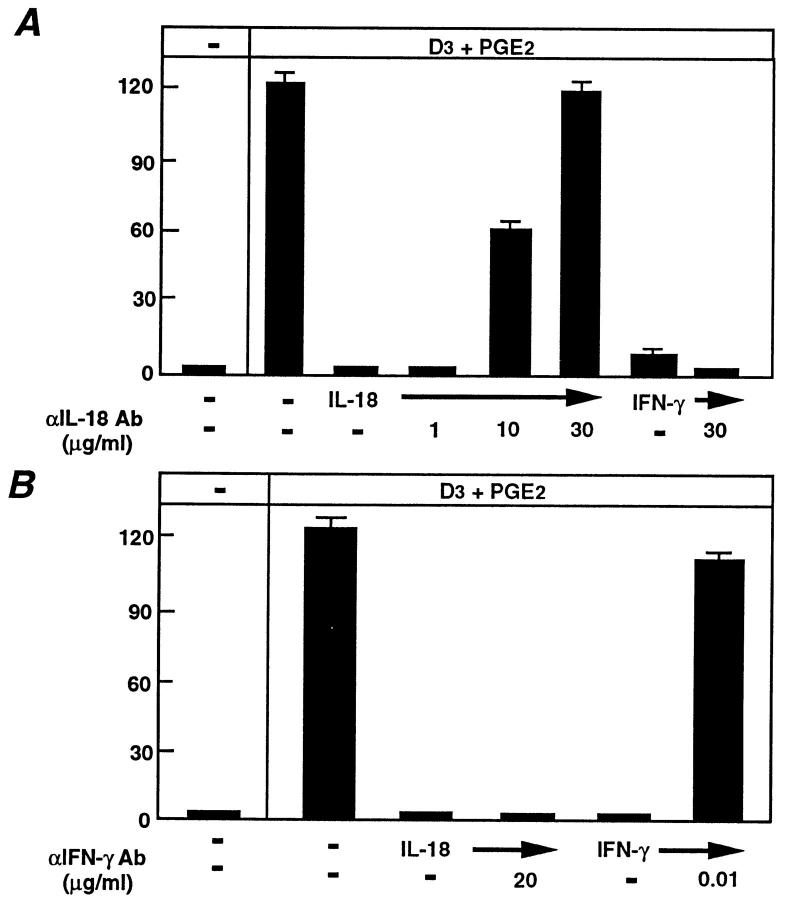
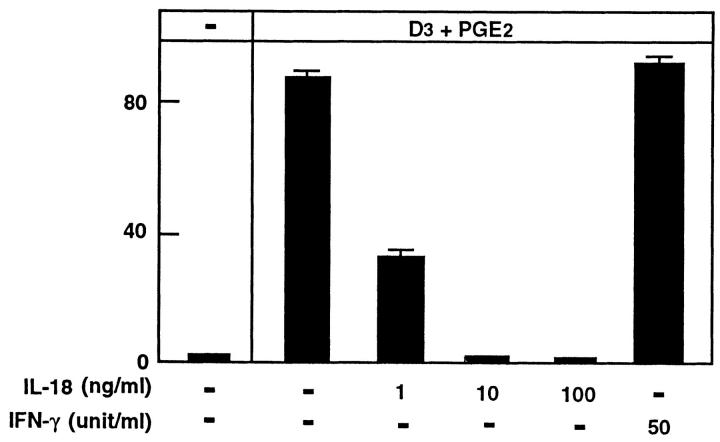
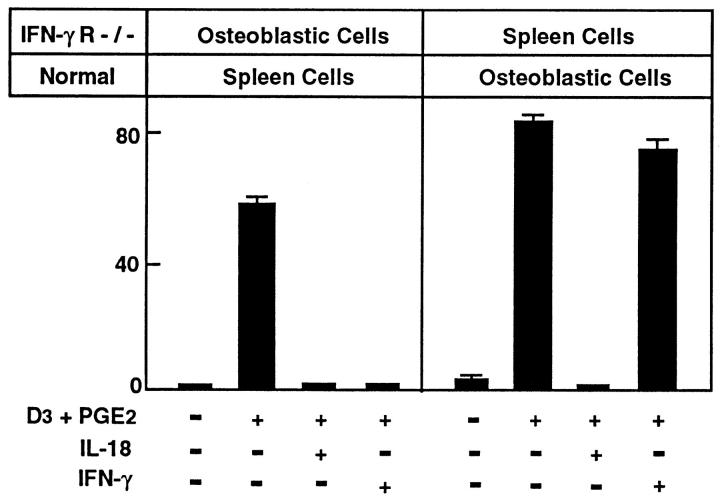
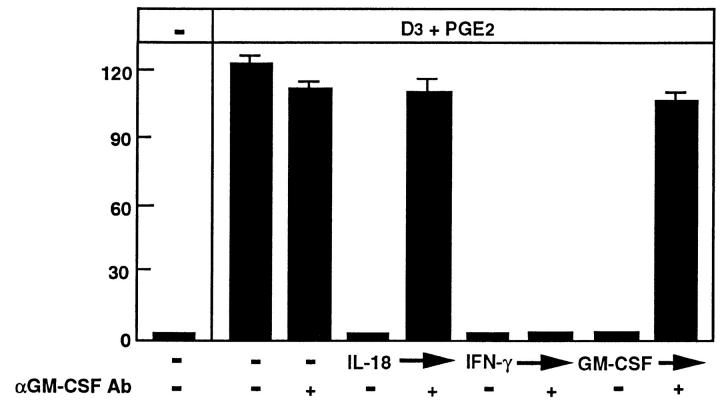
Verification
Claims the paper makes
The claims and statistics of this paper haven’t been checked yet.
Run the check — free, no account needed. It reads the open-access text and checks the sources it cites.
Claims other papers make about this one
Each is checked against this paper’s own text: does it say what the citing paper says it does?
The cited source doesn’t support the claim as written.
In the citing paper
“Using co-cultures of osteoblasts and hematopoietic cells, Udagawa and associates found that IL-18 inhibited osteoclastogenesis by downregulating osteoblast production of M-CSF [48].”
From Osteoclasts and Microgravity (2020) · cites this paper as [48]
Checked by a reasoning model — may be wrong.
Experimental — accuracy not yet measured
Self-check
Percentages, sums and reported differences re-computed from the paper’s own numbers.
The self-check needs the paper’s full text.
Citations
Cites
Differential Display of Eukaryotic Messenger RNA by Means of the Polymerase Chain Reaction
Liang, P., & Pardee, A. B. (1992) · Science · doi:10.1126/science.1354393 · Cited by 4,964 · cited 3×
“To identify stromal cell genes potentially involved in osteoclastogenesis, we have used differential display of eukaryotic mRNA (ddPCR) (21) to identify genes differentially expressed between osteoclastogenic supportive and nonsupportive stromal cell lines.”
BackgroundMethodCloning of a new cytokine that induces IFN-γ production by T cells
Okamura, H., Tsutsui, H., Komatsu, T., Yutsudo, M., Hakura, A., Tanimoto, T., Torigoe, K., Okura, T., Nukada, Y., Hattori, K., et al. (1995) · Nature · doi:10.1038/378088a0 · Cited by 2,602 · cited 7×
“Recombinant mouse IL-18 dose-dependently inhibited OCL formation, giving maximal inhibition at 8 ng/ml (Fig. 2 A); this dose response to IL-18 is very similar to that in other biological systems ( 22 ).”
BackgroundMethodInfluentialSelf-citationTso, J. Y., Sun, X.-H., Kao, T., Reece, K. S., & Wu, R. (1985) · Nucleic Acids Research · doi:10.1093/nar/13.7.2485 · Cited by 1,791
Immune Response in Mice that Lack the Interferon-γ Receptor
Huang, S., Hendriks, W. J. A. J., Althage, A., Hemmi, S., Bluethmann, H., Kamijo, R., Vilček, J., Zinkernagel, R. M., & Aguet, M. (1993) · Science · doi:10.1126/science.8456301 · Cited by 1,551 · cited 2×
“We thank Professor M. Auget (Swiss Institute for Experimental Cancer Research, Switzerland) and Dr. P. Tipping (Monash Medical Centre, Australia) for access to the IFN- g type II receptor knockout mice (IFN- g R 2 / 2 ) ( 24 ).”
MethodModulation of Osteoclast Differentiation
Suda, T., Takahashi, N., & Martin, T. J. (1992) · Endocrine Reviews · doi:10.1210/edrv-13-1-66 · Cited by 1,004 · cited 2×
“These cells are multinucleated and express the OCL characteristics of TRAP activity and calcitonin receptors, and have the capacity to resorb bone (8).”
BackgroundSelf-citationOSTEOBLASTIC CELLS ARE INVOLVED IN OSTEOCLAST FORMATION
Takahashi, N., Akatsu, T., Udagawa, N., Sasaki, T., Yamaguchi, A., Moseley, J. M., Martin, T. J., & Suda, T. (1988) · Endocrinology · doi:10.1210/endo-123-5-2600 · Cited by 934 · cited 2×
“The expression of calcitonin receptors was also assessed by autoradiography using [ 125 I]salmon calcitonin as described ( 25 ).”
MethodSelf-citationSoluble interleukin-6 receptor triggers osteoclast formation by interleukin 6.
Tamura, T., Udagawa, N., Takahashi, N., Miyaura, C., Tanaka, S., Yamada, Y., Koishihara, Y., Ohsugi, Y., Kumaki, K., & Taga, T. (1993) · Proceedings of the National Academy of Sciences · doi:10.1073/pnas.90.24.11924 · Cited by 828
Self-citationUshio, S., Namba, M., Okura, T., Hattori, K., Nukada, Y., Akita, K., Tanabe, F., Konishi, K., Micallef, M. J., Fujii, M., et al. (1996) · The Journal of Immunology · doi:10.4049/jimmunol.156.11.4274 · Cited by 624
Self-citationAdvances in Bone Biology: The Osteoclast*
Roodman, G. D. (1996) · Endocrine Reviews · doi:10.1210/edrv-17-4-308 · Cited by 553 · cited 3×
“Although IFN-g is known to inhibit osteoclast formation in vitro ( 4 ), the present experiments exclude IFN-g as an intermediate in the inhibitory effect of IL-18 on osteoclast formation, for a number of reasons.”
BackgroundResultInfluentialUdagawa, N., Takahashi, N., Akatsu, T., Sasaki, T., Yamaguchi, A., KODAMA, H., Martin, T. J., & Suda, T. (1989) · Endocrinology · doi:10.1210/endo-125-4-1805 · Cited by 492 · cited 1×
“We previously reported that bone marrow–derived stromal cell lines, MC3T3-G2/PA6 and ST2, had the capacity to support OCL formation in cocultures with hemopoietic cells (18).”
BackgroundSelf-citation
Cited by
Sorted by citations
Items 301–376 of 376
Amash, A., Huleihel, M., Eyal, S., Maor, E., Myatt, L., & Holcberg, G. (2007) · PubMed · doi:10.1684/ecn.2007.0102 · Cited by 13
Mahajani, M., Jadhao, V. A., Wankhade, P. S., Samson, E. P., Acharya, V. D., & Tekale, P. D. (2017) · The Journal of Contemporary Dental Practice · doi:10.5005/jp-journals-10024-2180 · Cited by 13
“The Journal of Contemporary Dental Practice, November 2017;18(11):1085-1089 1085 JCDP”
InfluentialHori, M., Sawai, H., Tsuji, Y., Okamura, H., & Koyama, K. (2006) · Connective Tissue Research · doi:10.1080/03008200600685350 · Cited by 13
“IL-18 produced in osteoblasts acts via granulocyte/macrophage colony-stimulating factor (G/MCSF), but not via IFN-γ , to inhibit osteoclast formation [29].”
BackgroundSelf-citationThe progression of comorbidity in IL-18 transgenic chronic obstructive pulmonary disease mice model
Takenaka, S., Kawayama, T., Imaoka, H., Sakazaki, Y., Oda, H., Kaku, Y., Matsuoka, M., Okamoto, M., Kato, S., Yamada, K., et al. (2014) · Biochemical and Biophysical Research Communications · doi:10.1016/j.bbrc.2014.02.052 · Cited by 12
Nucleic acid aptamers in orthopedic diseases: promising therapeutic agents for bone disorders
He, Z., Peng, Q., Bin, W., Zhao, L., Chen, Y., Zhang, Y., Yang, W., Yan, X., & Liu, H. (2025) · Bone Research · doi:10.1038/s41413-025-00447-8 · Cited by 11
Bao, J., Ma, C., Ran, J., Xiong, Y., Yan, S., & Wu, L. (2017) · Oncotarget · doi:10.18632/oncotarget.20584 · Cited by 10
“As a member of the IL-1 cytokine family, IL-18 is mainly produced by chondrocytes, osteoblasts, FLS, and macrophages in joints [8, 9], and the increased concentration of IL-18 in the synovial fluid, synovium, cartilage, and blood serum is reported to be related to the degree of severity of OA seen in radiographic imag…”
BackgroundInteractions Among Osteoblasts, Osteoclasts, and Other Cells in Bone
Martin, T. J., Sims, N. A., & Quinn, J. M. W. (2010) · Elsevier eBooks · doi:10.1016/b978-0-12-375670-1.10008-1 · Cited by 11
Self-citationAreIL18RAPgene polymorphisms associated with body mass regulation? A cross-sectional study
Martínez-Barquero, V., de Marco, G., Martínez‐Hervás, S., Adam-Felici, V., Pérez-Soriano, C., González-Albert, V., Rojo‐Martínez, G., Ascaso, J. F., Real, J. T., García-García, A.-B., et al. (2017) · BMJ Open · doi:10.1136/bmjopen-2017-017875 · Cited by 10
Yun, C., Son, C., Chung, D. K., & Han, S. H. (2005) · International Immunopharmacology · doi:10.1016/j.intimp.2005.06.014 · Cited by 9
IL-12-assisted immunization generates CD4+ T cell-mediated immunity to Listeria monocytogenes
Miller, M. A., Skeen, M. J., Lavine, C. L., & Ziegler, H. (2003) · Cellular Immunology · doi:10.1016/s0008-8749(03)00083-2 · Cited by 9
Ngoumou, G. B., Schaefer, D., Mattes, J. E., & Kopp, M. (2004) · Cytokine · doi:10.1016/j.cyto.2003.11.013 · Cited by 8
Role of cytokines and chemokines in cartilage and bone destruction in arthritis
Goldring, M. B., & Goldring, S. R. (2002) · Current Opinion in Orthopedics · doi:10.1097/00001433-200210000-00005 · Cited by 8
Mundy, G. R., Oyajobi, B. O., Traianedes, K., Dallas, S. L., & Chen, D. (2001) · Elsevier eBooks · doi:10.1016/b978-012470862-4/50014-3 · Cited by 8
Expression of Interleukin-18 Receptor mRNA in the Mouse Endometrium
Otsuki, M., KUSUMOTO, K., MURAKAMI, Y., Kanayama, M., Takeuchi, S., & Takahashi, S. (2007) · Journal of Reproduction and Development · doi:10.1262/jrd.18036 · Cited by 7
Ye, X. J., Tang, B., Ma, Z., Zhou, J., Myers, L. K., Kang, A. H., & Cremer, M. A. (2007) · Clinical & Experimental Immunology · doi:10.1111/j.1365-2249.2007.03447.x · Cited by 6
Bone marrow cells produce soluble factors that inhibit osteoclast activity
Ninomiya, J. T., Bi, Y., Banks, M. A., Lavish, S. A., Goldberg, V. M., & Greenfield, E. M. (1999) · Journal of Orthopaedic Research® · doi:10.1002/jor.1100170109 · Cited by 6
Concanavalin A induces formation of osteoclast-like cells in RAW 264.7 mouse macrophage cells
Kasugai, C., Morikawa, A., Naiki, Y., Koide, N., Komatsu, T., Yoshida, T., & Yokochi, T. (2009) · Immunopharmacology and Immunotoxicology · doi:10.1080/08923970802438417 · Cited by 6
RANKL Induces IL-18 Binding Protein Expression in RAW264.7 Cells
Takahashi, Y., Tanaka, H., Nakai, K., Kitami, S., Murakami, F., Morita, T., Tanabe, N., Kawato, T., & Maeno, M. (2016) · Journal of Hard Tissue Biology · doi:10.2485/jhtb.25.173 · Cited by 5
Imai, M., Ayukawa, Y., Yasunami, N., Furuhashi, A., Takemura, Y., Adachi, N., Hu, J., Zhou, X., Moriyama, Y., Atsuta, I., et al. (2018) · Advances in Wound Care · doi:10.1089/wound.2018.0834 · Cited by 5
Inoue, H., KUMAGAI, H., Osono, M., Matsufuji, M., Sameshima, T., Kawamura, N., Someno, T., Ishizuka, M., & TAKEUCHI, T. (2003) · The Journal of Antibiotics · doi:10.7164/antibiotics.56.209 · Cited by 5
Lian, J. B., & Stein, G. S. (2006) · Elsevier eBooks · doi:10.1016/b978-012088562-6/50015-7 · Cited by 31
IL-18 signaling is regulated by caspase 6/8 and IL-18BP in turbot (Scophthalmus maximus)
Yu, C., Xu, H., Jiang, S., & Sun, L. (2024) · International Journal of Biological Macromolecules · doi:10.1016/j.ijbiomac.2024.135015 · Cited by 4
Okamura, H., Lotze, M. T., Tsutsui, H., Kashiwamura, S., UEDA, H., YOSHIMOTO, T., & NAKANISHI, K. (2003) · Elsevier eBooks · doi:10.1016/b978-012689663-3/50033-8 · Cited by 4
Self-citationSystemic and Local Regulators of Bone Remodeling
Hurley, M. M., & Lorenzo, J. (2004) · Springer eBooks · doi:10.1007/978-1-4471-3777-1_3 · Cited by 4
Takubo, T., Kumura, T., Nishiki, S., Kinoshita, Y., Koh, K.-R., Ohta, K., Yamane, T., Hino, M., Kamitani, T., & Tatsumi, N. (2000) · Acta Haematologica · doi:10.1159/000041041 · Cited by 4
Elevated Systemic Interleukin-18 in Multiple Injured Patients Is Not Related to Clinical Outcome
Roetman, B., Schinkel, C., Wick, M. R., Frangen, T. M., Muhr, G., & Köller, M. (2008) · Journal of Interferon & Cytokine Research · doi:10.1089/jir.2008.0029 · Cited by 4
The Effects of Immune Cell Products (Cytokines and Hematopoietic Cell Growth Factors) on Bone Cells
Lorenzo, J. (2010) · Elsevier eBooks · doi:10.1016/b978-0-12-375670-1.10007-x · Cited by 4
Hormonal Regulation of Bone Remodeling
Ng, K. W., & Martin, T. J. (1998) · Advances in organ biology · doi:10.1016/s1569-2590(08)60108-1 · Cited by 4
Self-citationSellin, M., Koentopp, L. M., Bader, R., & Jonitz‐Heincke, A. (2025) · Cell Biology and Toxicology · doi:10.1007/s10565-025-10087-7 · Cited by 3
“Osteoblasts are able to secrete IL-18, and they can also respond to IL-18 via IL-18-Receptor (Udagawa et al. 1997; Cornish et al. 2003).”
Leveraging mice with diverse microbial exposures for advances in osteoimmunology
Little, S. E., & Hamilton, S. E. (2023) · Frontiers in Endocrinology · doi:10.3389/fendo.2023.1168552 · Cited by 3
Osteoclastic Bone Resorption: Normal and Pathological
Schepetkin, I. A. (1997) · Annals of the New York Academy of Sciences · doi:10.1111/j.1749-6632.1997.tb46246.x · Cited by 3
Cytokines and the Pathogenesis of Osteoporosis
Lorenzo, J. (2013) · Elsevier eBooks · doi:10.1016/b978-0-12-415853-5.00038-8 · Cited by 3
Molecules Regulating Macrophage Fusions
Miyamoto, T. K., & Suda, T. (2010) · Springer eBooks · doi:10.1007/978-90-481-9772-9_11 · Cited by 3
Kusumoto, K., Murakami, Y., Otsuki, M., Kanayama, M., Takeuchi, S., & Takahashi, S. (2005) · ZOOLOGICAL SCIENCE · doi:10.2108/zsj.22.1003 · Cited by 3
“…al. , 1998), keratinocytes (Stoll et al. , 1997; Kämpfer et al. , 1999), intestinal epithelial cells (Takeuchi et al. , 1997), osteoblasts (Udagawa et al. , 1997), chondrocytes (Olee et al. , 1999), adrenal cortex cells (Conti et al. , 1997; Sugama et al. , 2000), astrocytes and microglia…”
The mucosal inflammatory response. Cytokines and chemokines
Cominelli, F., Arseneau, K. O., & Pizarro, T. T. (2007) · Springer eBooks · doi:10.1007/0-387-25808-6_7 · Cited by 2
“However, since there was no evidence that IGIF binds to the IL-1 receptor type I (IL-IRI) [45], the signaling receptor for IL-1, the name IL-18 was finally chosen [43].”
BackgroundSun, H. (2004) · Chinese Science Bulletin · doi:10.1360/03wc0099 · Cited by 3
Lerner, U. H. (2020) · Elsevier eBooks · doi:10.1016/b978-0-12-801238-3.11202-4 · Cited by 3
The mucosal inflammatory response. Cytokines and chemokines
Cominelli, F., Arseneau, K. O., & Pizarro, T. T. (2003) · Springer eBooks · doi:10.1007/978-1-4020-3477-0_7 · Cited by 3
Role of Cytokines in Bone Diseases and Their Therapeutic Application
Guha, A., Wahi, P., & Lal, G. (2026) · ImmunoTargets and Therapy · doi:10.2147/itt.s604392 · Cited by 2
Protective effects of IL18-105G > A and IL18-137C > G genetic variants on severity of COVID-19
Mori, M. T. E., Simão, A. N. C., Danelli, T., Oliveira, S. R., Cassela, P. L. C. S., Trigo, G. L., Cardoso, K. M., Tejo, A. M., Tano, Z. N., de Almeida, E. R. D., et al. (2023) · Cytokine · doi:10.1016/j.cyto.2023.156476 · Cited by 2
Circulating cytokines levels and osteoarthritis: A Mendelian randomization study
Xie, J., Wan, X., Yang, M., Yu, H., Hao, J., Xu, K., Wang, J., & Xu, P. (2024) · Cytokine · doi:10.1016/j.cyto.2024.156625 · Cited by 3
Novel Cytokines in the Treatment of Malignancies
Parihar, R., & Carson, W. E. (2005) · Cancer treatment and research · doi:10.1007/0-387-24361-5_15 · Cited by 2
Commentary Cytokines and direct cell contact in synovitis: relevance to therapeutic intervention
Dayer, J., & Burger, D. (1999) · Cited by 2
The protective role of interleukin-18 in Salmonella infection
Pascual, D. W. (2001) · Current Opinion in Infectious Diseases · doi:10.1097/00001432-200106000-00004 · Cited by 2
Hofstetter, W., & Gillespie, M. T. (2002) · Elsevier eBooks · doi:10.1016/b978-012098652-1.50154-2 · Cited by 3
Self-citationSchleiter, K. E. (2007) · PubMed · Cited by 2
Skeleton, Inflammatory Diseases of
Aeberli, D. (2014) · Elsevier eBooks · doi:10.1016/b978-0-12-801238-3.00026-x · Cited by 1
Relationship Between IL-18 and Bone Metastasis in Female Breast Cancer
Nayır, E. (2016) · Turkish Journal of Oncology · doi:10.5505/tjo.2016.1289 · Cited by 1
“[10] IL-18 exerts its effects on osteoblasts, not via production of INF-y, but rather via production of granulocyte macrophage colony-stimulating factor (GM-CSF).[11] Increased GM-CSF also induces dose-related increases in the proliferation rate of human osteoblasts.”
BackgroundInterleukin-1 Superfamily and Cancer
Yuzhalin, A. E., & Kutikhin, A. G. (2014) · Elsevier eBooks · doi:10.1016/b978-0-12-801121-8.00002-6 · Cited by 1
Tumor-Bone Cell Interactions in Bone Metastases
Fournier, P. G. J., Dunn, L. K., Clines, G. A., & Guise, T. A. (2010) · Elsevier eBooks · doi:10.1016/b978-0-12-374895-9.00002-5 · Cited by 1
Pathogenesis in Rheumatoid Arthritis: Cytokines
Hueber, A. J., & McInnes, I. B. (2009) · Elsevier eBooks · doi:10.1016/b978-032305475-1.50029-x · Cited by 1
Tooth movement and mechanical stress -Role of osteocytes and osteoimmune factor-
Takano‐Yamamoto, T. (2016) · 日本歯周病学会会誌 · doi:10.2329/perio.58.213 · Cited by 1
Mambelli-Lisboa, N. C., Frare, E. O., Neves, A. D. C., da Silva, Á. R. D. B. P., & Kerkis, I. (2020) · Cell Biology International · doi:10.1002/cbin.11317 · Cited by 1
“Several studies suggested that IFN‐γ in vitro inhibits murine osteoclast formation (Udagawa et al., 1997; Fox and Chambers, 2000), whereas others showed induction of osteoclastogenesis by this factor (Kong et al., 1999; Horwood et al., 2001).”
Cytokines and the pathogenesis of osteoporosis
Lorenzo, J. (2020) · Elsevier eBooks · doi:10.1016/b978-0-12-813073-5.00033-2 · Cited by 1
Breast cancer secreted factors alter the bone microenvironment
Siclari, V. A., Guise, T. A., & Chirgwin, J. M. (2007) · Cancer metastasis · doi:10.1007/978-1-4020-5867-7_12 · Cited by 1
The role of TH17 cells in a model of rheumatoid arthritis
Patakas, A. (2011) · Enlighten: Theses (The University of Glasgow) · Cited by 1
Gerdes, N. (2005) · Kölner Universitäts PublikationsServer (Universität zu Köln) · Cited by 1
Effects of the Interleukin-1 Cytokine Family on Bone
Schett, G. A. (2012) · Springer eBooks · doi:10.1007/978-1-4614-5366-6_12
Dinarello, C. A. (2002) · Springer eBooks · doi:10.1007/978-3-642-57210-4_6
Modulation of pro-inflammatory cytokines in normal and inflamed skin
Companjen, A. R. (2001) · EUR Research Repository (Erasmus University Rotterdam)
Chapter 22. Cytokines in T Cell Maturation
Ghayur, T., & Banerjee, S. (1999) · Annual reports in medicinal chemistry · doi:10.1016/s0065-7743(08)60584-9
Barnes, C. L. T. (2006) · Europe PMC (PubMed Central)
Klimkiewicz-Blok, D., & Zalewski, J. (2012)
Faist, E., Schinkel, C., & Kim, C. (2000) · Springer eBooks · doi:10.1007/978-1-4612-1222-5_53
Role of Adrenomedullin in Breast Cancer Bone Metastasis and Chemoresistance
Siclari, V. A. (2007) · Defense Technical Information Center (DTIC) · doi:10.21236/ada470977
Feige, K., Stadler, P. F., Sieme, H., & Ohnesorge, B. (2012)
Klimkiewicz-Blok, D., Florjański, J., Zalewski, J., & Blok, R. (2012) · PubMed
Chambers, T. J. (2003) · Handbook of experimental pharmacology · doi:10.1007/978-3-642-55742-2_19
Self-citationKurimoto, M. (2000) · Birkhäuser Basel eBooks · doi:10.1007/978-3-0348-8456-3_5
Self-citationFitzgerald, K. A., O'Neill, L. A. J., Gearing, A. J. H., & Callard, R. E. (2001) · Elsevier eBooks · doi:10.1016/b978-012155142-1/50023-3
Protective effects of IL18-105G>A and IL18-137C>G genetic variants on severity of COVID-19Preprint
Mori, M. T. E., Simão, A. N. C., Danelli, T., Oliveira, S. R., Cassela, P. L. C. S., Trigo, G. L., Cardoso, K. D. M., Tejo, A. M., Tano, Z. N., de Almeida, E. R. D., et al. (2023) · Research Square · doi:10.21203/rs.3.rs-3350276/v1
Immunomodulation of Bone Remodeling in Osteoporosis
Hazra, S., Chattopadhyay, S., & Goswami, R. (2023) · IntechOpen eBooks · doi:10.5772/intechopen.1003281
Madel, M. (2019) · theses.fr (ABES) · doi:10.70675/773b4f46z7ed0z41a4za5f0z34c41007df0c
Innate response cytokines in inflammatory synovitis: interleukin-15 and interleukin-18
Gracie, J. A., Jongbloed, S. L., Wilson, H., & McInnes, I. B. (2004) · Birkhäuser Basel eBooks · doi:10.1007/978-3-0348-7883-8_6
Metadata
- Authors
- Udagawa, N., Horwood, N. J., Elliott, J., Mackay, A., Owens, J., Okamura, H., Kurimoto, M., Chambers, T. J., Martin, T. J., & Gillespie, M. T.
- Affiliations
- Hyogo Medical University (JP)
- Venue
- The Journal of Experimental Medicine
- Publisher
- Rockefeller University Press
- Published
- 1997-03-17
- Volume
- 185
- Issue
- 6
- Pages
- 1005-1012
- ISSN
- 0022-1007 (ISSN-L)
- 1540-9538
- PMC
- PMC2196233
- OpenAlex
- W2119656862
- Cited by
- 378
- References
- 35
- Citations by year
- 2026: 1 · 2025: 2 · 2024: 5 · 2023: 7 · 2022: 2 · 2021: 6 · 2020: 7 · 2019: 3 · 2018: 3 · 2017: 4 · 2016: 7 · 2015: 3 · 2014: 10 · 2013: 9 · 2012: 13
- FWCI
- 9.02
- Type
- journal article
- Language
- en
- Open access
- green
- www.ncbi.nlm.nih.gov
- Licence
- cc-by-nc-sa
- Locations
- The Journal of Experimental Medicine (publishedVersion)
- PubMed Central (publishedVersion, cc-by-nc-sa)
- PubMed (publishedVersion)
- St George's Online Research Archive (St George's University of London) (acceptedVersion)
- Minerva Access (University of Melbourne) (submittedVersion, cc-by-nc-sa)
- UEA Digital Repository (University of East Anglia) (submittedVersion)
- Topics
- Life Sciences › Biochemistry, Genetics and Molecular Biology › Molecular Biology › Bone Metabolism and Diseases
- Health Sciences › Medicine › Rheumatology › Rheumatoid Arthritis Research and Therapies
- Health Sciences › Medicine › Rheumatology › Osteomyelitis and Bone Disorders Research
- Keywords
- IL-18, osteoblasts, osteoclastogenesis, osteoclast-like multinucleated cells, GM-CSF, interferon-gamma, bone remodeling, osteoclastogenesis inhibition
- MeSH terms
- Interferon gamma Receptor, Animals, Animals, Newborn, Base Sequence, Bone Marrow Cells, Cell Differentiation, Interferon-gamma, Male, Mice, Inbred C57BL, Molecular Sequence Data, Osteoblasts, Osteoclasts, Recombinant Proteins, RNA, Messenger, Transcription, Genetic, Polymerase Chain Reaction, Granulocyte-Macrophage Colony-Stimulating Factor, Cytokines, Interleukin-11, Receptors, Interferon, Mice, Knockout, Coculture Techniques, Interleukin-18, Mice
About these checks
Registry, retraction, Cites and statistics results are computed, not judged, with one exception: a printed reference that no index lists is read once by a model before it counts as a citation error. Claims are extracted by a model and kept only when their quote appears verbatim in the text; each cited source is then checked, with a model’s help, for whether it says what the claim relies on. Those verdicts can be wrong — read the claim’s quote and the cited source before relying on one.
Statistics and arithmetic are recomputed, not judged.
Confidence bands are shown only for fields calibrated on our annotated test set. None is calibrated yet, so no band is shown.
What counts as a claim ›How we measure confidence ›How we check this ›
Are you an author, or do you see a problem with this page? Request a review
