

The DOI matches its Crossref record; 68 of the 70 references it cites were found in a registry or an index.
Nf1 Regulates Hematopoietic Progenitor Cell Growth and Ras Signaling in Response to Multiple Cytokines
Open accessAbstract
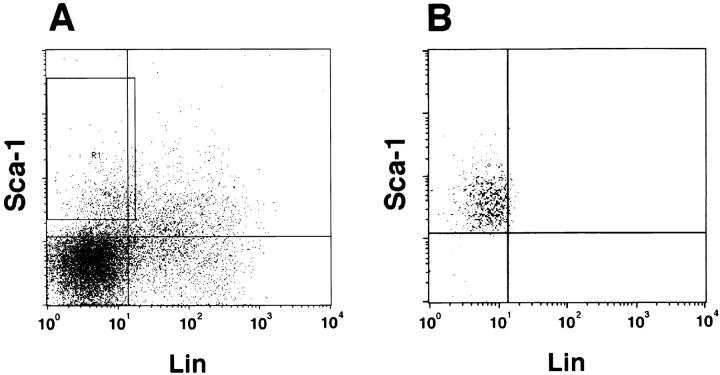
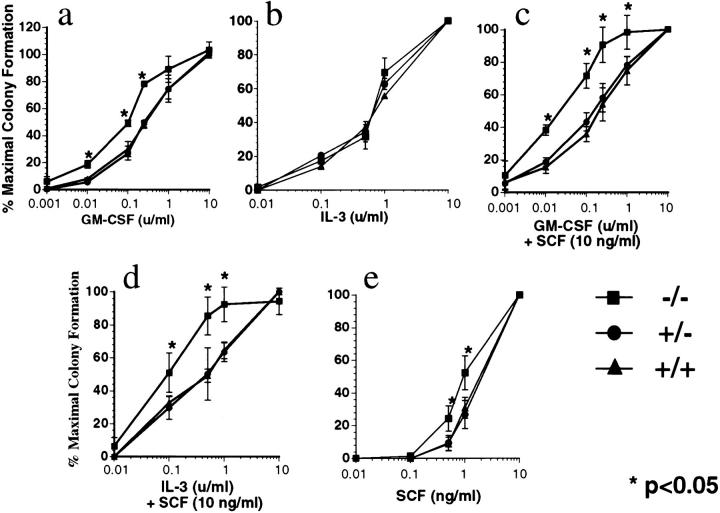
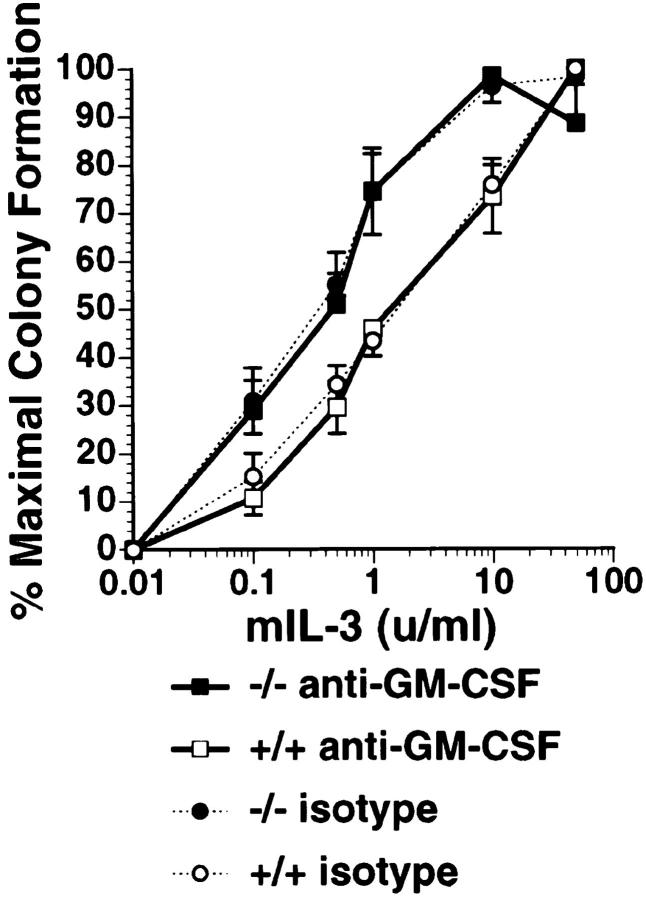
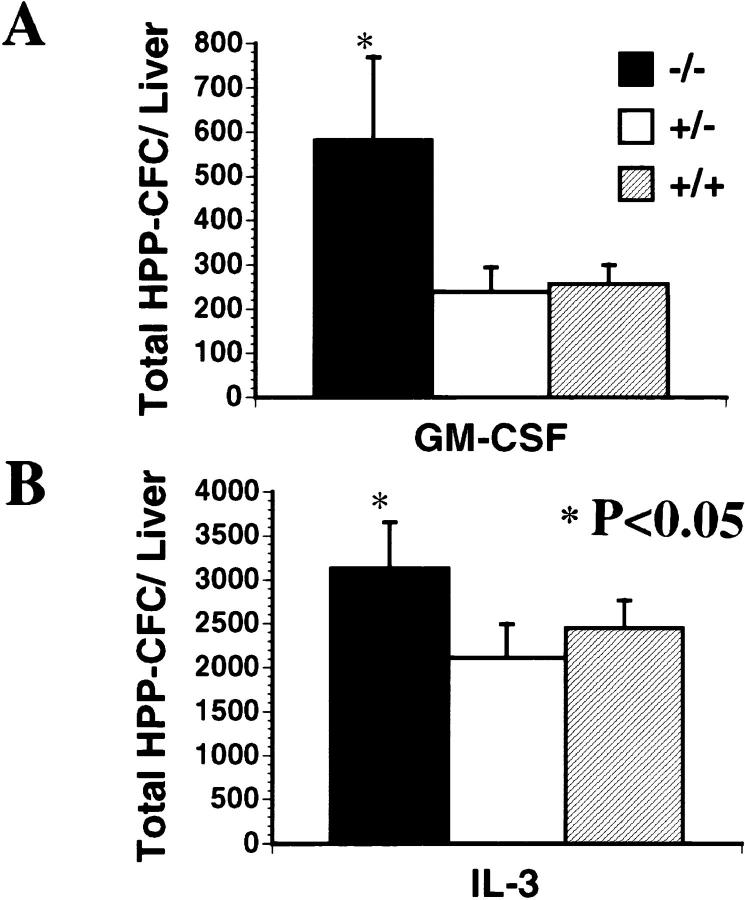
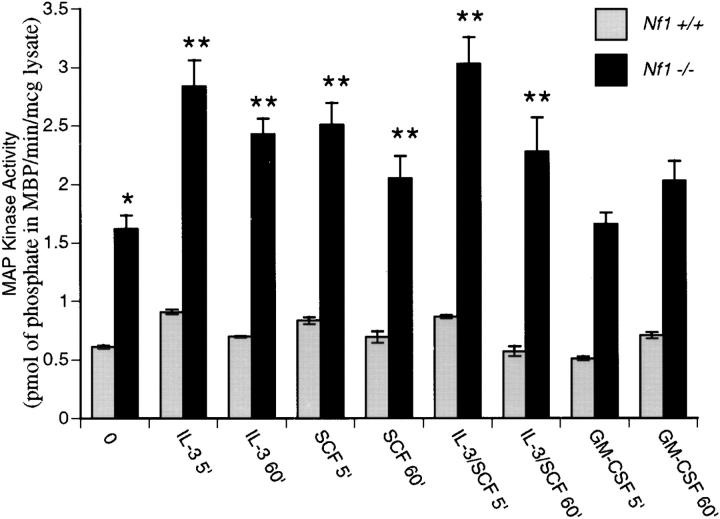
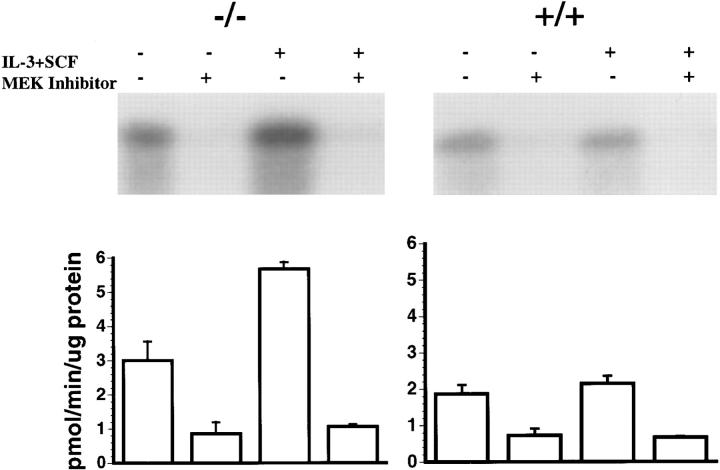
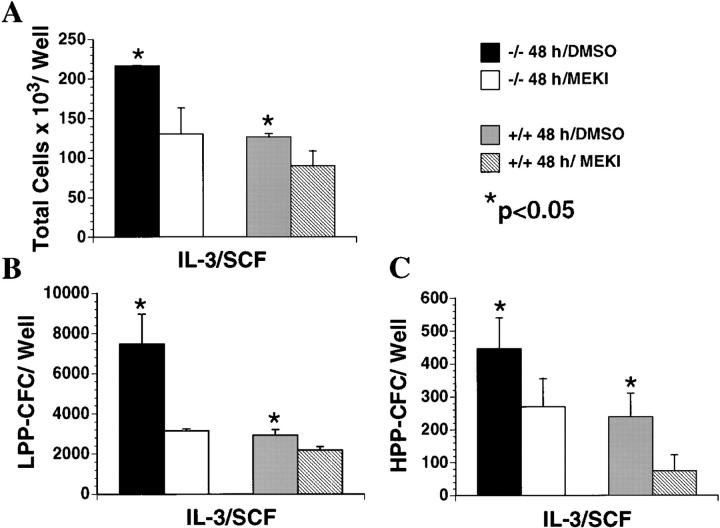
Neurofibromin, the protein encoded by the NF1 tumor-suppressor gene, negatively regulates the output of p21ras (Ras) proteins by accelerating the hydrolysis of active Ras-guanosine triphosphate to inactive Ras-guanosine diphosphate. Children with neurofibromatosis type 1 (NF1) are predisposed to juvenile chronic myelogenous leukemia (JCML) and other malignant myeloid disorders, and heterozygous Nf1 knockout mice spontaneously develop a myeloid disorder that resembles JCML. Both human and murine leukemias show loss of the normal allele. JCML cells and Nf1−/− hematopoietic cells isolated from fetal livers selectively form abnormally high numbers of colonies derived from granulocyte-macrophage progenitors in cultures supplemented with low concentrations of granulocyte-macrophage colony stimulating factor (GM-CSF). Taken together, these data suggest that neurofibromin is required to downregulate Ras activation in myeloid cells exposed to GM-CSF. We have investigated the growth and proliferation of purified populations of hematopoietic progenitor cells isolated from Nf1 knockout mice in response to the cytokines interleukin (IL)-3 and stem cell factor (SCF), as well as to GM-CSF. We found abnormal proliferation of both immature and lineage-restricted progenitor populations, and we observed increased synergy between SCF and either IL-3 or GM-CSF in Nf1−/− progenitors. Nf1−/− fetal livers also showed an absolute increase in the numbers of immature progenitors. We further demonstrate constitutive activation of the Ras-Raf-MAP (mitogen-activated protein) kinase signaling pathway in primary c-kit+ Nf1−/− progenitors and hyperactivation of MAP kinase after growth factor stimulation. The results of these experiments in primary hematopoietic cells implicate Nf1 as playing a central role in regulating the proliferation and survival of primitive and lineage-restricted myeloid progenitors in response to multiple cytokines by modulating Ras output.
Overview
The claims and statistics of this paper haven’t been checked yet.
Run the check — free, no account needed. It reads the open-access text and checks the sources it cites.
Integrity signals
Registry
Cites
Statistics
Figures
Verification
Claims the paper makes
The claims and statistics of this paper haven’t been checked yet.
Run the check — free, no account needed. It reads the open-access text and checks the sources it cites.
Claims other papers make about this one
Each is checked against this paper’s own text: does it say what the citing paper says it does?
The cited source says what the claim attributes to it.
In the citing paper
“Consistent with this, Nf1 deficiency induces a myeloproliferative disorder in murine models (8,9).”
Self-check
Percentages, sums and reported differences re-computed from the paper’s own numbers.
The self-check needs the paper’s full text.
Citations
Cites
ras oncogenes in human cancer: a review.
Bos, J. L. (1989) · PubMed · Cited by 5,061
Marshall, C. J. (1995) · Cell · doi:10.1016/0092-8674(95)90401-8 · Cited by 3,906
The GTPase superfamily: conserved structure and molecular mechanism
Bourne, H. R., Sanders, D. A., & McCormick, F. (1991) · Nature · doi:10.1038/349117a0 · Cited by 3,392
A synthetic inhibitor of the mitogen-activated protein kinase cascade.
Dudley, D. T., Pang, L., Decker, S. J., Bridges, A. J., & Saltiel, A. R. (1995) · Proceedings of the National Academy of Sciences · doi:10.1073/pnas.92.17.7686 · Cited by 2,679
The GTPase superfamily: a conserved switch for diverse cell functions
Bourne, H. R., Sanders, D. A. R., & McCormick, F. P. (1990) · Nature · doi:10.1038/348125a0 · Cited by 2,336
Proteins regulating Ras and its relatives
Boguski, M. S., & McCormick, F. P. (1993) · Nature · doi:10.1038/366643a0 · Cited by 1,905
SH2 and SH3 Domains: Elements that Control Interactions of Cytoplasmic Signaling Proteins
Koch, C. A., Anderson, D. H., Moran, M. F., Ellis, C. A., & Pawson, T. J. (1991) · Science · doi:10.1126/science.1708916 · Cited by 1,868
Zsebo, K. M., Williams, D. A., Geissler, E. N., Broudy, V. C., Martin, F. H., Atkins, H. L., Hsu, R.-Y., Birkett, N. C., Okino, K. H., Murdock, D. C., et al. (1990) · Cell · doi:10.1016/0092-8674(90)90302-u · Cited by 1,387
The neurofibromatosis type 1 gene encodes a protein related to GAP
Xu, G., O'Connell, P., Viskochil, D., Cawthon, R., Robertson, M., Culver, M., Dunn, D., Stevens, J., Gesteland, R., White, R., et al. (1990) · Cell · doi:10.1016/0092-8674(90)90024-9 · Cited by 1,095
Transcriptional Regulation by Extracellular signals: Mechanisms and Specificity
Hill, C. S., & Treisman, R. (1995) · Cell · doi:10.1016/0092-8674(95)90403-4 · Cited by 1,012
Research works printed but not linked: 2
- Bos, 1989, rasoncogenes in human cancer: a review, Cancer Res, 49, 4682
- Rodenhuis, 1992, rasand human tumors, Semin Cancer Biol, 3, 241
Cited by
Sorted by citations
Items 101–150 of 150
Hodgdon, K. E., Hingtgen, C. M., & Nicol, G. D. (2012) · Neuroscience · doi:10.1016/j.neuroscience.2011.12.045 · Cited by 19
Yzaguirre, A. D., Padmanabhan, A., de Groh, E. D., Engleka, K. A., Li, J., Speck, N. A., & Epstein, J. A. (2015) · eLife · doi:10.7554/elife.07780 · Cited by 20
Pak2 regulates myeloid-derived suppressor cell development in mice
Zeng, Y., Hahn, S., Stokes, J., Hoffman, E. A., Schmelz, M., Proytcheva, M. A., Chernoff, J., & Katsanis, E. (2017) · Blood Advances · doi:10.1182/bloodadvances.2017007435 · Cited by 19
North, M. R., Shuga, J., Fromowitz, M., Loguinov, A. V., Shannon, K., Zhang, L., Smith, M. T., & Vulpe, C. D. (2014) · BMC Cancer · doi:10.1186/1471-2407-14-6 · Cited by 17
Self-citationSachs, Z., Been, R. A., DeCoursin, K. J., Nguyen, H. T., Hassan, N. A. M., Noble-Orcutt, K. E., Eckfeldt, C. E., Pomeroy, E. J., Díaz-Flores, E., Geurts, J. L., et al. (2016) · Haematologica · doi:10.3324/haematol.2015.136002 · Cited by 17
Self-citationNf1 haploinsufficiency and Icsbp deficiency synergize in the development of leukemias
Koenigsmann, J., Rudolph, C., Sander, S., Kershaw, O., Gruber, A. D., Bullinger, L., Schlegelberger, B., & Carstanjen, D. (2009) · Blood · doi:10.1182/blood-2008-05-158485 · Cited by 17
Prospective of Ras signaling in stem cells
Chakrabarty, K., & Heumann, R. (2008) · Biological Chemistry · doi:10.1515/bc.2008.104 · Cited by 16
Kraniak, J. M., Sun, D., Mattingly, R. R., Reiners, J. J., & Tainsky, M. A. (2010) · Molecular and Cellular Biochemistry · doi:10.1007/s11010-010-0551-1 · Cited by 15
Leukemic potential of doubly mutant Nf1 andWv hematopoietic cells
Ingram, D. A., Wenning, M. J., Shannon, K., & Clapp, D. W. (2003) · Blood · doi:10.1182/blood-2002-08-2635 · Cited by 15
Self-citationSPRED proteins provide a NF-ty link to Ras suppressionPreprint
McClatchey, A. I., & Cichowski, K. M. (2012) · Genes & Development · doi:10.1101/gad.197434.112 · Cited by 15
Modeling myeloid leukemia tumor suppressor gene inactivation in the mouse
Shannon, K., Beau, M. M. L., Largaespada, D. A., & Killeen, N. P. (2001) · Seminars in Cancer Biology · doi:10.1006/scbi.2001.0372 · Cited by 15
Self-citationRole of PTPN11 (SHP2) in Cancer
Chan, G., & Neel, B. G. (2016) · Springer eBooks · doi:10.1007/978-1-4939-3649-6_4 · Cited by 13
Nebesio, T. D., Ming, W., Shi, C., Clegg, T., Yuan, J., Yang, Y., Estwick, S. A., Li, Y., Li, X., Hingtgen, C. M., et al. (2007) · Glia · doi:10.1002/glia.20482 · Cited by 12
Genetics of Neurofibromatosis 1-Associated Peripheral Nerve Sheath Tumors
Stephens, K. G. (2003) · Cancer Investigation · doi:10.1081/cnv-120025093 · Cited by 12
Neurological malignancies in neurofibromatosis type 1
Eoli, M., Saletti, V., & Finocchiaro, G. (2019) · Current Opinion in Oncology · doi:10.1097/cco.0000000000000576 · Cited by 10
Farrer, R. G., Farrer, J., & DeVries, G. H. (2013) · Journal of Biological Chemistry · doi:10.1074/jbc.m112.442244 · Cited by 9
Rojas, J. M., & Santos, E. (2006) · Springer eBooks · doi:10.1007/1-4020-4708-8_2 · Cited by 8
Wehbe, Z., Ghanjati, F., & Flotho, C. (2021) · Cells · doi:10.3390/cells10092335 · Cited by 8
Hingtgen, C. M. (2008) · PubMed · Cited by 7
Neurofibromatosis type 1: II. Answers from animal models
Lakkis, M. M., & Tennekoon, G. I. (2001) · Journal of Neuroscience Research · doi:10.1002/jnr.1142 · Cited by 7
Recent Advancement of Neurofibromatosis Type 1: A Narrative Review
Huang, P.-Y., Society for Neurological Rare Disorders-Taiwan, & Lee, M.-J. (2025) · Acta Neurologica Taiwanica · doi:10.4103/ant.ant-d-24-00042 · Cited by 5
Wiesner, S. M., Geurts, J. L., Diers, M. D., Bergerson, R. J., Hasz, D. E., Morgan, K. J., & Largaespada, D. A. (2011) · American Journal of Hematology · doi:10.1002/ajh.22035 · Cited by 5
Lymphomas in patients with neurofibromatosis type 1 (NF1): another malignancy in the NF1 syndrome?
Fareez, F., Wang, B. H., Brain, I., & Lu, J. (2023) · Pathology · doi:10.1016/j.pathol.2023.01.002 · Cited by 4
Role of nerves in neurofibromatosis type 1-related nervous system tumors
Ge, L., Xing, M., Zhang, H., Li, Q., & Wang, Z. (2022) · Cellular Oncology · doi:10.1007/s13402-022-00723-3 · Cited by 5
Chronic myeloproliferative disorders
Niemeyer, C. M., & Locatelli, F. (2012) · Cambridge University Press eBooks · doi:10.1017/cbo9780511977633.020 · Cited by 3
Molecular profiles of different PD-L1 expression in patients with esophageal squamous cell carcinoma
Zhao, S., Hu, X., Zhou, P., Li, A., Chen, L., Wang, D., He, J., & Jiang, Y. (2023) · Cancer Biology & Therapy · doi:10.1080/15384047.2023.2256927 · Cited by 3
Neurofibromatosis Type I: From Genetic Mutation to Tumor Formation
Thomas, S. L., & Vries, G. H. D. (2008) · Springer eBooks · doi:10.1007/978-0-387-30375-8_6 · Cited by 3
NF1 Mutations in Hematologic Cancers
Chang, T. Y., & Shannon, K. (2012) · Springer eBooks · doi:10.1007/978-3-642-32864-0_30 · Cited by 2
Self-citationKrone, W., & Kehrer‐Sawatzki, H. (2001) · Springer eBooks · doi:10.1007/978-3-642-56889-3_6 · Cited by 2
NF1 and SPRED1/2 cooperate through RAS-MAPK-independent functions
Silva, J. M., Canche, L., Cheng, A. S., Young, L. C., & McCormick, F. (2026) · Proceedings of the National Academy of Sciences · doi:10.1073/pnas.2535319123 · Cited by 1
Yuan, S., Wu, Q., Yin, T., Chen, L. P., Zhang, B., Li, P., Xie, X., Sun, G. Y., Cheng, T., Wei, J., et al. (2026) · Blood Science · doi:10.1097/bs9.0000000000000294 · Cited by 1
Progression and perspectives in disease modeling for Juvenile myelomonocytic leukemia
Fu, S., Guo, Y., Peng, Z., Zhang, D., Chang, Z., Xiao, Y., Zhang, Q., Yu, L., Chen, C., Chen, Y., et al. (2024) · Medical Oncology · doi:10.1007/s12032-024-02549-5 · Cited by 1
Signal Transduction in Mast Cell Migration
Sundström, M. (2001) · Uppsala University Publications (Uppsala University) · Cited by 1
Bernards, A., & McClatchey, A. I. (2001) · Humana Press eBooks · doi:10.1007/978-1-59259-230-2_11 · Cited by 1
Animal Models of Hematopoietic Growth Factor Perturbations in Physiology and Pathology
Lieschke, G. J. (2004) · Humana Press eBooks · doi:10.1007/978-1-59259-747-5_2
Neurofibromatosis and lessons for the war on cancer
Reilly, K. M. (2009) · EMBO Molecular Medicine · doi:10.1002/emmm.200900029
Williams, J. P., Wu, J., Johansson, G., Mukouyama, Y., Cancelas, J. A., & Ratner, N. (2008) · International Journal of Developmental Neuroscience · doi:10.1016/j.ijdevneu.2008.09.056
Tumor Suppressors in Metastasis
Ouatas, T., Hartsough, M. T., & Steeg, P. S. (2001) · Humana Press eBooks · doi:10.1007/978-1-59259-230-2_3
Dissecting Neurofibromatosis Type 1 Related Vasculopathy
Lasater, E. A. (2010) · IUScholarWorks (Indiana University) · doi:10.7912/c2/1788
Potential for Hematopoietic Growth Factor Antagonists in Oncology
Ramshaw, H. S., Hercus, T. R., Olver, I., & Lopez, A. F. (2004) · Humana Press eBooks · doi:10.1007/978-1-59259-747-5_22
Juvenile chronic myelogenous leukemia (JCML)
Hess, J. L. (2011) · Atlas of Genetics and Cytogenetics in Oncology and Haematology · doi:10.4267/2042/37702
to alter murine and human neurofibromatosis type 1-haploinsufficient osteoclast functions
Yang, F., Shi, C., Robling, A. G., Yu, X., Nebesio, T. D., Yan, J., Morgan, T., Li, X., Yuan, J., Hock, J. M., et al. (2006)
Developmental Biology of the Hematopoietic Growth Factors
Yöder, M. C., & Schibler, K. R. (2004) · Elsevier eBooks · doi:10.1016/b978-0-7216-9654-6.50147-8
Short title - Mast cells and the neurofibroma microenvironment
Staser, K. W., Yang, F., & Clapp, D. W. (2016)
A Novel Role for Tid1 in HIF2α Regulation
Burnett, D. (2010) · TSpace (University of Toronto)
Staser, K. W. (2012) · ProQuest Demo Repository · doi:10.7912/c2/1859
Developmental Biology of the Hematopoietic Growth Factors
Schibler, K. R. (2011) · Elsevier eBooks · doi:10.1016/b978-1-4160-3479-7.10142-9
Systemic skewing of peripheral blood leukocyte composition in neurofibromatosis type 1
Nobeyama, Y., Imai, S., Ogawa‐Tominaga, M., & Asahina, A. (2026) · Frontiers in Immunology · doi:10.3389/fimmu.2026.1849927
Metadata
- Authors
- Zhang, Y.-Y., Vik, T. A., Ryder, J. W., Srour, E. F., Jacks, T., Shannon, K., & Wade Clapp, D.
- Affiliations
- From the *Department of Pediatrics, the ‡Department of Microbiology and Immunology, the §Department of Medicine, and ‖The Herman B. Wells Center for Pediatric Research, Indiana University School of Medicine, Indianapolis, Indiana 46202; the ¶Howard Hughes Medical Institute and Center for Cancer Research, Massachusetts Institute of Technology, Cambridge, Massachusetts 02139; and the **Department of Pediatrics, University of California San Francisco, San Francisco, California 94143
- Howard Hughes Medical Institute (US)
- Venue
- The Journal of Experimental Medicine
- Publisher
- Rockefeller University Press
- Published
- 1998-06-01
- Volume
- 187
- Issue
- 11
- Pages
- 1893-1902
- ISSN
- 0022-1007 (ISSN-L)
- 1540-9538
- PMC
- PMC2212307
- OpenAlex
- W2156597055
- Cited by
- 150
- References
- 70
- Citations by year
- 2026: 3 · 2025: 1 · 2024: 1 · 2023: 3 · 2022: 2 · 2021: 1 · 2020: 2 · 2019: 3 · 2017: 2 · 2016: 4 · 2015: 2 · 2014: 2 · 2013: 3 · 2012: 6
- FWCI
- 6.35
- Type
- journal article
- Language
- en
- Open access
- green
- www.ncbi.nlm.nih.gov
- Licence
- cc-by-nc-sa
- Locations
- The Journal of Experimental Medicine (publishedVersion)
- PubMed Central (publishedVersion, cc-by-nc-sa)
- PubMed (publishedVersion)
- IUScholarWorks (Indiana University) (submittedVersion, cc-by-nc-sa)
- Funders
- National Cancer Institute (R29 CA74177-01, R29CA074177)
- National Institute of Diabetes and Digestive and Kidney Diseases (P50DK049218)
- Topics
- Health Sciences › Medicine › Clinical Neurology › Neurofibromatosis and Schwannoma Cases
- Life Sciences › Biochemistry, Genetics and Molecular Biology › Molecular Biology › Protein Tyrosine Phosphatases
- Health Sciences › Medicine › Hematology › Acute Myeloid Leukemia Research
- Keywords
- neurofibromin, Ras signaling, hematopoietic progenitor cells, juvenile myelomonocytic leukemia, neurofibromatosis type 1, GM-CSF, interleukin-3, stem cell factor, cytokine synergy
- MeSH terms
- Animals, Cell Division, Female, Hematopoietic Stem Cells, Interleukin-3, Macrophages, Male, Mice, Inbred C57BL, Proteins, Signal Transduction, Granulocyte-Macrophage Colony-Stimulating Factor, Proto-Oncogene Proteins p21(ras), Calcium-Calmodulin-Dependent Protein Kinases, Stem Cell Factor, Neurofibromin 1, Mice
About these checks
Registry, retraction, Cites and statistics results are computed, not judged, with one exception: a printed reference that no index lists is read once by a model before it counts as a citation error. Claims are extracted by a model and kept only when their quote appears verbatim in the text; each cited source is then checked, with a model’s help, for whether it says what the claim relies on. Those verdicts can be wrong — read the claim’s quote and the cited source before relying on one.
Statistics and arithmetic are recomputed, not judged.
Confidence bands are shown only for fields calibrated on our annotated test set. None is calibrated yet, so no band is shown.
What counts as a claim ›How we measure confidence ›How we check this ›
Are you an author, or do you see a problem with this page? Request a review
