

The DOI matches its Crossref record; 50 of the 51 references it cites were found in a registry or an index.
Defective Gp130-Mediated Signal Transducer and Activator of Transcription (Stat) Signaling Results in Degenerative Joint Disease, Gastrointestinal Ulceration, and Failure of Uterine Implantation
Open accessAbstract
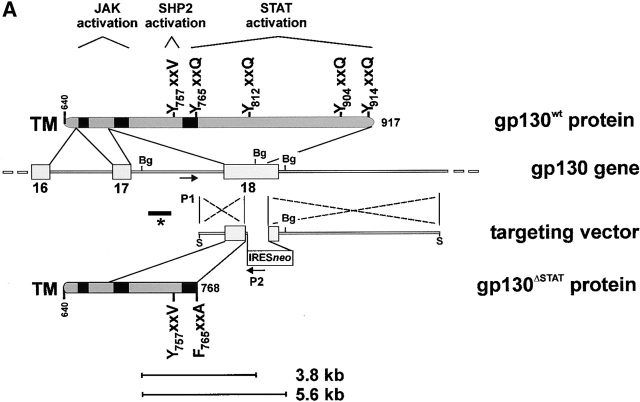
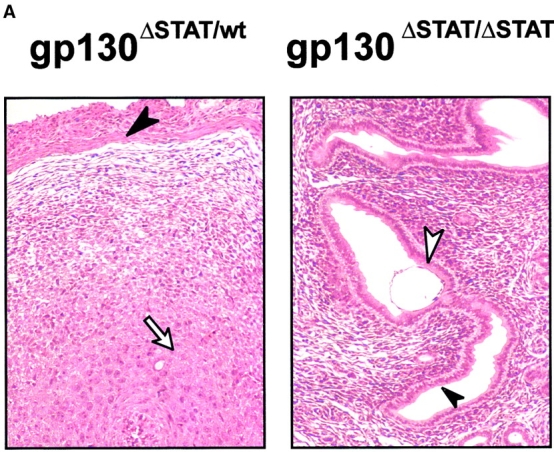
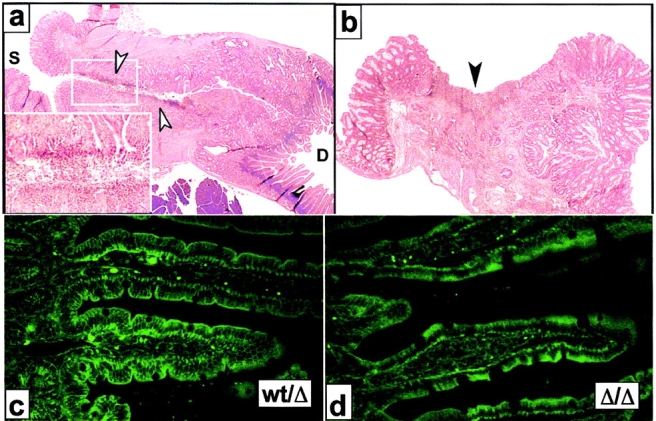
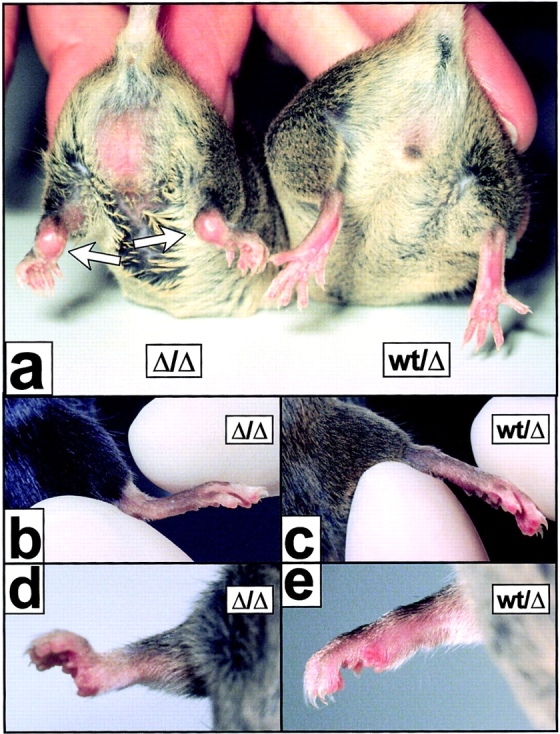
The receptor subunit gp130 transduces multiple cell type–specific activities of the leukemia inhibitory factor (LIF)/interleukin (IL)-6 family of cytokines through the signal transducer and activator of transcription (STAT) and src homology 2 domain–bearing protein tyrosine phosphatase (SHP)-2/ras/Erk pathways. To define STAT-dependent physiological responses, we generated mice with a COOH-terminal gp130ΔSTAT “knock-in” mutation which deleted all STAT-binding sites. gp130ΔSTAT mice phenocopyed mice deficient for IL-6 (impaired humoral and mucosal immune and hepatic acute phase responses) and LIF (failure of blastocyst implantation). However, unlike mice with null mutations in any of the components in the gp130 signaling pathway, gp130ΔSTAT mice also displayed gastrointestinal ulceration and a severe joint disease with features of chronic synovitis, cartilaginous metaplasia, and degradation of the articular cartilage. Mitogenic hyperresponsiveness of synovial cells to the LIF/IL-6 family of cyto-kines was caused by sustained gp130-mediated SHP-2/ras/Erk activation due to impaired STAT-mediated induction of suppressor of cytokine signaling (SOCS) proteins which normally limits gp130 signaling. Therefore, the joint pathology in gp130ΔSTAT mice is likely to arise from the disturbance of the otherwise balanced activation of the SHP-2/ras/Erk and STAT signaling cascades emanating from gp130.
Overview
The claims and statistics of this paper haven’t been checked yet.
Run the check — free, no account needed. It reads the open-access text and checks the sources it cites.
Integrity signals
Registry
Cites
Statistics
Figures
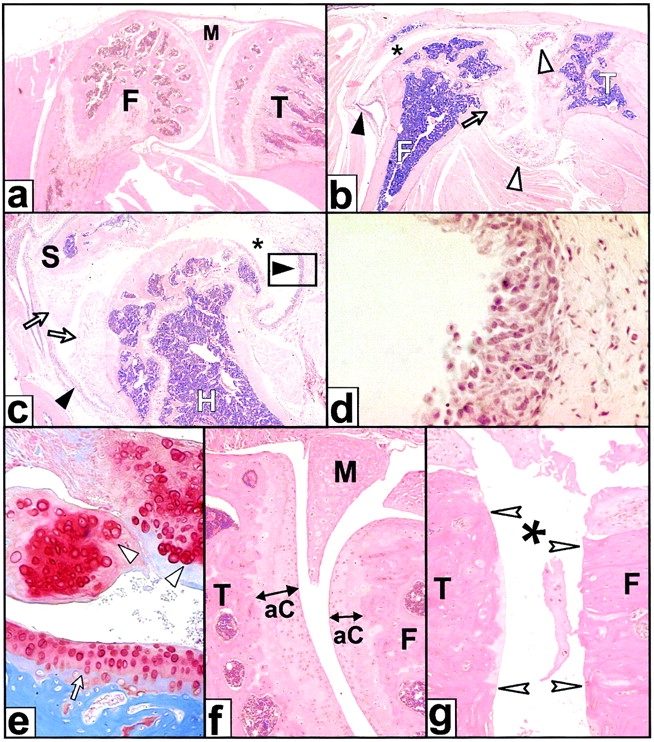
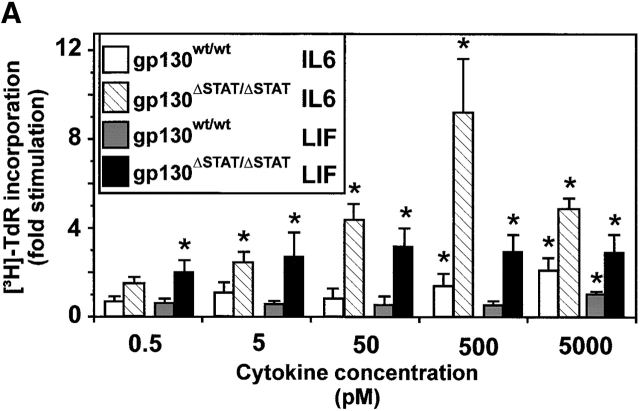
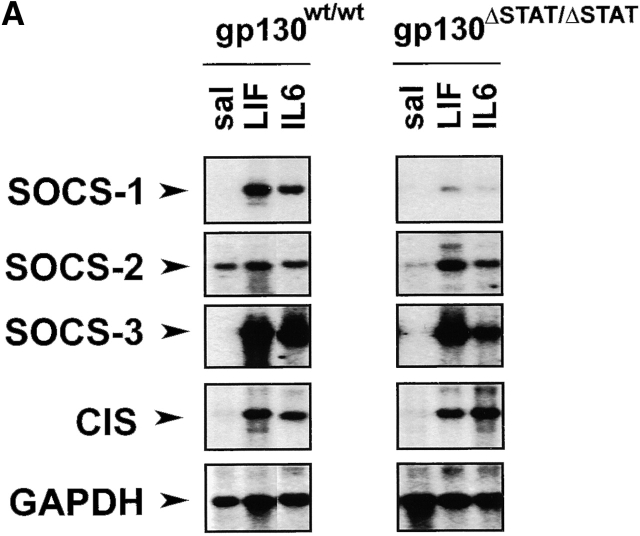
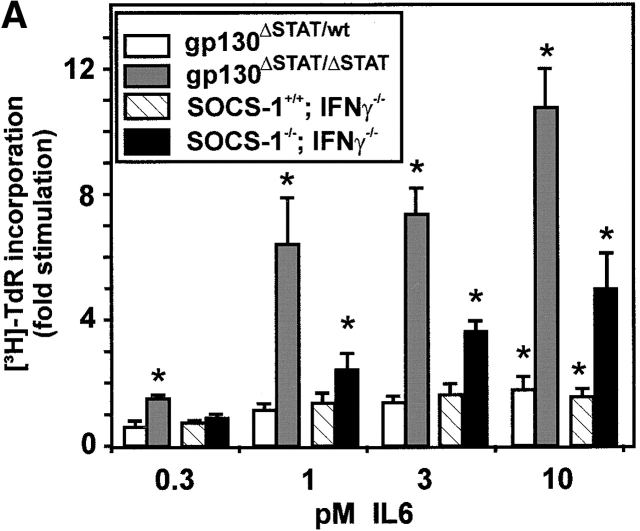
Verification
Claims the paper makes
The claims and statistics of this paper haven’t been checked yet.
Run the check — free, no account needed. It reads the open-access text and checks the sources it cites.
Claims other papers make about this one
Each is checked against this paper’s own text: does it say what the citing paper says it does?
The source backs part of the claim, not all of it — or backs it for a different population, condition or comparison.
In the citing paper
“Similarly, defective STAT3 activation enhances SHP-2–ERK–MAPK activation pathways, most likely through an impaired STAT3-mediated induction of suppressor of cytokine signaling 3 (SOCS3) (111, 112).”
From IL-6 in inflammation, autoimmunity and cancer (2021) · cites this paper as [111]
Experimental — accuracy not yet measured
Self-check
Percentages, sums and reported differences re-computed from the paper’s own numbers.
The self-check needs the paper’s full text.
Citations
Cites
Interleukin-6-type cytokine signalling through the gp130/Jak/STAT pathway
HEINRICH, P. C., BEHRMANN, I., MÜLLER-NEWEN, G., SCHAPER, F., & GRAEVE, L. (1998) · Biochemical Journal · doi:10.1042/bj3340297 · Cited by 2,130
A family of cytokine-inducible inhibitors of signalling
Starr, R., Willson, T. A., Viney, E. M., Murray, L. J. L., Rayner, J. R., Jenkins, B. J., Gonda, T. J., Alexander, W. S., Metcalf, D., Nicola, N. A., et al. (1997) · Nature · doi:10.1038/43206 · Cited by 2,066
Self-citationBlastocyst implantation depends on maternal expression of leukaemia inhibitory factor
Stewart, C. L., Kašpar, P., Brunet, L. J., Bhatt, H., Gadi, I. K., Köntgen, F., & Abbondanzo, S. J. (1992) · Nature · doi:10.1038/359076a0 · Cited by 2,033
Multiple defects of immune cell function in mice with disrupted interferon-gamma genes.
Dalton, D., Pitts-Meek, S., Keshav, S., Figari, I., Bradley, A., & Stewart, T. (1993) · Science · doi:10.1126/science.8456300 · Cited by 2,015
Impaired immune and acute-phase responses in interleukin-6-deficient mice
Kopf, M., Baumann, H., Freer, G., Freudenberg, M., Lamers, M., Kishimoto, T., Zinkernagel, R., Bluethmann, H., & Köhler, G. (1994) · Nature · doi:10.1038/368339a0 · Cited by 1,768 · cited 4×
“Since the phenotype of gp130FxxQ/FxxQ mice is somewhat reminiscent of that observed in LIF-R / (10) and CNTF-R / mice (36), but entirely different to that associated with IL-6 / (4, 5) or IL-11R 1 / mice (8, 9), signaling through the heterodimeric LIF-R /gp130 rather than through homodimeric gp130 appears critical aft…”
BackgroundInfluentialSelf-renewal of pluripotent embryonic stem cells is mediated via activation of STAT3.Preprint
Niwa, H., Burdon, T., Chambers, I., & Smith, A. G. (1998) · Genes & Development · doi:10.1101/gad.12.13.2048 · Cited by 1,673
Kelley, W. N. (1985) · Virtual Defense Library (Ministerio de Defensa) · Cited by 1,641
gp 130 AND THE INTERLEUKIN-6 FAMILY OF CYTOKINES
Taga, T., & Kishimoto, T. (1997) · Annual Review of Immunology · doi:10.1146/annurev.immunol.15.1.797 · Cited by 1,468
Structure and function of a new STAT-induced STAT inhibitor
Naka, T., Narazaki, M., Hirata, M., Matsumoto, T., Minamoto, S., Aono, A., Nishimoto, N., Kajita, T., Taga, T., Yoshizaki, K., et al. (1997) · Nature · doi:10.1038/43219 · Cited by 1,040
Stahl, N., Farruggella, T. J., Boulton, T. G., Zhong, Z., Darnell, J. E., & Yancopoulos, G. D. (1995) · Science · doi:10.1126/science.7871433 · Cited by 979
Alexander, W. S., Starr, R., Fenner, J. E., Scott, C. L., Handman, E., Sprigg, N. S., Corbin, J. E., Cornish, A. L., Darwiche, R., Owczarek, C. M., et al. (1999) · Cell · doi:10.1016/s0092-8674(00)80047-1 · Cited by 762
Self-citationFukada, T., Hibi, M., Yamanaka, Y., Takahashi-Tezuka, M., Fujitani, Y., Yamaguchi, T., Nakajima, K., & Hirano, T. (1996) · Immunity · doi:10.1016/s1074-7613(00)80501-4 · Cited by 652
Crofford, L. J., Wilder, R. L., Ristimaki, A. P., Sano, H., Remmers, E. F., Epps, H. R., & Hla, T. (1994) · Journal of Clinical Investigation · doi:10.1172/jci117060 · Cited by 650
Yoshida, K., Taga, T., Saito, M., Suematsu, S., Kumanogoh, A., Tanaka, T., Fujiwara, H., Hirata, M., Yamagami, T., Nakahata, T., et al. (1996) · Proceedings of the National Academy of Sciences · doi:10.1073/pnas.93.1.407 · Cited by 634
Ware, C. B., Horowitz, M. C., Renshaw, B. R., Hunt, J. S., Liggitt, D., Koblar, S. A., Gliniak, B., McKenna, H. J., Papayannopoulou, T., Thoma, B., et al. (1995) · Development · doi:10.1242/dev.121.5.1283 · Cited by 589
IgG1 plasmacytosis in interleukin 6 transgenic mice
Suematsu, S., Matsuda, T., Aozasa, K., Akira, S., Nakano, N., Ohno, S., Miyazaki, J., Yamamura, K., Hirano, T., & Kishimoto, T. (1989) · Proceedings of the National Academy of Sciences · doi:10.1073/pnas.86.19.7547 · Cited by 586
Sano, S., Itami, S., Takeda, K., Tarutani, M., Yamaguchi, Y., Miura, H., Yoshikawa, K., Akira, S., & Takeda, J. (1999) · The EMBO Journal · doi:10.1093/emboj/18.17.4657 · Cited by 519
Robb, L., Li, R., Hartley, L., Nandurkar, H. H., Köentgen, F., & Begley, C. G. (1998) · Nature Medicine · doi:10.1038/nm0398-303 · Cited by 468
Nicholson, S. E., De Souza, D., Fabri, L. J., Corbin, J., Willson, T. A., Zhang, J.-G., Silva, A., Asimakis, M., Farley, A., Nash, A. D., et al. (2000) · Proceedings of the National Academy of Sciences · doi:10.1073/pnas.100135197 · Cited by 456
The role of interleukin-6 in mucosal IgA antibody responses in vivo
Ramsay, A. J., Husband, A. J., Ramshaw, L. A., Bao, S., Matthaei, K. I., Koehler, G., & Kopf, M. (1994) · Science · doi:10.1126/science.8160012 · Cited by 454
Self-citationNicholson, S. E., Willson, T. A., Farley, A., Starr, R., Zhang, J., Baca, M., Alexander, W. S., Metcalf, D., Hilton, D. J., & Nicola, N. A. (1999) · The EMBO Journal · doi:10.1093/emboj/18.2.375 · Cited by 407
Self-citationDechiara, T., Vejsada, R., Poueymirou, W., Acheson, A., Suri, C., Conover, J., Friedman, B., Mcclain, J., Pan, L., Stahl, N., et al. (1995) · Cell · doi:10.1016/0092-8674(95)90172-8 · Cited by 395
Interleukin-11: Review of Molecular, Cell Biology, and Clinical Use
Du, X., & Williams, D. A. (1997) · Blood · doi:10.1182/blood.v89.11.3897 · Cited by 392
Escary, J.-L., Perreau, J., Dumènil, D., Ezine, S., & Brûlet, P. (1993) · Nature · doi:10.1038/363361a0 · Cited by 363
Ohtani, T., Ishihara, K., Atsumi, T., Nishida, K., Kaneko, Y., Miyata, T., Itoh, S., Narimatsu, M., Maeda, H., Fukada, T., et al. (2000) · Immunity · doi:10.1016/s1074-7613(00)80162-4 · Cited by 284
Saito, M., Yoshida, K., Hibi, M., Taga, T., & Kishimoto, T. (1992) · The Journal of Immunology · doi:10.4049/jimmunol.148.12.4066 · Cited by 282
Betz, U. A. K., Bloch, W., van den Broek, M. F., Yoshida, K., Taga, T., Kishimoto, T., Addicks, K., Rajewsky, K., & Müller, W. (1998) · The Journal of Experimental Medicine · doi:10.1084/jem.188.10.1955 · Cited by 218
Yamanaka, Y., Nakajima, K., Fukada, T., Hibi, M., & Hirano, T. (1996) · The EMBO Journal · doi:10.1002/j.1460-2075.1996.tb00500.x · Cited by 213
Mihara, M., Moriya, Y., Kishimoto, T., & Ohsugi, Y. (1995) · Lara D. Veeken · doi:10.1093/rheumatology/34.4.321 · Cited by 198
Maternal IL-11Rα function is required for normal decidua and fetoplacental development in micePreprint
Bilinski, P., Roopenian, D. C., & Gossler, A. (1998) · Genes & Development · doi:10.1101/gad.12.14.2234 · Cited by 185
Dong, F., Hoefsloot, L. H., Schelen, A. M., Broeders, C. A., Meijer, Y., Veerman, A. J. P., Touw, I. P., & Löwenberg, B. (1994) · Proceedings of the National Academy of Sciences · doi:10.1073/pnas.91.10.4480 · Cited by 175
Distinct roles for the NF-κB1 (p50) and c-Rel transcription factors in inflammatory arthritis
Campbell, I. K., Gerondakis, S., O’Donnell, K., & Wicks, I. P. (2000) · Journal of Clinical Investigation · doi:10.1172/jci8298 · Cited by 168
Self-citationDittrich, E., Haft, C. R., Muys, L., Heinrich, P. C., & Graeve, L. (1996) · Journal of Biological Chemistry · doi:10.1074/jbc.271.10.5487 · Cited by 160
Bousquet, C., Susini, C., & Melmed, S. K. (1999) · Journal of Clinical Investigation · doi:10.1172/jci7924 · Cited by 103
Osteoclasts Are Present in gp130-Deficient Mice
Kawasaki, K., Gao, Y., Yokose, S., Kaji, Y., Nakamura, T., Suda, T., Yoshida, K., Taga, T., Kishimoto, T., Kataoka, H. C., et al. (1997) · Endocrinology · doi:10.1210/endo.138.11.5534 · Cited by 97
Colony-stimulating factors; molecular and cellular biology
McElreavey, K. (1990) · Trends in Biochemical Sciences · doi:10.1016/0968-0004(90)90250-f · Cited by 88
Fujimoto, M., Naka, T., Nakagawa, R., Kawazoe, Y., Morita, Y., Tateishi, A., Okumura, K., Narazaki, M., & Kishimoto, T. (2000) · The Journal of Immunology · doi:10.4049/jimmunol.165.4.1799 · Cited by 81
Watanabe, S., Mui, A., Muto, A., Chen, J. X., Hayashida, K., Yokota, T., Miyajima, A., & Arai, K. (1993) · Molecular and Cellular Biology · doi:10.1128/mcb.13.3.1440 · Cited by 79
Ernst, M., Novak, U., Nicholson, S. E., Layton, J. E., & Dunn, A. R. (1999) · Journal of Biological Chemistry · doi:10.1074/jbc.274.14.9729 · Cited by 78
Self-citationWaring, P. M., Carroll, G. J., Kandiah, D. A., Buirski, G., & Metcalf, D. (1993) · Arthritis & Rheumatism · doi:10.1002/art.1780360707 · Cited by 72
Self-citationGarland, J. M. (2020) · CRC Press eBooks · doi:10.1201/9781003067405 · Cited by 69
Lambert, N. C., Loubet‐Lescoulié, P., Yassine‐Diab, B., Enault, G., Mazières, B., de Préval, C., & Cantagrel, A. G. (1998) · Clinical & Experimental Immunology · doi:10.1046/j.1365-2249.1998.00621.x · Cited by 45
Three Different cDNAs Encoding Mouse D-Factor/LIF Receptor1
Tomida, M., Yamamoto-Yamaguchi, Y., & Hozumi, M. (1994) · The Journal of Biochemistry · doi:10.1093/oxfordjournals.jbchem.a124375 · Cited by 41
Kumanogoh, A., Marukawa, S., Kumanogoh, T., Hirota, H., Yoshida, K., Lee, I., Yasui, T., Taga, T., & Kishimoto, T. (1997) · Proceedings of the National Academy of Sciences of the United States of America · doi:10.1073/pnas.94.6.2478 · Cited by 38
The STAT3-independent Signaling Pathway by Glycoprotein 130 in Hepatic Cells
Lai, C., Ripperger, J. A., Wang, Y., Kim, H., Hawley, R. G., & Baumann, H. (1999) · Journal of Biological Chemistry · doi:10.1074/jbc.274.12.7793 · Cited by 32
Signaling Through Gp130: Toward a General Scenario of Cytokine Action
Fukada, T., Yoshida, Y., Nishida, K., Ohtani, T., Shirogane, T., Hibi, M., & Hirano, T. (1999) · Growth Factors · doi:10.3109/08977199909103518 · Cited by 28
Thiel, S., Behrmann, I., Timmermann, A., Dahmen, H., Müller‐Newen, G., Schaper, F., Tavernier, J., Pitard, V., Heinrich, P. C., & Graeve, L. (1999) · Biochemical Journal · doi:10.1042/0264-6021:3390015 · Cited by 28
Bao, S., Husband, A. J., & Beagley, K. W. (1999) · Cellular Immunology · doi:10.1006/cimm.1999.1579 · Cited by 18
Self-citationRegulation of interleukin-6 and interleukin-1β gene expression in the mouse deciduum
Liang, L., Kover, K. L., Dey, S. K., & Andrews, G. K. (1996) · Journal of Reproductive Immunology · doi:10.1016/0165-0378(95)00953-1 · Cited by 14
Tumors and Tumor-like Lesions of the joints
(2001) · Thieme eBooks · doi:10.1055/b-0034-52715 · Cited by 7
Research works printed but not linked: 1
- Waring, 1997, Leukemia inhibitory factor, 467
Cited by
Sorted by citations
Kaser, A., Zeissig, S., & Blumberg, R. S. (2010) · Annual Review of Immunology · doi:10.1146/annurev-immunol-030409-101225 · Cited by 1,806
IL-6 in inflammation, autoimmunity and cancer
Hirano, T. (2021) · International Immunology · doi:10.1093/intimm/dxaa078 · Cited by 1,453
Roadmap to embryo implantation: clues from mouse models
Wang, H., & Dey, S. K. (2006) · Nature Reviews Genetics · doi:10.1038/nrg1808 · Cited by 1,324
Cyclic Decidualization of the Human Endometrium in Reproductive Health and Failure
Gellersen, B., & Brosens, J. J. (2014) · Endocrine Reviews · doi:10.1210/er.2014-1045 · Cited by 1,176
Molecular Cues to Implantation
Dey, S. K., Lim, H. J., Das, S. K., Reese, J., Paria, B. C., Daikoku, T., & Wang, H. (2004) · Endocrine Reviews · doi:10.1210/er.2003-0020 · Cited by 1,120
Metadata
- Authors
- Ernst, M., Inglese, M., Waring, P., Campbell, I. K., Bao, S., Clay, F. J., Alexander, W. S., Wicks, I. P., Tarlinton, D. M., Novak, U., Heath, J. K., & Dunn, A. R.
- Affiliations
- The Royal Melbourne Hospital (AU)
- Peter MacCallum Cancer Centre (AU)
- The University of Sydney (AU)
- The University of Melbourne (AU)
- ORCID
- Venue
- The Journal of Experimental Medicine
- Publisher
- Rockefeller University Press
- Published
- 2001-07-16
- Volume
- 194
- Issue
- 2
- Pages
- 189-204
- ISSN
- 0022-1007 (ISSN-L)
- 1540-9538
- PMC
- PMC2193459
- OpenAlex
- W2125415295
- Cited by
- 227
- References
- 51
- Citations by year
- 2026: 2 · 2025: 4 · 2024: 4 · 2023: 3 · 2022: 2 · 2021: 7 · 2020: 4 · 2019: 7 · 2018: 1 · 2017: 8 · 2016: 4 · 2015: 5 · 2014: 8 · 2013: 12 · 2012: 6
- FWCI
- 9.16
- Type
- journal article
- Language
- en
- Open access
- green
- www.ncbi.nlm.nih.gov
- Licence
- cc-by-nc-sa
- Locations
- The Journal of Experimental Medicine (publishedVersion)
- PubMed Central (publishedVersion, cc-by-nc-sa)
- PubMed (publishedVersion)
- Minerva Access (University of Melbourne) (submittedVersion, cc-by-nc-sa)
- Topics
- Life Sciences › Immunology and Microbiology › Immunology › Cytokine Signaling Pathways and Interactions
- Health Sciences › Medicine › Rheumatology › Rheumatoid Arthritis Research and Therapies
- Health Sciences › Medicine › Rheumatology › Osteoarthritis Treatment and Mechanisms
- Keywords
- gp130, STAT signaling, interleukin-6, suppressor of cytokine signaling, articular cartilage degeneration, synovitis, gastrointestinal ulceration, embryo implantation, cytokine receptor signaling, knock-in mice
- MeSH terms
- Suppressor of Cytokine Signaling 1 Protein, Animals, Carrier Proteins, DNA-Binding Proteins, Female, Joint Diseases, Male, Membrane Glycoproteins, Mice, Mutant Strains, Embryo Implantation, Peptic Ulcer, Pregnancy, Repressor Proteins, Signal Transduction, Trans-Activators, Antigens, CD, DNA Primers, Mice, Knockout, Mitogen-Activated Protein Kinases, STAT1 Transcription Factor, STAT3 Transcription Factor, Cytokine Receptor gp130, Suppressor of Cytokine Signaling Proteins, Mice
About these checks
Registry, retraction, Cites and statistics results are computed, not judged, with one exception: a printed reference that no index lists is read once by a model before it counts as a citation error. Claims are extracted by a model and kept only when their quote appears verbatim in the text; each cited source is then checked, with a model’s help, for whether it says what the claim relies on. Those verdicts can be wrong — read the claim’s quote and the cited source before relying on one.
Statistics and arithmetic are recomputed, not judged.
Confidence bands are shown only for fields calibrated on our annotated test set. None is calibrated yet, so no band is shown.
What counts as a claim ›How we measure confidence ›How we check this ›
Are you an author, or do you see a problem with this page? Request a review
