

The DOI matches its Crossref record; 48 of the 48 references it cites were found in a registry or an index.
PD-1 is a regulator of virus-specific CD8+ T cell survival in HIV infection
Open accessAbstract
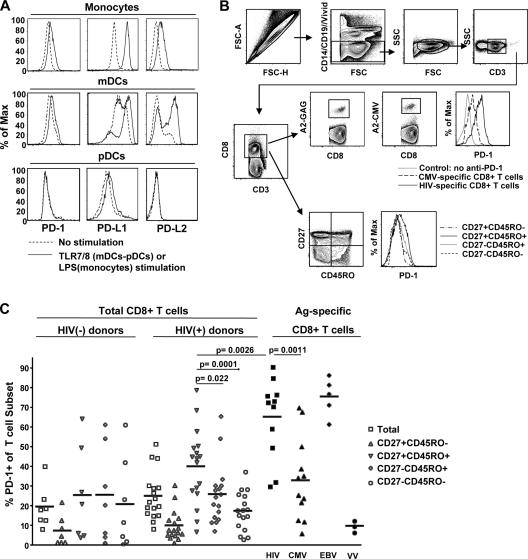
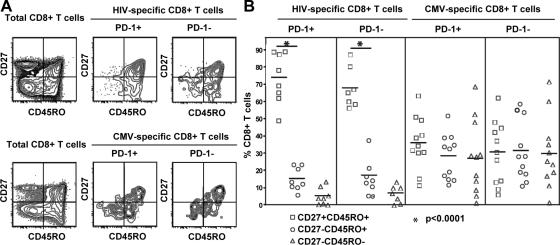
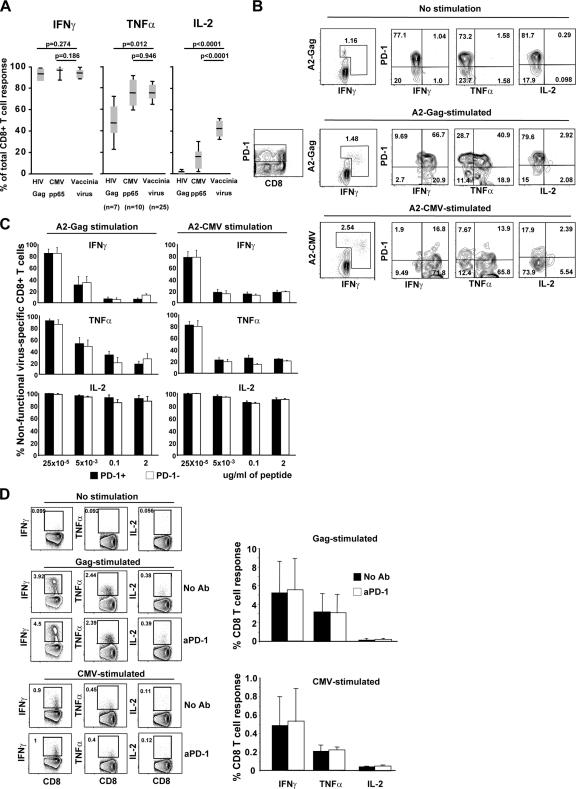
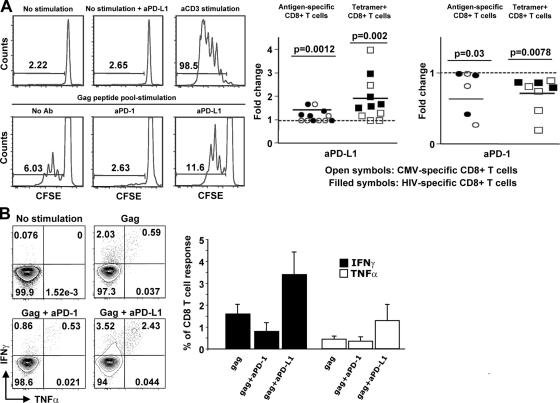
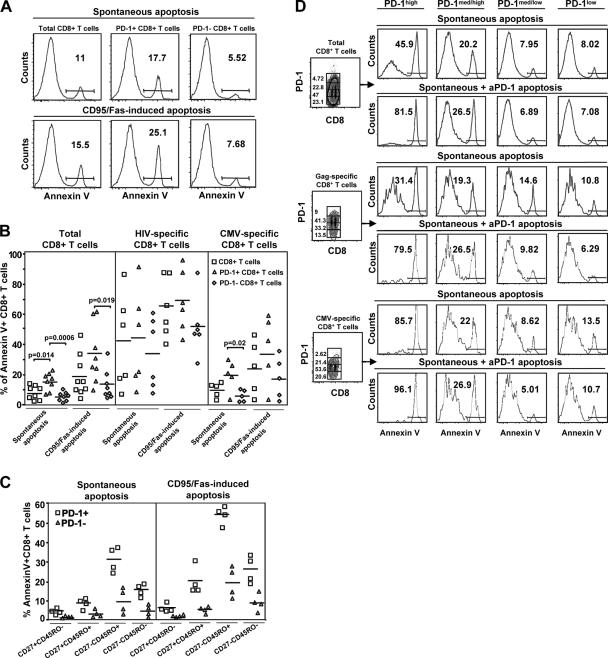
Here, we report on the expression of programmed death (PD)-1 on human virus-specific CD8+ T cells and the effect of manipulating signaling through PD-1 on the survival, proliferation, and cytokine function of these cells. PD-1 expression was found to be low on naive CD8+ T cells and increased on memory CD8+ T cells according to antigen specificity. Memory CD8+ T cells specific for poorly controlled chronic persistent virus (HIV) more frequently expressed PD-1 than memory CD8+ T cells specific for well-controlled persistent virus (cytomegalovirus) or acute (vaccinia) viruses. PD-1 expression was independent of maturational markers on memory CD8+ T cells and was not directly associated with an inability to produce cytokines. Importantly, the level of PD-1 surface expression was the primary determinant of apoptosis sensitivity of virus-specific CD8+ T cells. Manipulation of PD-1 led to changes in the ability of the cells to survive and expand, which, over several days, affected the number of cells expressing cytokines. Therefore, PD-1 is a major regulator of apoptosis that can impact the frequency of antiviral T cells in chronic infections such as HIV, and could be manipulated to improve HIV-specific CD8+ T cell numbers, but possibly not all functions in vivo.
Overview
The claims and statistics of this paper haven’t been checked yet.
Run the check — free, no account needed. It reads the open-access text and checks the sources it cites.
Integrity signals
Registry
Cites
Statistics
Figures
Verification
Claims the paper makes
The claims and statistics of this paper haven’t been checked yet.
Run the check — free, no account needed. It reads the open-access text and checks the sources it cites.
Claims other papers make about this one
Each is checked against this paper’s own text: does it say what the citing paper says it does?
In the citing paper
“The view that many of these late-stage differentiated cells are not dysfunctional or senescent is supported by studies showing that the inhibitory molecule programmed death-1 (PD-1) is expressed on very few CMV-specific cells and at low levels (Petrovas et al. 2006; Trautmann et al. 2006).”
From Is immunosenescence influenced by our lifetime “dose” of exercise? (2016) · cites this paper as Petrovas et al. 2006
Self-check
Percentages, sums and reported differences re-computed from the paper’s own numbers.
The self-check needs the paper’s full text.
Citations
Cites
Freeman, G. J., Long, A. J., Iwai, Y., Bourque, K., Chernova, T., Nishimura, H., Fitz, L. J., Malenkovich, N., Okazaki, T., Byrne, M. C., et al. (2000) · The Journal of Experimental Medicine · doi:10.1084/jem.192.7.1027 · Cited by 5,294
Tumor-associated B7-H1 promotes T-cell apoptosis: A potential mechanism of immune evasion
Dong, H., Strome, S. E., Salomao, D. R., Tamura, H., Hirano, F., Flies, D. B., Roche, P. C., Lu, J., Zhu, G., Tamada, K., et al. (2002) · Nature Medicine · doi:10.1038/nm730 · Cited by 5,025
Restoring function in exhausted CD8 T cells during chronic viral infection
Barber, D. L., Wherry, E. J., Masopust, D., Zhu, B., Allison, J. P., Sharpe, A. H., Freeman, G. J., & Ahmed, R. (2005) · Nature · doi:10.1038/nature04444 · Cited by 4,057
Ishida, Y., Agata, Y., Shibahara, K., & Honjo, T. (1992) · The EMBO Journal · doi:10.1002/j.1460-2075.1992.tb05481.x · Cited by 3,259
PD-L2 is a second ligand for PD-1 and inhibits T cell activation
Latchman, Y., Wood, C. R., Chernova, T., Chaudhary, D., Borde, M., Chernova, I., Iwai, Y., Long, A. J., Brown, J. A., Nunes, R., et al. (2001) · Nature Immunology · doi:10.1038/85330 · Cited by 2,955
PD-1 expression on HIV-specific T cells is associated with T-cell exhaustion and disease progression
Day, C. L., Kaufmann, D. E., Kiepiela, P., Brown, J. A., Moodley, E. S., Reddy, S., Mackey, E. W., Miller, J. D., Leslie, A. J., DePierres, C., et al. (2006) · Nature · doi:10.1038/nature05115 · Cited by 2,680
Koup, R. A., Safrit, J. T., Cao, Y., Andrews, C. A., McLeod, G. X., Borkowsky, W., Farthing, C., & Ho, D. D. (1994) · Journal of Virology · doi:10.1128/jvi.68.7.4650-4655.1994 · Cited by 2,494
Self-citationGreenwald, R. J., Freeman, G. J., & Sharpe, A. H. (2005) · Annual Review of Immunology · doi:10.1146/annurev.immunol.23.021704.115611 · Cited by 2,318
CTLA-4 and PD-1 Receptors Inhibit T-Cell Activation by Distinct Mechanisms
Parry, R. V., Chemnitz, J. M., Frauwirth, K. A., Lanfranco, A. R., Braunstein, I., Kobayashi, S. V., Linsley, P. S., Thompson, C. B., & Riley, J. L. (2005) · Molecular and Cellular Biology · doi:10.1128/mcb.25.21.9543-9553.2005 · Cited by 1,931
HIV nonprogressors preferentially maintain highly functional HIV-specific CD8+ T cells
Betts, M. R. (2006) · Blood · doi:10.1182/blood-2005-12-4818 · Cited by 1,812
Cited by
Sorted by citations
PD-1 and Its Ligands in Tolerance and Immunity
Keir, M. E., Butte, M. J., Freeman, G. J., & Sharpe, A. H. (2008) · Annual Review of Immunology · doi:10.1146/annurev.immunol.26.021607.090331 · Cited by 5,378
Wherry, E. J. (2011) · Nature Immunology · doi:10.1038/ni.2035 · Cited by 4,062
Molecular Signature of CD8+ T Cell Exhaustion during Chronic Viral Infection
Wherry, E. J., Ha, S.-J., Kaech, S. M., Haining, W. N., Sarkar, S., Kalia, V., Subramaniam, S., Blattman, J. N., Barber, D. L., & Ahmed, R. (2007) · Immunity · doi:10.1016/j.immuni.2007.09.006 · Cited by 2,103
Blackburn, S. D., Shin, H., Haining, W. N., Zou, T., Workman, C. J., Polley, A., Betts, M. R., Freeman, G. J., Vignali, D. A. A., & Wherry, E. J. (2009) · Nature Immunology · doi:10.1038/ni.1679 · Cited by 2,062
Targeting Tim-3 and PD-1 pathways to reverse T cell exhaustion and restore anti-tumor immunity
Sakuishi, K., Apetoh, L., Sullivan, J. M., Blazar, B. R., Kuchroo, V. K., & Anderson, A. C. (2010) · Journal of Experimental Medicine · doi:10.1084/jem.20100643 · Cited by 2,072
Metadata
- Authors
- Petrovas, C., Casazza, J. P., Brenchley, J. M., Price, D. A., Gostick, E., Adams, W. C., Precopio, M. L., Schacker, T., Roederer, M., Douek, D. C., & Koup, R. A.
- Affiliations
- 1Immunology Laboratory
- 2Human Immunology Section,
- John Radcliffe Hospital (GB)
- 3Nuffield Department of Clinical Medicine, John Radcliffe Hospital, University of Oxford, Oxford OX3 9DU, UK
- University of Minnesota (US)
- National Institutes of Health (US)
- ORCID
- Venue
- The Journal of Experimental Medicine
- Publisher
- Rockefeller University Press
- Published
- 2006-09-05
- Volume
- 203
- Issue
- 10
- Pages
- 2281-2292
- ISSN
- 0022-1007 (ISSN-L)
- 1540-9538
- PMC
- PMC2118095
- OpenAlex
- W2119146367
- Cited by
- 889
- References
- 48
- Citations by year
- 2026: 13 · 2025: 16 · 2024: 19 · 2023: 18 · 2022: 29 · 2021: 35 · 2020: 45 · 2019: 39 · 2018: 36 · 2017: 33 · 2016: 35 · 2015: 33 · 2014: 44 · 2013: 48 · 2012: 48
- FWCI
- 30.78
- Type
- journal article
- Language
- en
- Open access
- bronze
- doi.org
- Locations
- The Journal of Experimental Medicine (publishedVersion)
- Europe PMC (PubMed Central) (publishedVersion, cc-by-nc-sa)
- PubMed Central (publishedVersion, cc-by-nc-sa)
- PubMed (publishedVersion)
- ORCA Online Research @Cardiff (Cardiff University) (acceptedVersion)
- Funders
- National Institute of Allergy and Infectious Diseases (P01AI074340)
- Topics
- Life Sciences › Immunology and Microbiology › Immunology › T-cell and B-cell Immunology
- Life Sciences › Immunology and Microbiology › Virology › HIV Research and Treatment
- Health Sciences › Medicine › Oncology › Cancer Immunotherapy and Biomarkers
- Keywords
- PD-1, HIV infection, CD8+ T cells, virus-specific T cells, T cell survival, apoptosis, memory T cells, cytomegalovirus, vaccinia virus, T cell proliferation, cytokine production, chronic viral infection, antiviral immunity
- MeSH terms
- Cell Survival, Flow Cytometry, Humans, HIV Infections, Antigens, CD, Apoptosis, CD8-Positive T-Lymphocytes, Apoptosis Regulatory Proteins, Programmed Cell Death 1 Receptor
About these checks
Registry, retraction, Cites and statistics results are computed, not judged, with one exception: a printed reference that no index lists is read once by a model before it counts as a citation error. Claims are extracted by a model and kept only when their quote appears verbatim in the text; each cited source is then checked, with a model’s help, for whether it says what the claim relies on. Those verdicts can be wrong — read the claim’s quote and the cited source before relying on one.
Statistics and arithmetic are recomputed, not judged.
Confidence bands are shown only for fields calibrated on our annotated test set. None is calibrated yet, so no band is shown.
What counts as a claim ›How we measure confidence ›How we check this ›
Are you an author, or do you see a problem with this page? Request a review
