Cited by 339Wound Healing and TreatmentsT-cell and B-cell ImmunologyPsoriasis: Treatment and Pathogenesis

The DOI matches its Crossref record; 22 of the 22 references it cites were found in a registry or an index.

A role for human skin–resident T cells in wound healing

Open access
Toulon, Antoine, Breton, Lionel, Taylor, Kristen R., Tenenhaus, Mayer, Bhavsar, Dhaval, Lanigan, Caroline, Rudolph, Ross, Jameson, Julie, Havran, Wendy L.·2009·Journal of Experimental Medicine

Abstract

Epidermal T cells have been shown to play unique roles in tissue homeostasis and repair in mice through local secretion of distinct growth factors in the skin. Human epidermis contains both αβ+ and γδ+ T cells whose functional capabilities are not understood. We demonstrate that human epidermal T cells are able to produce insulin-like growth factor 1 (IGF-1) upon activation and promote wound healing in a skin organ culture model. Moreover, an analysis of the functional capabilities of T cells isolated from acute versus chronic wounds revealed a striking difference. Both αβ+ and Vδ1+ T cells isolated from acute wounds actively produced IGF-1, demonstrating that they are activated during tissue damage to participate in wound repair. In contrast, IGF-1 production could not be detected in T cells isolated from chronic wounds. In fact, skin T cells isolated from chronic wounds were refractory to further stimulation, suggesting an unresponsive state. Collectively, these results define a novel role for human epidermis–resident T cells in wound healing and provide new insight into our understanding of chronic wound persistence.

Overview

The claims and statistics of this paper haven’t been checked yet.

Run the check — free, no account needed. It reads the open-access text and checks the sources it cites.

A few free checks a day · papers already verified open instantly · results are public

Integrity signals

Registry

Crossref · 10.1084/jem.20081787

Cites

22 of 22 references verified0 citation errors · 0 not checkable

Statistics

Figures

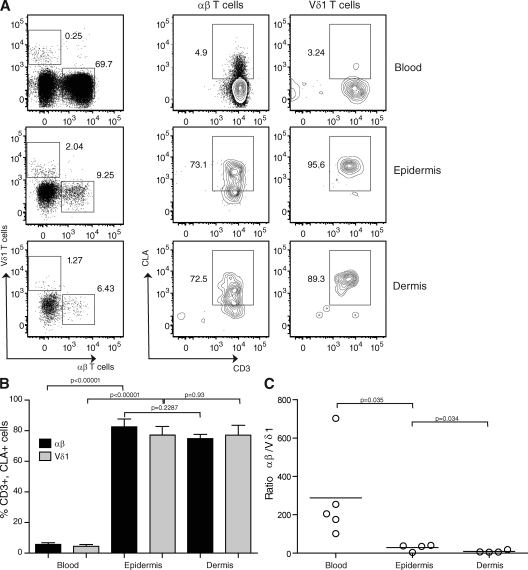
Figure 1. T cell distribution in human skin. (A) Epidermal- and dermal-resident αβ+ and Vδ1+ T cells express high levels of CLA. Representative cytometry plots show gated populations from four-color immunofluorescence. Epidermal and dermal cells were stained with anti-CD3, CLA, αβ, and Vδ1 antibodies and were compared with healthy blood. Live lymphocytes were gated according to forward and side scatter. The numbers denote the percentages of gated cells from the live cell gate shown. (B) There is a significant difference in CLA expression between blood and epidermal T cells. There is no difference in terms of CLA expression between epidermal and dermal T cells. Histograms show the percentage of CD3+, CLA+, αβ+, and Vδ1+ cells in the blood, epidermis, and dermis of healthy donors. Results represent means of data ± SEM of four normal skin samples (epidermis and dermis) and five healthy blood samples. (C) The Vδ1/αβ T cell ratio is significantly different between the blood and epidermis as well as between the epidermis and dermis. Plots show the ratio of αβ+ to Vδ1+ T cells in the blood, epidermis, and dermis of individual healthy donors. Ratios were compared using a one-tailed unpaired Student's t test. Horizontal bars represent means of the values from the different patients.
Figure 1. T cell distribution in human skin. (A) Epidermal- and dermal-resident αβ+ and Vδ1+ T cells express high levels of CLA. Representative cytometry plots show gated populations from four-color immunofluorescence. Epidermal and dermal cells were stained with anti-CD3, CLA, αβ, and Vδ1 antibodies and were compared with healthy blood. Live lymphocytes were gated according to forward and side scatter. The numbers denote the percentages of gated cells from the live cell gate shown. (B) There is a significant difference in CLA expression between blood and epidermal T cells. There is no difference in terms of CLA expression between epidermal and dermal T cells. Histograms show the percentage of CD3+, CLA+, αβ+, and Vδ1+ cells in the blood, epidermis, and dermis of healthy donors. Results represent means of data ± SEM of four normal skin samples (epidermis and dermis) and five healthy blood samples. (C) The Vδ1/αβ T cell ratio is significantly different between the blood and epidermis as well as between the epidermis and dermis. Plots show the ratio of αβ+ to Vδ1+ T cells in the blood, epidermis, and dermis of individual healthy donors. Ratios were compared using a one-tailed unpaired Student's t test. Horizontal bars represent means of the values from the different patients.CC BY-NC-SA · PubMed Central
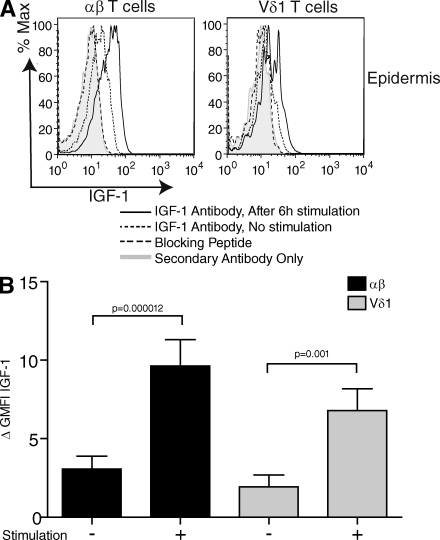
Figure 2. Resident epidermal T cells produce IGF-1 upon stimulation in vitro. (A) Flow cytometry of freshly isolated epidermal cells stimulated with PMA and ionomycin, and stained with anti-IGF-1. (B) Statistical analysis of IGF-1 expression in normal epidermal T cells (n = 17). The population was distributed as follows: sex, 12 females and 5 males; age, 44.8 ± 22.2 yr. There is a significant difference in IGF-1 expression before and after stimulation in the αβ+ and the Vδ1+ subsets according to a one-tailed Student's t test. In all flow cytometry analyses, protein production was determined by subtracting the geometric mean fluorescence intensity (GMFI) of the control secondary antibody from the GMFI of cells treated with specific antibodies. Results represent means of data ± SEM.
Figure 2. Resident epidermal T cells produce IGF-1 upon stimulation in vitro. (A) Flow cytometry of freshly isolated epidermal cells stimulated with PMA and ionomycin, and stained with anti-IGF-1. (B) Statistical analysis of IGF-1 expression in normal epidermal T cells (n = 17). The population was distributed as follows: sex, 12 females and 5 males; age, 44.8 ± 22.2 yr. There is a significant difference in IGF-1 expression before and after stimulation in the αβ+ and the Vδ1+ subsets according to a one-tailed Student's t test. In all flow cytometry analyses, protein production was determined by subtracting the geometric mean fluorescence intensity (GMFI) of the control secondary antibody from the GMFI of cells treated with specific antibodies. Results represent means of data ± SEM.CC BY-NC-SA · PubMed Central
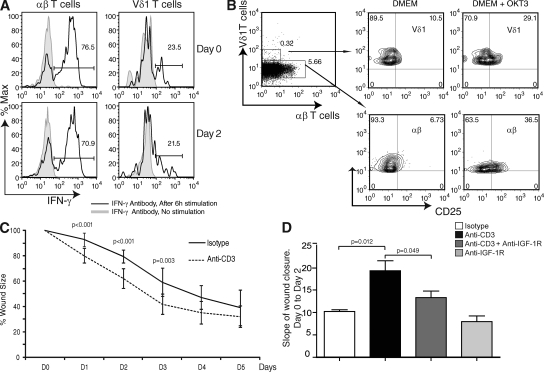
Figure 3. Rate of wound closure in organ culture is increased after activation of skin-resident T cells. (A) T cells remain responsive after 2 d of organ culture. Freshly isolated epidermal cells stimulated with PMA and ionomycin, and stained with IFN-γ for analysis by flow cytometry. IFN-γ expression was assessed on normal skin freshly harvested (day 0) and after being cultured for 2 d (day 2) on gelfoam in DMEM/10% FCS. Skin from the same donor was used for both day 0 and 2 analyses. Data are representative of three independent experiments. Percentages are shown. (B) Anti-CD3 stimulation activates skin-resident T cells in organ culture. The experiment was performed on skin cultured for 2 d on a gelfoam in DMEM/10% FCS in the presence or absence of anti-CD3 (5 µg/ml OKT3) antibody. Flow cytometry of freshly isolated αβ+ and Vδ1+ T cells stained with CD25 is shown. Data are representative of three independent experiments. Percentages are shown. (C) The addition of stimulating antibodies to CD3 increased the rate of wound closure in skin organ culture. Analysis of skin wound closure kinetics in the presence (dashed line) or absence (continuous line) of an mAb to CD3. Data are presented as the means ± SD of three independent experiments with an average of three foreskins per experiment, and are representative of seven total experiments (with a sum of 20 foreskins). (D) Blocking of T cell–mediated wound closure with IGF-1R antibody in skin organ culture. Data are the means ± SD of the slope of wound closure between days 0 and 2 of three independent experiments performed in triplicate. Data were compared using a one-tailed paired Student's t test.
Figure 3. Rate of wound closure in organ culture is increased after activation of skin-resident T cells. (A) T cells remain responsive after 2 d of organ culture. Freshly isolated epidermal cells stimulated with PMA and ionomycin, and stained with IFN-γ for analysis by flow cytometry. IFN-γ expression was assessed on normal skin freshly harvested (day 0) and after being cultured for 2 d (day 2) on gelfoam in DMEM/10% FCS. Skin from the same donor was used for both day 0 and 2 analyses. Data are representative of three independent experiments. Percentages are shown. (B) Anti-CD3 stimulation activates skin-resident T cells in organ culture. The experiment was performed on skin cultured for 2 d on a gelfoam in DMEM/10% FCS in the presence or absence of anti-CD3 (5 µg/ml OKT3) antibody. Flow cytometry of freshly isolated αβ+ and Vδ1+ T cells stained with CD25 is shown. Data are representative of three independent experiments. Percentages are shown. (C) The addition of stimulating antibodies to CD3 increased the rate of wound closure in skin organ culture. Analysis of skin wound closure kinetics in the presence (dashed line) or absence (continuous line) of an mAb to CD3. Data are presented as the means ± SD of three independent experiments with an average of three foreskins per experiment, and are representative of seven total experiments (with a sum of 20 foreskins). (D) Blocking of T cell–mediated wound closure with IGF-1R antibody in skin organ culture. Data are the means ± SD of the slope of wound closure between days 0 and 2 of three independent experiments performed in triplicate. Data were compared using a one-tailed paired Student's t test.CC BY-NC-SA · PubMed Central
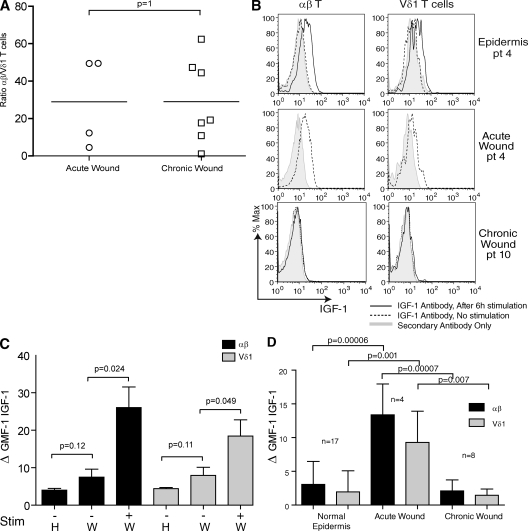
Figure 4. IGF-1 production by T cells in acute versus chronic wounds. (A) Ratio of αβ and Vδ1 T cells in acute (n = 4) versus chronic (n = 8) wounds. Data were compared using a two-tailed unpaired Student's t test. Horizontal bars represent means of the values from the different patients. (B) Cells were isolated from normal epidermis (top), acute wounds (middle), and chronic wounds (bottom) and examined for IGF-1 expression by flow cytometry. (top and bottom) Cells were also stimulated with PMA and ionomycin, and stained with anti–IGF-1. Cells isolated from acute wounds were not stimulated. The acute wound and the healthy epidermis shown were isolated from the same patient and were processed simultaneously. Data are representative of acute wounds obtained from four patients and chronic wounds obtained from eight patients. pt, patient. (C) IGF-1 production in circulating αβ+ and Vδ1+ T cells isolated from the blood of healthy (H; n = 5) and acutely wounded (W; n = 4) patients before and after stimulation with PMA and ionomycin. (D) IGF-1 production is greatly enhanced in acute wounds as compared with chronic wounds and healthy epidermis. There is a significant difference in IGF-1 expression in the αβ+ and the Vδ1+ subsets in acute wounds compared with normal epidermis and chronic wounds. Normal epidermis (n = 17), acute wounds (n = 4), and chronic wounds (n = 8) were examined in the absence of stimulation. Histograms show means ± SD. The GMFI of IGF-1 production by αβ+ and Vδ1+ cells is shown. In all graphs showing flow cytometry analysis, protein expression was determined by subtracting the GMFI of the control secondary antibody from the GMFI of cells treated with specific antibodies. Data are means ± SD.
Figure 4. IGF-1 production by T cells in acute versus chronic wounds. (A) Ratio of αβ and Vδ1 T cells in acute (n = 4) versus chronic (n = 8) wounds. Data were compared using a two-tailed unpaired Student's t test. Horizontal bars represent means of the values from the different patients. (B) Cells were isolated from normal epidermis (top), acute wounds (middle), and chronic wounds (bottom) and examined for IGF-1 expression by flow cytometry. (top and bottom) Cells were also stimulated with PMA and ionomycin, and stained with anti–IGF-1. Cells isolated from acute wounds were not stimulated. The acute wound and the healthy epidermis shown were isolated from the same patient and were processed simultaneously. Data are representative of acute wounds obtained from four patients and chronic wounds obtained from eight patients. pt, patient. (C) IGF-1 production in circulating αβ+ and Vδ1+ T cells isolated from the blood of healthy (H; n = 5) and acutely wounded (W; n = 4) patients before and after stimulation with PMA and ionomycin. (D) IGF-1 production is greatly enhanced in acute wounds as compared with chronic wounds and healthy epidermis. There is a significant difference in IGF-1 expression in the αβ+ and the Vδ1+ subsets in acute wounds compared with normal epidermis and chronic wounds. Normal epidermis (n = 17), acute wounds (n = 4), and chronic wounds (n = 8) were examined in the absence of stimulation. Histograms show means ± SD. The GMFI of IGF-1 production by αβ+ and Vδ1+ cells is shown. In all graphs showing flow cytometry analysis, protein expression was determined by subtracting the GMFI of the control secondary antibody from the GMFI of cells treated with specific antibodies. Data are means ± SD.CC BY-NC-SA · PubMed Central
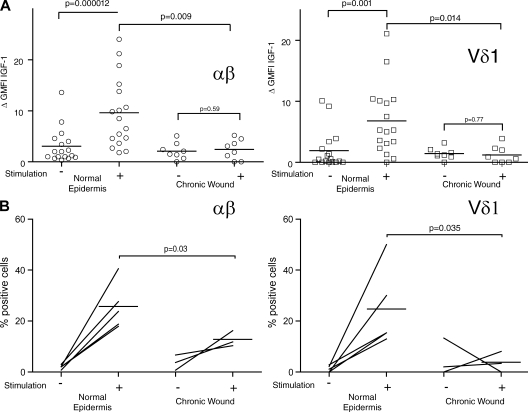
Figure 5. IGF-1 and IL-2 production by T cells in normal epidermis and chronic nonhealing wounds. (A) IGF-1 production by αβ+ and Vδ1+ T cells is significantly higher after stimulation in normal epidermis (n = 17) compared with chronic wounds (n = 8). Plots represent IGF-1 production by individual donors with or without stimulation with PMA and ionomycin. (B) The percentage of αβ+ (left) and Vδ1+ (right) T cells producing IL-2 before and after stimulation with PMA and ionomycin in normal epidermis (n = 5) and nonhealing chronic wounds (n = 3). Although no difference in IL-2 production by αβ+ and Vδ1+ T cells in normal epidermis compared with chronic wounds was seen before stimulation, the percentage of αβ+ and Vδ1+ cells producing IL-2 after stimulation is significantly lower in chronic wounds. Data were compared using a one-tailed unpaired Student's t test. Horizontal bars represent means of the values from the different patients.
Figure 5. IGF-1 and IL-2 production by T cells in normal epidermis and chronic nonhealing wounds. (A) IGF-1 production by αβ+ and Vδ1+ T cells is significantly higher after stimulation in normal epidermis (n = 17) compared with chronic wounds (n = 8). Plots represent IGF-1 production by individual donors with or without stimulation with PMA and ionomycin. (B) The percentage of αβ+ (left) and Vδ1+ (right) T cells producing IL-2 before and after stimulation with PMA and ionomycin in normal epidermis (n = 5) and nonhealing chronic wounds (n = 3). Although no difference in IL-2 production by αβ+ and Vδ1+ T cells in normal epidermis compared with chronic wounds was seen before stimulation, the percentage of αβ+ and Vδ1+ cells producing IL-2 after stimulation is significantly lower in chronic wounds. Data were compared using a one-tailed unpaired Student's t test. Horizontal bars represent means of the values from the different patients.CC BY-NC-SA · PubMed Central

Verification

Claims the paper makes

The claims and statistics of this paper haven’t been checked yet.

Run the check — free, no account needed. It reads the open-access text and checks the sources it cites.

A few free checks a day · papers already verified open instantly · results are public

Claims other papers make about this one

Each is checked against this paper’s own text: does it say what the citing paper says it does?

Self-check

Percentages, sums and reported differences re-computed from the paper’s own numbers.

The self-check needs the paper’s full text.

Citations

Cites

Show all 22 references

Research works printed but not linked: 1

  1. Tamaki, 2001, Epidermal and dermal γδ T cells, Chem. Immunol., 79, 43

Cited by

Sorted by citations

See all 339

Metadata

Authors
Toulon, A., Breton, L., Taylor, K. R., Tenenhaus, M., Bhavsar, D., Lanigan, C., Rudolph, R., Jameson, J., & Havran, W. L.
Affiliations
  • Scripps Research Institute (US)
  • L'Oréal (France) (FR)
  • University of California San Diego (US)
Corresponding author
Havran, Wendy L.
Venue
Journal of Experimental Medicine
Published
2009-03-23
Volume
206
Issue
4
Pages
743-750
ISSN
  • 0022-1007 (ISSN-L)
  • 1540-9538
OpenAlex
W199441549
Cited by
339
References
22
Citations by year
2026: 7 · 2025: 22 · 2024: 21 · 2023: 25 · 2022: 23 · 2021: 25 · 2020: 37 · 2019: 23 · 2018: 21 · 2017: 20 · 2016: 13 · 2015: 20 · 2014: 18 · 2013: 21 · 2012: 12
FWCI
10.73
Type
journal article
Language
en
Open access
Licence
cc-by-nc-sa
Locations
  • The Journal of Experimental Medicine (publishedVersion)
  • The FASEB Journal (publishedVersion)
  • PubMed Central (publishedVersion, cc-by-nc-sa)
  • PubMed (publishedVersion)
  • The Journal of Immunology
Funders
  • National Institutes of Health
  • National Institute of General Medical Sciences (GM80301, R01GM080301)
  • National Institute of Allergy and Infectious Diseases (AI 36964, T32AI007244, R01AI036964)
Topics
  • Health Sciences › Medicine › Surgery › Wound Healing and Treatments
  • Life Sciences › Immunology and Microbiology › Immunology › T-cell and B-cell Immunology
  • Life Sciences › Immunology and Microbiology › Immunology › Psoriasis: Treatment and Pathogenesis
Keywords
skin wound healing, chronic wounds, γδ T cells, alpha beta T cells, insulin-like growth factor I, T cell cytokine secretion, acute wounds, T cell activation, skin repair
MeSH terms
Chronic Disease, Epidermis, Flow Cytometry, Humans, Insulin-Like Growth Factor I, Lymphocyte Activation, Male, Organ Culture Techniques, Skin, Skin Physiological Phenomena, T-Lymphocytes, Wound Healing, Foreskin

About these checks

Registry, retraction, Cites and statistics results are computed, not judged, with one exception: a printed reference that no index lists is read once by a model before it counts as a citation error. Claims are extracted by a model and kept only when their quote appears verbatim in the text; each cited source is then checked, with a model’s help, for whether it says what the claim relies on. Those verdicts can be wrong — read the claim’s quote and the cited source before relying on one.

Statistics and arithmetic are recomputed, not judged.

Confidence bands are shown only for fields calibrated on our annotated test set. None is calibrated yet, so no band is shown.

What counts as a claim ›How we measure confidence ›How we check this ›

Are you an author, or do you see a problem with this page? Request a review