Cited by 176Vagus Nerve Stimulation ResearchFatty Acid Research and HealthPhagocytosis and Immune Regulation

The DOI matches its Crossref record; 32 of the 33 references it cites were found in a registry or an index.

Vagus nerve controls resolution and pro-resolving mediators of inflammation

Open access

Abstract

Resolution of inflammation is now recognized as a biosynthetically active process involving pro-resolving mediators. Here, we show in zymosan-initiated peritoneal inflammation that the vagus nerve regulates local expression of netrin-1, an axonal guidance molecule that activates resolution, and that vagotomy reduced local pro-resolving mediators, thereby delaying resolution. In netrin-1(+/-) mice, resolvin D1 (RvD1) was less effective in reducing neutrophil influx promoting resolution of peritonitis compared with Ntn1(+/+). Netrin-1 shortened the resolution interval, decreasing exudate neutrophils, reducing proinflammatory mediators, and stimulating the production of resolvins, protectins, and lipoxins. Human monocytes incubated with netrin-1 produced proresolving mediators, including resolvins and lipoxins. Netrin-1 and RvD1 displayed bidirectional activation in that they stimulated each other's expression and enhanced efferocytosis. These results indicate that the vagus nerve regulates both netrin-1 and pro-resolving lipid mediators, which act in a bidirectional fashion to stimulate resolution, and provide evidence for a novel mechanism for local neuronal control of resolution.

Overview

The claims and statistics of this paper haven’t been checked yet.

Run the check — free, no account needed. It reads the open-access text and checks the sources it cites.

A few free checks a day · papers already verified open instantly · results are public

Integrity signals

Registry

Crossref · 10.1084/jem.20132103

Cites

32 of 32 references verified0 citation errors · 0 not checkable

Statistics

Figures

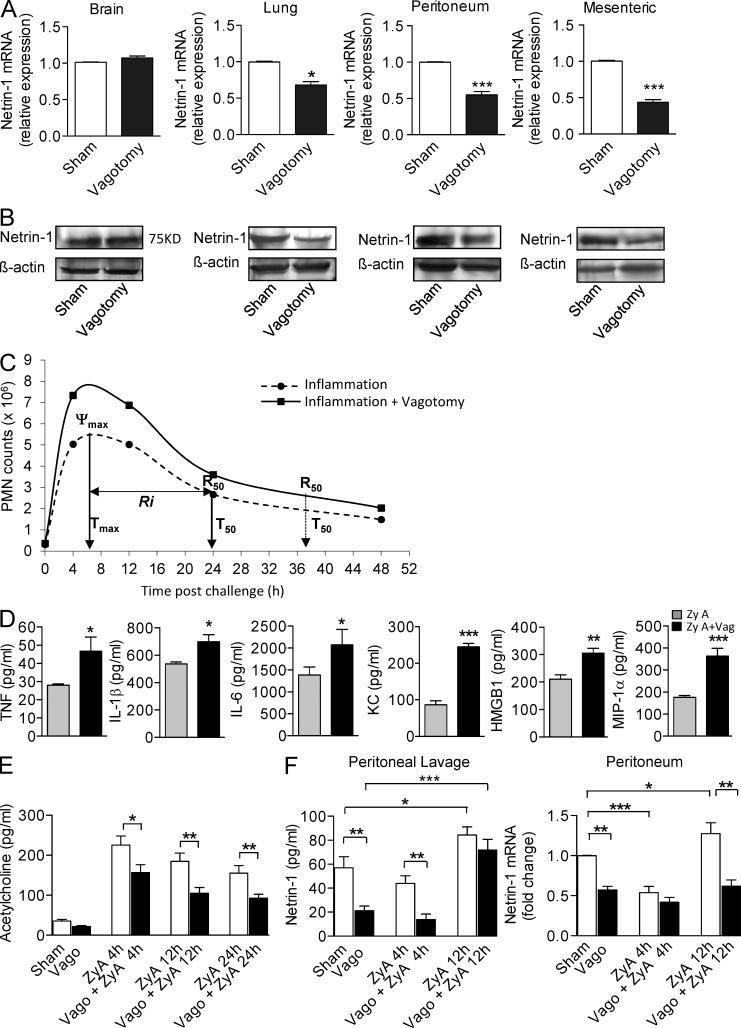
Figure 1. Vagotomy delays resolution of inflammation. Mice were subjected to right-sided cervical vagotomy or sham surgery. Netrin-1 mRNA (A) or protein (B) in the indicated tissues was quantified by quantitative real-time RT-PCR or Western blot, respectively. (C) Resolution indices as defined in (Bannenberg et al., 2005). (D and E) Mice were subjected to right-side cervical vagotomy or sham surgery and then injected i.p. with zymosan (1 mg/ml). Levels of TNF, IL-1β, IL-6, KC, MIP-1α, and HMGB1 in peritoneal lavage were measured by ELISA 4 h after zymosan injection. Acetylcholine (E) and netrin-1 levels (F, left) in peritoneal fluid at the indicated time points. Netrin-1 mRNA levels (F, right) in the peritoneal exudates were assessed by quantitative real-time RT-PCR at the indicated intervals. Results represent two independent experiments and are mean ± SEM, n = 6 mice per group. *, P < 0.05; **, P < 0.01; ***, P < 0.001.
Figure 1. Vagotomy delays resolution of inflammation. Mice were subjected to right-sided cervical vagotomy or sham surgery. Netrin-1 mRNA (A) or protein (B) in the indicated tissues was quantified by quantitative real-time RT-PCR or Western blot, respectively. (C) Resolution indices as defined in (Bannenberg et al., 2005). (D and E) Mice were subjected to right-side cervical vagotomy or sham surgery and then injected i.p. with zymosan (1 mg/ml). Levels of TNF, IL-1β, IL-6, KC, MIP-1α, and HMGB1 in peritoneal lavage were measured by ELISA 4 h after zymosan injection. Acetylcholine (E) and netrin-1 levels (F, left) in peritoneal fluid at the indicated time points. Netrin-1 mRNA levels (F, right) in the peritoneal exudates were assessed by quantitative real-time RT-PCR at the indicated intervals. Results represent two independent experiments and are mean ± SEM, n = 6 mice per group. *, P < 0.05; **, P < 0.01; ***, P < 0.001.CC BY-NC-SA · PubMed Central
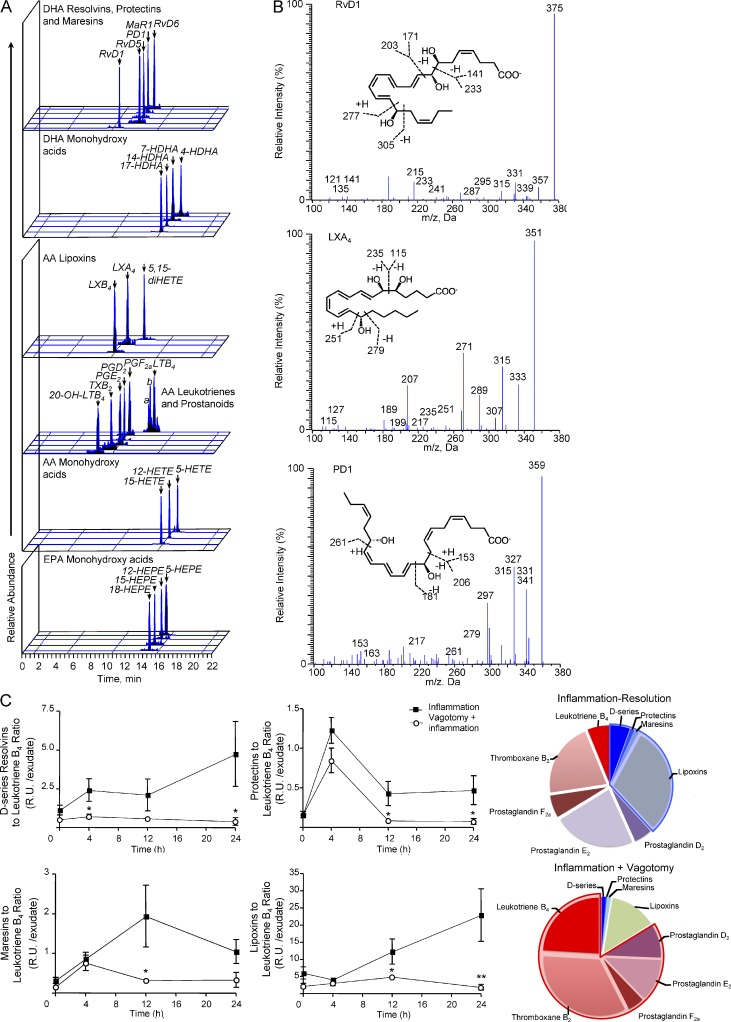
Figure 2. Vagotomy shifts exudate lipid mediator profile to proinflammatory. Mice were subjected to right-sided cervical vagotomy or sham surgery and then challenged with 1 mg zymosan. Peritoneal exudates were collected at the indicated intervals and lipid mediator profiles determined by lipid mediator metabololipidomics (see Materials and methods). (A) MRM chromatograms for the identified lipid mediators in murine exudates. a and b denote LTB4 isomers: a = Δ6-trans-LTB4; b = 12-epi-Δ6-trans-LTB4. (B) Accompanying MS/MS spectra used for identification. (C) Levels of D-series resolvins, protectins, and maresins, lipoxins, and leukotriene B4, prostaglandin, and thromboxane measured at the indicated time points. Pie charts show the relative contribution of lipid mediators. Blue shading denotes proresolving and red shading denotes pro-inflammatory Results are expressed as mean ± SEM; n = 4 mice per time point for two independent experiments. *, P < 0.05; **, P < 0.01 versus inflammation mice at the respective interval.
Figure 2. Vagotomy shifts exudate lipid mediator profile to proinflammatory. Mice were subjected to right-sided cervical vagotomy or sham surgery and then challenged with 1 mg zymosan. Peritoneal exudates were collected at the indicated intervals and lipid mediator profiles determined by lipid mediator metabololipidomics (see Materials and methods). (A) MRM chromatograms for the identified lipid mediators in murine exudates. a and b denote LTB4 isomers: a = Δ6-trans-LTB4; b = 12-epi-Δ6-trans-LTB4. (B) Accompanying MS/MS spectra used for identification. (C) Levels of D-series resolvins, protectins, and maresins, lipoxins, and leukotriene B4, prostaglandin, and thromboxane measured at the indicated time points. Pie charts show the relative contribution of lipid mediators. Blue shading denotes proresolving and red shading denotes pro-inflammatory Results are expressed as mean ± SEM; n = 4 mice per time point for two independent experiments. *, P < 0.05; **, P < 0.01 versus inflammation mice at the respective interval.CC BY-NC-SA · PubMed Central
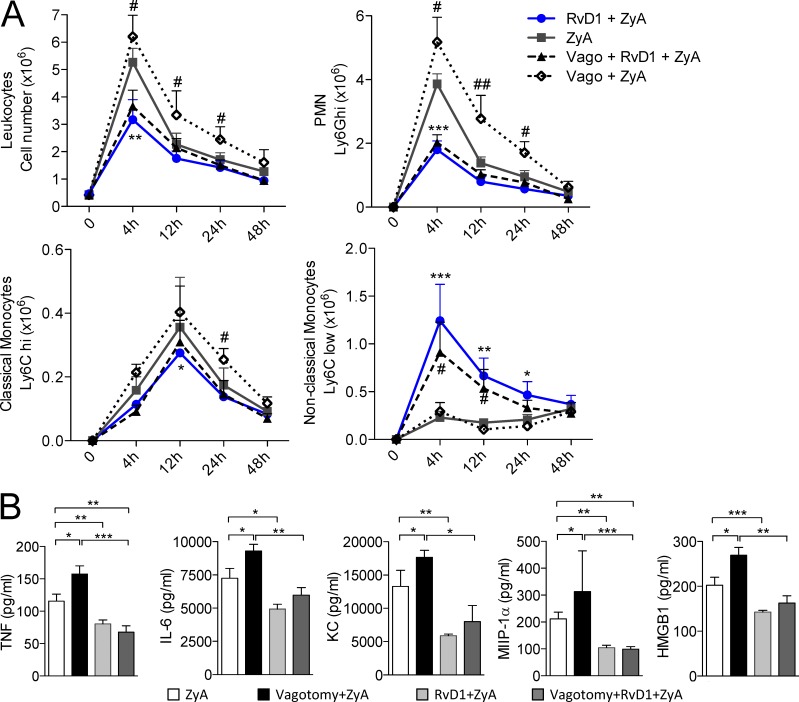
Figure 3. RvD1 rescues hyperinflammation in vagotomized mice. Vagotomized or sham-operated control mice were injected i.p. with zymosan A (ZyA) and subsequently with RvD1 (RvD1). Peritoneal lavages were collected at indicated time points. (A) Total leukocytes were enumerated by light microscopy. PMN, classical monocytes, and nonclassical monocytes were determined by flow cytometry. (B) TNF, IL-6, KC, MIP-1α, and HMGB1 were measured in exudates by ELISA. Results are mean ± SEM, n = 6 per group for two independent experiments. *, P < 0.05; **, P < 0.01; ***, P < 0.001.
Figure 3. RvD1 rescues hyperinflammation in vagotomized mice. Vagotomized or sham-operated control mice were injected i.p. with zymosan A (ZyA) and subsequently with RvD1 (RvD1). Peritoneal lavages were collected at indicated time points. (A) Total leukocytes were enumerated by light microscopy. PMN, classical monocytes, and nonclassical monocytes were determined by flow cytometry. (B) TNF, IL-6, KC, MIP-1α, and HMGB1 were measured in exudates by ELISA. Results are mean ± SEM, n = 6 per group for two independent experiments. *, P < 0.05; **, P < 0.01; ***, P < 0.001.CC BY-NC-SA · PubMed Central
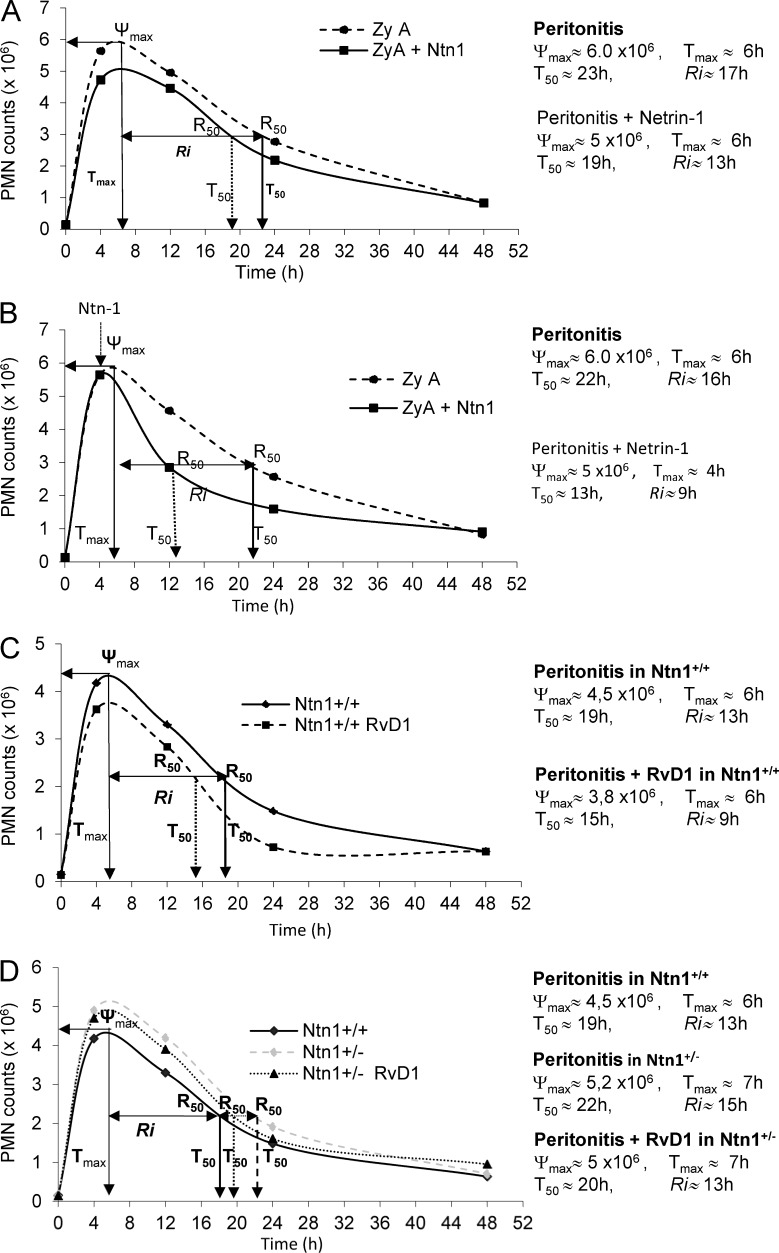
Figure 4. Netrin-1 stimulates resolution via RvD1. Resolution indices were used as previously defined (Bannenberg et al., 2005), including Ψmax (maximal PMN), Tmax (time point when PMNs reach Ψmax), T50 (time point corresponding to 50% reduction), and Ri (resolution interval, the time interval from Ψmax to 50% reduction point [i.e., T50-Tmax]). (A) Mice were injected i.p. with 1 mg of zymosan A (ZyA) and, subsequently, i.v. with either vehicle or recombinant netrin-1 (1 µg). Peritoneal exudates were collected at indicated time intervals and neutrophils (PMN) were enumerated by using light microscopy and flow cytometry. (B) Mice were treated as in panel A, and netrin-1 was given at the peak of inflammation (4h after ZyA). (C) Ntn1+/+ were injected i.p. with ZyA (1 mg) and subsequently with RvD1 (1 µg/mouse). Recruited leukocytes were enumerated at indicated time points. (D) Ntn1+/+ and Ntn1+/− mice were injected i.p. with ZyA (1mg) and subsequently with vehicle or RvD1 (1 µg/mouse), and peritoneal exudates were collected at indicated time intervals. Results in A–D represent 2 independent experiments with n = 4–6 mice per treatment per time point expressed as mean.
Figure 4. Netrin-1 stimulates resolution via RvD1. Resolution indices were used as previously defined (Bannenberg et al., 2005), including Ψmax (maximal PMN), Tmax (time point when PMNs reach Ψmax), T50 (time point corresponding to 50% reduction), and Ri (resolution interval, the time interval from Ψmax to 50% reduction point [i.e., T50-Tmax]). (A) Mice were injected i.p. with 1 mg of zymosan A (ZyA) and, subsequently, i.v. with either vehicle or recombinant netrin-1 (1 µg). Peritoneal exudates were collected at indicated time intervals and neutrophils (PMN) were enumerated by using light microscopy and flow cytometry. (B) Mice were treated as in panel A, and netrin-1 was given at the peak of inflammation (4h after ZyA). (C) Ntn1+/+ were injected i.p. with ZyA (1 mg) and subsequently with RvD1 (1 µg/mouse). Recruited leukocytes were enumerated at indicated time points. (D) Ntn1+/+ and Ntn1+/− mice were injected i.p. with ZyA (1mg) and subsequently with vehicle or RvD1 (1 µg/mouse), and peritoneal exudates were collected at indicated time intervals. Results in A–D represent 2 independent experiments with n = 4–6 mice per treatment per time point expressed as mean.CC BY-NC-SA · PubMed Central
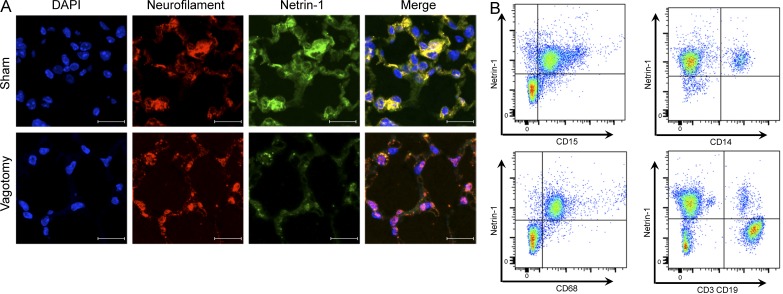
Figure 5. Vagotomy reduces netrin-1 expression. Animals were subjected to unilateral vagotomy or a comparable sham surgical procedure and netrin-1 and neurofilament expression in lungs was assessed by immunofluorescence. (A) Colocalization (green) of netrin-1 with the neuronal marker neurofilament (red) and yellow in the merged image. Bars, 100 µm. Results are representative of two separate experiments (n = 3 mice per group). (B) Leukocytes isolated from human peripheral blood were incubated with an antibody against netrin-1, CD15, CD14, CD68, CD3, CD19, and the expression of indicated marker was measured by flow cytometry. Results are representative of two separate experiments (from n = 3 healthy donors).
Figure 5. Vagotomy reduces netrin-1 expression. Animals were subjected to unilateral vagotomy or a comparable sham surgical procedure and netrin-1 and neurofilament expression in lungs was assessed by immunofluorescence. (A) Colocalization (green) of netrin-1 with the neuronal marker neurofilament (red) and yellow in the merged image. Bars, 100 µm. Results are representative of two separate experiments (n = 3 mice per group). (B) Leukocytes isolated from human peripheral blood were incubated with an antibody against netrin-1, CD15, CD14, CD68, CD3, CD19, and the expression of indicated marker was measured by flow cytometry. Results are representative of two separate experiments (from n = 3 healthy donors).CC BY-NC-SA · PubMed Central
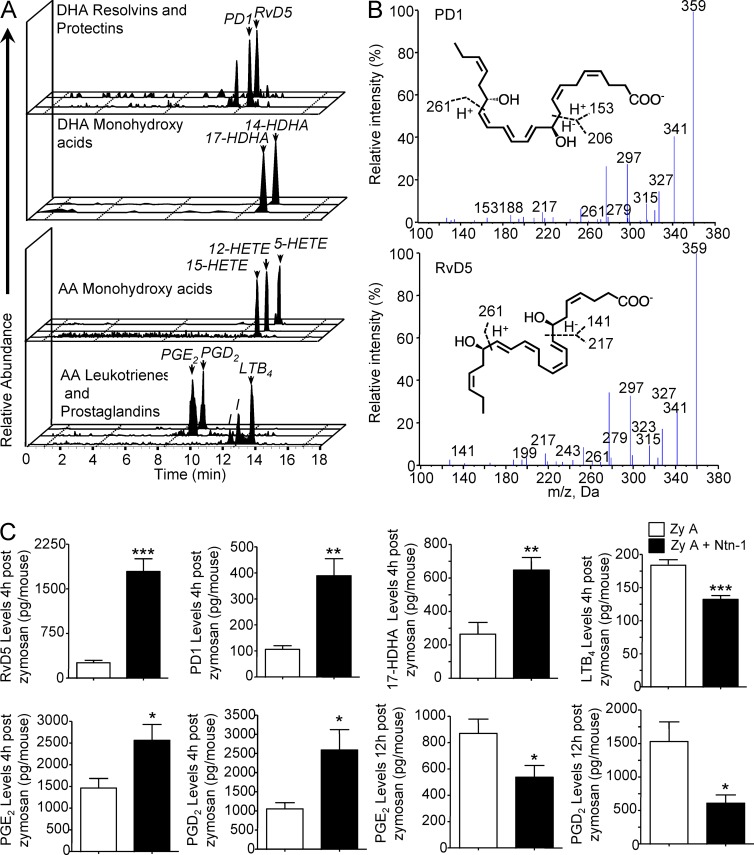
Figure 6. Netrin-1 enhances endogenous pro-resolving lipid mediators. Mouse peritonitis was initiated by i.p. injection of 1 mg of zymosan A (ZyA) and i.v. with recombinant netrin-1 (1 µg), and peritoneal exudates were collected at 4 and 12 h. Lipid mediator profiles were determined by lipid mediator metabololipidomics. (A) Representative MRM chromatograms for identified lipid mediators in murine self-resolving exudates and (B) MS/MS spectra. (C) Bioactive lipid mediators and precursor/pathway marker levels in the individual exudate at the indicated intervals as determined by MRM (see Materials and methods for details). Results are mean ± SEM and are representative of two independent experiments. n = 3–5 mice per group. *, P < 0.05; **, P < 0.01; ***, P < 0.001.
Figure 6. Netrin-1 enhances endogenous pro-resolving lipid mediators. Mouse peritonitis was initiated by i.p. injection of 1 mg of zymosan A (ZyA) and i.v. with recombinant netrin-1 (1 µg), and peritoneal exudates were collected at 4 and 12 h. Lipid mediator profiles were determined by lipid mediator metabololipidomics. (A) Representative MRM chromatograms for identified lipid mediators in murine self-resolving exudates and (B) MS/MS spectra. (C) Bioactive lipid mediators and precursor/pathway marker levels in the individual exudate at the indicated intervals as determined by MRM (see Materials and methods for details). Results are mean ± SEM and are representative of two independent experiments. n = 3–5 mice per group. *, P < 0.05; **, P < 0.01; ***, P < 0.001.CC BY-NC-SA · PubMed Central
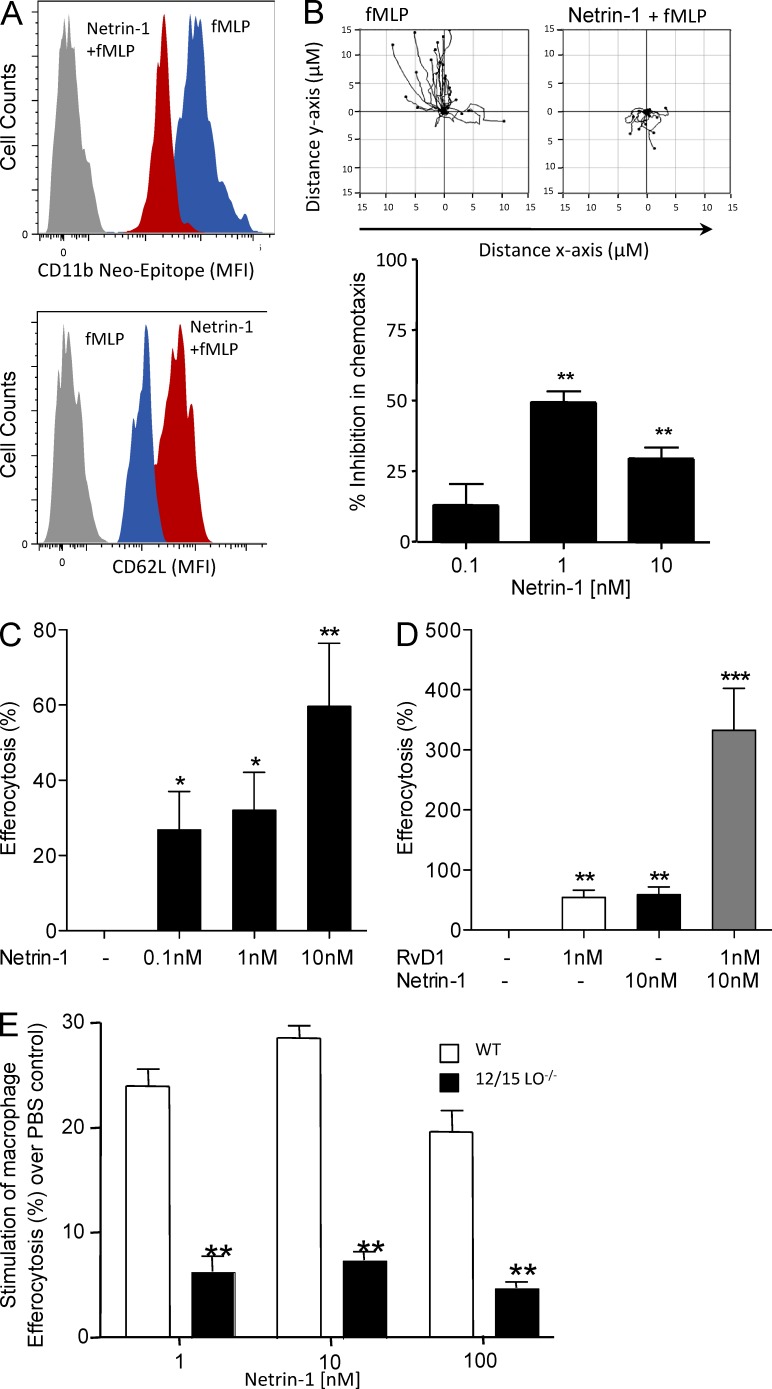
Figure 7. Netrin-1 reduces human PMN activation and increases Mϕ efferocytosis: Synergy with RvD1 pathway. (A) Isolated human PMN were incubated with either fMLP or netrin-1 for 30 min and the expression of CD11b (neo-epitope) and CD62L on PMN was measured by flow cytometry. (B) Isolated human PMN were placed on chemotaxis slides and exposed for 2 h to either fMLP or netrin-1. The cell migration was monitored for a 10-min period and analyzed using Image Pro Plus 7 software. (C) MΦ differentiated from peripheral blood monocytes were incubated with indicated concentrations of netrin-1. Carboxyfluorescein diacetate-labeled apoptotic PMN were added at 1:3 ratio (MΦ:PMN), and the rate of the efferocytosis was determined after 1 h by measurement of fluorescence. (D) MΦ differentiated from peripheral blood monocytes were incubated with netrin-1 in the absence or presence of RvD1. The degree of efferocytosis was performed using a fluorescent plate reader. (E) Peritoneal MΦ from WT or 12/15LO−/− mice were incubated with the indicated concentrations of netrin-1 (15 min, 37°C), the fluorescently labeled apoptotic PMN were added and the degree of efferocytosis was assessed after 1 h (37°C) using a fluorescent plate reader (see Materials and methods). Results are representative of five independent experiments (n = 5), mean ± SEM, in A–D. In E, results are representative of three independent experiments (n = 3 mice); *, P < 0.05; **, P < 0.01; ***, P < 0.001.
Figure 7. Netrin-1 reduces human PMN activation and increases Mϕ efferocytosis: Synergy with RvD1 pathway. (A) Isolated human PMN were incubated with either fMLP or netrin-1 for 30 min and the expression of CD11b (neo-epitope) and CD62L on PMN was measured by flow cytometry. (B) Isolated human PMN were placed on chemotaxis slides and exposed for 2 h to either fMLP or netrin-1. The cell migration was monitored for a 10-min period and analyzed using Image Pro Plus 7 software. (C) MΦ differentiated from peripheral blood monocytes were incubated with indicated concentrations of netrin-1. Carboxyfluorescein diacetate-labeled apoptotic PMN were added at 1:3 ratio (MΦ:PMN), and the rate of the efferocytosis was determined after 1 h by measurement of fluorescence. (D) MΦ differentiated from peripheral blood monocytes were incubated with netrin-1 in the absence or presence of RvD1. The degree of efferocytosis was performed using a fluorescent plate reader. (E) Peritoneal MΦ from WT or 12/15LO−/− mice were incubated with the indicated concentrations of netrin-1 (15 min, 37°C), the fluorescently labeled apoptotic PMN were added and the degree of efferocytosis was assessed after 1 h (37°C) using a fluorescent plate reader (see Materials and methods). Results are representative of five independent experiments (n = 5), mean ± SEM, in A–D. In E, results are representative of three independent experiments (n = 3 mice); *, P < 0.05; **, P < 0.01; ***, P < 0.001.CC BY-NC-SA · PubMed Central

Verification

Claims the paper makes

The claims and statistics of this paper haven’t been checked yet.

Run the check — free, no account needed. It reads the open-access text and checks the sources it cites.

A few free checks a day · papers already verified open instantly · results are public

Claims other papers make about this one

Each is checked against this paper’s own text: does it say what the citing paper says it does?

Self-check

Percentages, sums and reported differences re-computed from the paper’s own numbers.

The self-check needs the paper’s full text.

Citations

Cites

Show all 33 references

Cited by

Sorted by citations

See all 176

Metadata

Authors
Mirakaj, V., Dalli, J., Granja, T., Rosenberger, P., & Serhan, C. N.
Affiliations
  • Brigham and Women's Hospital (US)
  • University of Tübingen (DE)
Corresponding author
  • Rosenberger, Peter
  • Serhan, Charles N.
Venue
Journal of Experimental Medicine
Published
2014-05-26
Volume
211
Issue
6
Pages
1037-1048
ISSN
  • 0022-1007 (ISSN-L)
  • 1540-9538
OpenAlex
W2162294258
Cited by
176
References
33
Citations by year
2026: 6 · 2025: 13 · 2024: 8 · 2023: 6 · 2022: 20 · 2021: 27 · 2020: 14 · 2019: 9 · 2018: 19 · 2017: 21 · 2016: 15 · 2015: 12 · 2014: 5
FWCI
9.20
Type
journal article
Language
en
Open access
Locations
  • The Journal of Experimental Medicine (publishedVersion)
  • PubMed Central (publishedVersion, cc-by-nc-sa)
  • PubMed (publishedVersion)
  • Digital Access to Scholarship at Harvard (DASH) (Harvard University) (submittedVersion, cc-by)
Funders
  • National Institute of General Medical Sciences (R01GM038765)
  • National Institute of Neurological Disorders and Stroke (R01NS067686)
Topics
  • Life Sciences › Neuroscience › Neurology › Vagus Nerve Stimulation Research
  • Health Sciences › Nursing › Nutrition and Dietetics › Fatty Acid Research and Health
  • Life Sciences › Immunology and Microbiology › Immunology › Phagocytosis and Immune Regulation
Keywords
vagus nerve, inflammation resolution, specialized pro-resolving mediators, netrin-1, resolvin D1, vagotomy, peritonitis, zymosan, neutrophil influx, efferocytosis, resolvins, protectins, lipoxins, monocytes, bidirectional signaling
MeSH terms
Netrin-1, Animals, Cells, Cultured, Chemotaxis, Docosahexaenoic Acids, Humans, Inflammation, Lipids, Macrophages, Mice, Inbred C57BL, Microscopy, Fluorescence, Monocytes, Nerve Growth Factors, Neutrophils, Peritonitis, Recombinant Proteins, Vagotomy, Vagus Nerve, Zymosan, Blotting, Western, Mice, Knockout, Inflammation Mediators, Reverse Transcriptase Polymerase Chain Reaction, Tumor Suppressor Proteins, Lipoxins, Mice

About these checks

Registry, retraction, Cites and statistics results are computed, not judged, with one exception: a printed reference that no index lists is read once by a model before it counts as a citation error. Claims are extracted by a model and kept only when their quote appears verbatim in the text; each cited source is then checked, with a model’s help, for whether it says what the claim relies on. Those verdicts can be wrong — read the claim’s quote and the cited source before relying on one.

Statistics and arithmetic are recomputed, not judged.

Confidence bands are shown only for fields calibrated on our annotated test set. None is calibrated yet, so no band is shown.

What counts as a claim ›How we measure confidence ›How we check this ›

Are you an author, or do you see a problem with this page? Request a review