Cited by 8

The DOI matches its Crossref record; 6 of the 6 references it cites were found in a registry or an index.

The protozoan commensal Tritrichomonas musculis is a natural adjuvant for mucosal IgA

Cao, Eric Yixiao, Burrows, Kyle, Chiaranunt, Pailin, Popovic, Ana, Zhou, Xueyang, Xie, Cong, Thakur, Ayushi, Britton, Graham, Spindler, Matthew, Ngai, Louis, Tai, Siu Ling, Dasoveanu, Dragos Cristian, Nguyen, Albert, Faith, Jeremiah J., Parkinson, John, Gommerman, Jennifer L., Mortha, Arthur·2024·Journal of Experimental Medicine

Published version of a preprint

Abstract

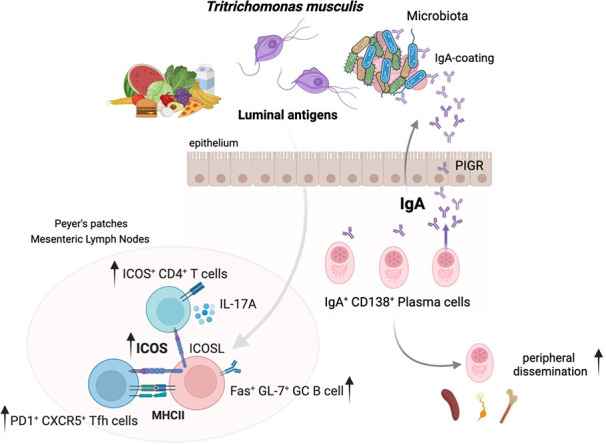
Immunoglobulin (Ig) A supports mucosal immune homeostasis and host–microbiota interactions. While commensal bacteria are known for their ability to promote IgA, the role of non-bacterial commensal microbes in the induction of IgA remains elusive. Here, we demonstrate that permanent colonization with the protozoan commensal Tritrichomonas musculis (T.mu) promotes T cell–dependent, IgA class-switch recombination, and intestinal accumulation of IgA-secreting plasma cells (PC). T.mu colonization specifically drives the expansion of T follicular helper cells and a unique ICOS+ non-Tfh cell population, accompanied by an increase in germinal center B cells. Blockade of ICOS:ICOSL co-stimulation or MHCII-expression on B cells is central for the induction of IgA following colonization by T.mu, implicating a previously underappreciated mode of IgA induction following protozoan commensal colonization. Finally, T.mu further improves the induction of IgA-secreting PC specific to orally ingested antigens and their peripheral dissemination, identifying T.mu as a “natural adjuvant” for IgA. Collectively, these findings propose a protozoa-driven mode of IgA induction to support intestinal immune homeostasis.

Overview

The claims and statistics of this paper haven’t been checked yet.

Run the check — free, no account needed. It reads the open-access text and checks the sources it cites.

A few free checks a day · papers already verified open instantly · results are public

Integrity signals

Registry

Crossref · 10.1084/jem.20221727

Cites

6 of 6 references verified0 citation errors · 0 not checkable

Statistics

Figures

Graphical abstract
Graphical abstract CC BY · PubMed Central
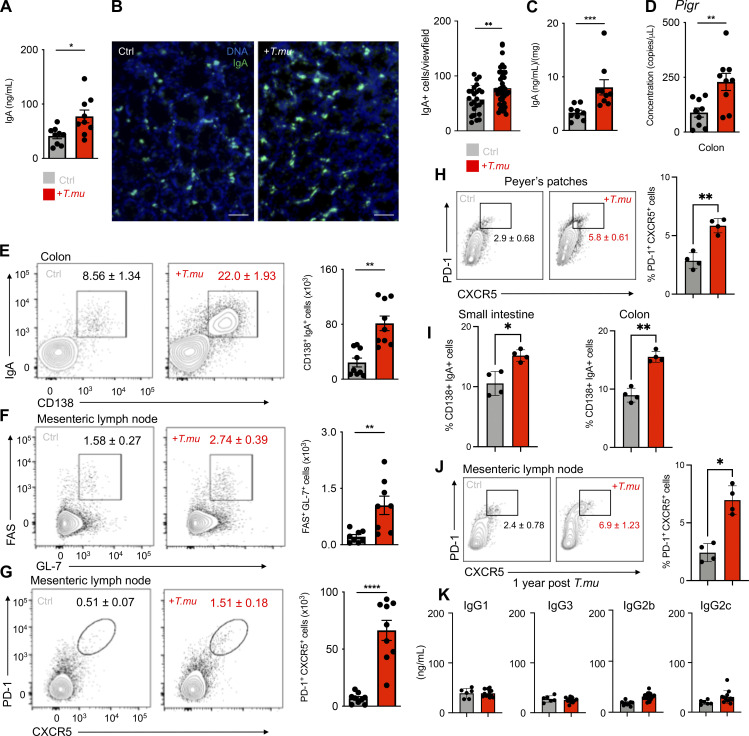
Figure 1. T.mu induces mucosal IgA. (A) Serum IgA levels in control and T.mu colonized mice. (B) Representative immunofluorescence images of colonic tissue sections from control (left) and T.mu colonized mice (right) samples. Sections were stained with anti-IgA antibodies. Adjacent bar graph shows the quantification of IgA+ cells. (C) IgA levels in fecal samples. (D) Gene expression of Pigr in whole colonic tissue. (E) Representative contour plots of colonic lamina propria leukocytes stained for IgA and CD138. Gates identify IgA+CD138+ PC. (F) Contour plots show FAS+GL-7+ GC B cells in the MLN of control or T.mu colonized mice. (G) Representative flow cytometry plots identifying PD-1+CXCR5+ Tfh cells in the MLN of control or T.mu colonized mice. Numbers adjacent to gates show percentages ± SEM in E–G. Bar graphs adjacent to E–G show absolute numbers of the indicated cell type ± SEM. (H) Representative flow cytometry plots identifying PD-1+CXCR5+ Tfh cells in the PP of control or T.mu colonized mice. Numbers adjacent to gates show percentages ± SEM and the adjacent bar graph indicates quantification across two independent experiments. (I) Bar graphs show percentages of small and large intestinal IgA+CD138+ PC in control and T.mu colonized mice. (J) Representative flow cytometry plots identifying PD-1+CXCR5+ Tfh cells in the MLN on control mice or animals colonized with T.mu for 1 year. Numbers adjacent to gates show percentages ± SEM and adjacent bar graph indicates quantification across two independent experiments. (K) Bar graphs indicate concentrations of IgG isotypes in the serum of control or T.mu colonized mice. Data from at least two to three independent experiments with two to four mice/group are shown. Mann–Whitney U test was performed. * = P ≤ 0.05, ** = P < 0.01, *** = P < 0.001, **** = P < 0.0001, NS = not significant. If not stated otherwise, displayed values include ± SEM.
Figure 1. T.mu induces mucosal IgA. (A) Serum IgA levels in control and T.mu colonized mice. (B) Representative immunofluorescence images of colonic tissue sections from control (left) and T.mu colonized mice (right) samples. Sections were stained with anti-IgA antibodies. Adjacent bar graph shows the quantification of IgA+ cells. (C) IgA levels in fecal samples. (D) Gene expression of Pigr in whole colonic tissue. (E) Representative contour plots of colonic lamina propria leukocytes stained for IgA and CD138. Gates identify IgA+CD138+ PC. (F) Contour plots show FAS+GL-7+ GC B cells in the MLN of control or T.mu colonized mice. (G) Representative flow cytometry plots identifying PD-1+CXCR5+ Tfh cells in the MLN of control or T.mu colonized mice. Numbers adjacent to gates show percentages ± SEM in E–G. Bar graphs adjacent to E–G show absolute numbers of the indicated cell type ± SEM. (H) Representative flow cytometry plots identifying PD-1+CXCR5+ Tfh cells in the PP of control or T.mu colonized mice. Numbers adjacent to gates show percentages ± SEM and the adjacent bar graph indicates quantification across two independent experiments. (I) Bar graphs show percentages of small and large intestinal IgA+CD138+ PC in control and T.mu colonized mice. (J) Representative flow cytometry plots identifying PD-1+CXCR5+ Tfh cells in the MLN on control mice or animals colonized with T.mu for 1 year. Numbers adjacent to gates show percentages ± SEM and adjacent bar graph indicates quantification across two independent experiments. (K) Bar graphs indicate concentrations of IgG isotypes in the serum of control or T.mu colonized mice. Data from at least two to three independent experiments with two to four mice/group are shown. Mann–Whitney U test was performed. * = P ≤ 0.05, ** = P < 0.01, *** = P < 0.001, **** = P < 0.0001, NS = not significant. If not stated otherwise, displayed values include ± SEM.CC BY · PubMed Central
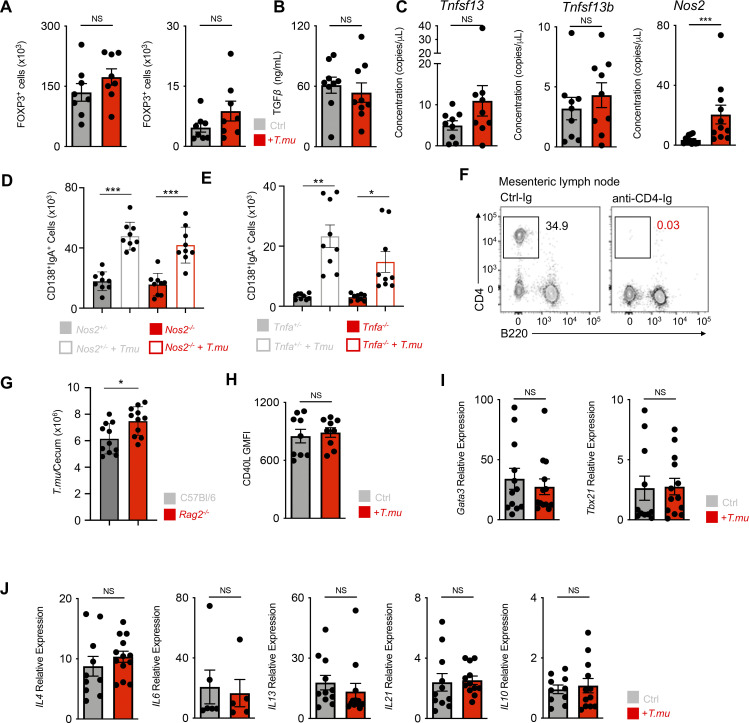
Figure S1. Unaltered Tfh cell phenotype in the presence of T.mu. (A) Quantification of FOXP3-expressing CD4+ T cells in the colonic lamina propria and MLN of control and T.mu colonized mice. (B) Quantification of bioactive TGF-β in colonic tissue explants from control and T.mu colonized mice. (C) Gene expression analysis of Tnfsf13, Tnfsf13b, and Nos2 in total colonic tissue. (D) Nos2+/− and Nos2−/− mice were either left untreated or were colonized with T.mu. IgA+CD138+ PC were quantified in the colonic lamina propria. (E) Tnfa+/− and Tnfa−/− mice were either left untreated or were colonized with T.mu. IgA+CD138+ PC were quantified in the colonic lamina propria. (F) Representative staining for CD4 on lymphocytes in the blood of mice treated with anti-CD4-Ig. (G) Absolute numbers of T.mu from the caecum of C57BL/6 and Rag2−/− mice 3 wk after oral gavage with 2 × 10⁶ FACS-sorted T.mu. (H) CD40L expression on MLN PD-1+CXCR5+ Tfh cells from control or T.mu colonized mice. (I and J) PD-1+CXCR5+ Tfh cells were sorted from the MLN of control or T.mu colonized mice. Gene expression analysis was performed for (I) transcription factors Gata3 and Tbx21 and (J) cytokines Il4, Il6, Il13, Il21, Il10. Data shown are representative of at least two to three independent experiments with three to four mice/group. Mann–Whitney U test was performed. * = P ≤ 0.05, ** = P < 0.01, *** = P < 0.001, **** = P < 0.0001, NS = not significant. If not stated otherwise, displayed values include ± SEM.
Figure S1. Unaltered Tfh cell phenotype in the presence of T.mu. (A) Quantification of FOXP3-expressing CD4+ T cells in the colonic lamina propria and MLN of control and T.mu colonized mice. (B) Quantification of bioactive TGF-β in colonic tissue explants from control and T.mu colonized mice. (C) Gene expression analysis of Tnfsf13, Tnfsf13b, and Nos2 in total colonic tissue. (D) Nos2+/− and Nos2−/− mice were either left untreated or were colonized with T.mu. IgA+CD138+ PC were quantified in the colonic lamina propria. (E) Tnfa+/− and Tnfa−/− mice were either left untreated or were colonized with T.mu. IgA+CD138+ PC were quantified in the colonic lamina propria. (F) Representative staining for CD4 on lymphocytes in the blood of mice treated with anti-CD4-Ig. (G) Absolute numbers of T.mu from the caecum of C57BL/6 and Rag2−/− mice 3 wk after oral gavage with 2 × 10⁶ FACS-sorted T.mu. (H) CD40L expression on MLN PD-1+CXCR5+ Tfh cells from control or T.mu colonized mice. (I and J) PD-1+CXCR5+ Tfh cells were sorted from the MLN of control or T.mu colonized mice. Gene expression analysis was performed for (I) transcription factors Gata3 and Tbx21 and (J) cytokines Il4, Il6, Il13, Il21, Il10. Data shown are representative of at least two to three independent experiments with three to four mice/group. Mann–Whitney U test was performed. * = P ≤ 0.05, ** = P < 0.01, *** = P < 0.001, **** = P < 0.0001, NS = not significant. If not stated otherwise, displayed values include ± SEM.CC BY · PubMed Central
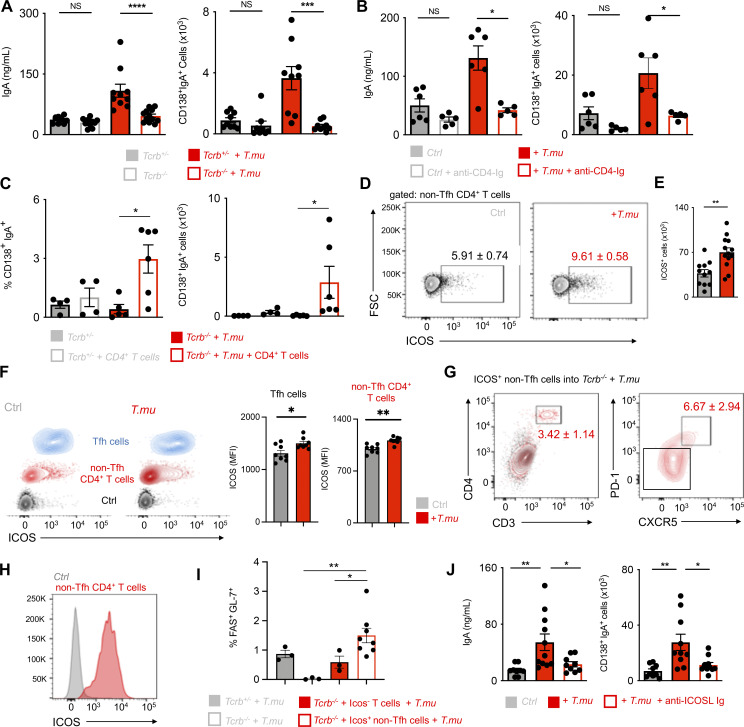
Figure 2. T.mu induces IgA in an ICOS and T cell-dependent fashion. (A) Serum IgA levels and colonic lamina propria IgA+CD138+ plasma cell numbers in control or T.mu-colonized Tcrb+/− and Tcrb−/− mice. (B) Serum IgA levels and colonic lamina propria IgA+CD138+ plasma cell numbers in control or T.mu colonized with and without anti-CD4-Ig treatment. (C) Percentages and absolute number of colonic lamina propria IgA+CD138+ PC in control or T.mu colonized Tcrb+/− and Tcrb−/− after injection of CD4+ T cells. (D) Contour plots show ICOS expression on non-Tfh cells in MLN from control mice or mice colonized with T.mu. (E) Adjacent bar graph shows quantification of absolute ICOS+ CD4+ non-Tfh cells. F) ICOS expression on PD-1+CXCR5+ Tfh cells (blue), CD4+ non-Tfh cells (red), and isotype control staining on T cells (black) from control or T.mu colonized mice. Adjacent bar graphs show quantification of ICOS mean fluorescent intensity on PD-1+CXCR5+ Tfh cells and CD4+ non-Tfh cells. (G) Adoptive transfer of purified ICOS+ PD-1− CXCR5− CD4+ non-Tfh cells into T.mu colonized Tcrb−/− mice. Contour plots show representative staining for CD3 and CD4 in Tcrb−/− mice injected with PBS (black) or purified ICOS+ PD-1− CXCR5− CD4+ non-Tfh cells (red). CD4+ T cells in the MLN of mice injected with ICOS+ PD-1− CXCR5− CD4+ non-Tfh cells were analyzed for the expression of PD-1 and CXCR5. Numbers within plots show percentages ± SEM. (H) ICOS expression on ICOS+ PD-1− CXCR5− CD4+ non-Tfh cells after adoptive transfer into T.mu colonized Tcrb−/− mice. (I) Percentages of FAS+GL-7+ GC B cells in the MLN of T.mu colonized Tcrb+/−, Tcrb−/−, or Tcrb−/− mice injected with ICOS− PD-1− CXCR5− CD4+ T cells or ICOS+ PD-1− CXCR5− CD4+ T cells. (J) Quantification of serum IgA levels and colonic IgA+CD138+ PC in control mice, mice colonized with T.mu, and T.mu colonized mice injected with blocking anti-ICOSL-Ig. Data shown are from two to three independent experiments with three to four mice/group. Mann–Whitney U test was performed. * = P ≤ 0.05, ** = P < 0.01, *** = P < 0.001, **** = P < 0.0001, NS = not significant. If not stated otherwise, displayed values include ± SEM.
Figure 2. T.mu induces IgA in an ICOS and T cell-dependent fashion. (A) Serum IgA levels and colonic lamina propria IgA+CD138+ plasma cell numbers in control or T.mu-colonized Tcrb+/− and Tcrb−/− mice. (B) Serum IgA levels and colonic lamina propria IgA+CD138+ plasma cell numbers in control or T.mu colonized with and without anti-CD4-Ig treatment. (C) Percentages and absolute number of colonic lamina propria IgA+CD138+ PC in control or T.mu colonized Tcrb+/− and Tcrb−/− after injection of CD4+ T cells. (D) Contour plots show ICOS expression on non-Tfh cells in MLN from control mice or mice colonized with T.mu. (E) Adjacent bar graph shows quantification of absolute ICOS+ CD4+ non-Tfh cells. F) ICOS expression on PD-1+CXCR5+ Tfh cells (blue), CD4+ non-Tfh cells (red), and isotype control staining on T cells (black) from control or T.mu colonized mice. Adjacent bar graphs show quantification of ICOS mean fluorescent intensity on PD-1+CXCR5+ Tfh cells and CD4+ non-Tfh cells. (G) Adoptive transfer of purified ICOS+ PD-1− CXCR5− CD4+ non-Tfh cells into T.mu colonized Tcrb−/− mice. Contour plots show representative staining for CD3 and CD4 in Tcrb−/− mice injected with PBS (black) or purified ICOS+ PD-1− CXCR5− CD4+ non-Tfh cells (red). CD4+ T cells in the MLN of mice injected with ICOS+ PD-1− CXCR5− CD4+ non-Tfh cells were analyzed for the expression of PD-1 and CXCR5. Numbers within plots show percentages ± SEM. (H) ICOS expression on ICOS+ PD-1− CXCR5− CD4+ non-Tfh cells after adoptive transfer into T.mu colonized Tcrb−/− mice. (I) Percentages of FAS+GL-7+ GC B cells in the MLN of T.mu colonized Tcrb+/−, Tcrb−/−, or Tcrb−/− mice injected with ICOS− PD-1− CXCR5− CD4+ T cells or ICOS+ PD-1− CXCR5− CD4+ T cells. (J) Quantification of serum IgA levels and colonic IgA+CD138+ PC in control mice, mice colonized with T.mu, and T.mu colonized mice injected with blocking anti-ICOSL-Ig. Data shown are from two to three independent experiments with three to four mice/group. Mann–Whitney U test was performed. * = P ≤ 0.05, ** = P < 0.01, *** = P < 0.001, **** = P < 0.0001, NS = not significant. If not stated otherwise, displayed values include ± SEM.CC BY · PubMed Central
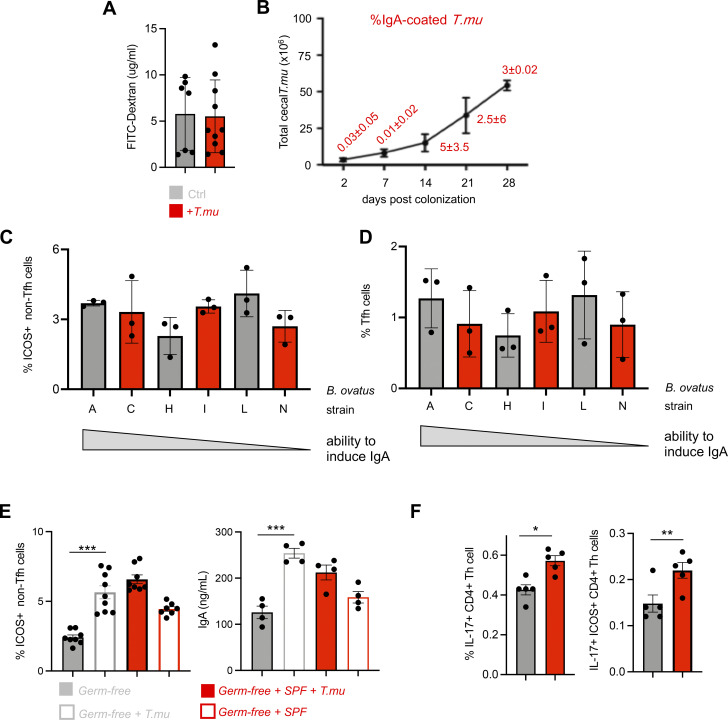
Figure S2. T.mu promotes ICOS+ CD4+ non-Tfh cells independent of the microbiota. (A) Concentrations of FITC-Dextran in the serum of control or T.mu colonized mice. (B) Total T.mu numbers in the caecum of T.mu colonized C57BL/6 mice, 2, 7, 14, 21, and 28 days after colonization. Staining of T.mu with anti-IgA was performed at the indicated time points. Red numbers adjacent to the curve indicate percentages of IgA-coated T.mu ± SEM. (C and D) Groups of germ-free mice were colonized with B. ovatus strains (A, H, N, I, C, and L). Three weeks after colonization ICOS+ CD4+ non-Tfh cells and PD-1+ CXCR5+ Tfh cells were quantified in the MLN. (E) Groups of germ-free mice were either left untreated, or were colonized with purified T.mu, purified T.mu, and a complete SPF microbiota, or a complete SPF microbiota only. ICOS+ CD4+ non-Tfh cells were quantified in the MLN and serum IgA levels were assessed 3 wk after colonization. (F) Frequencies of IL-17 producing Th cells and ICOS+ CD4+ non-Tfh cells were assessed in the MLN of control of T.mu-colonized mice. Data shown are representative of at least two to three independent experiments with three to four mice/group. If not stated otherwise, displayed values include ± SEM.
Figure S2. T.mu promotes ICOS+ CD4+ non-Tfh cells independent of the microbiota. (A) Concentrations of FITC-Dextran in the serum of control or T.mu colonized mice. (B) Total T.mu numbers in the caecum of T.mu colonized C57BL/6 mice, 2, 7, 14, 21, and 28 days after colonization. Staining of T.mu with anti-IgA was performed at the indicated time points. Red numbers adjacent to the curve indicate percentages of IgA-coated T.mu ± SEM. (C and D) Groups of germ-free mice were colonized with B. ovatus strains (A, H, N, I, C, and L). Three weeks after colonization ICOS+ CD4+ non-Tfh cells and PD-1+ CXCR5+ Tfh cells were quantified in the MLN. (E) Groups of germ-free mice were either left untreated, or were colonized with purified T.mu, purified T.mu, and a complete SPF microbiota, or a complete SPF microbiota only. ICOS+ CD4+ non-Tfh cells were quantified in the MLN and serum IgA levels were assessed 3 wk after colonization. (F) Frequencies of IL-17 producing Th cells and ICOS+ CD4+ non-Tfh cells were assessed in the MLN of control of T.mu-colonized mice. Data shown are representative of at least two to three independent experiments with three to four mice/group. If not stated otherwise, displayed values include ± SEM.CC BY · PubMed Central
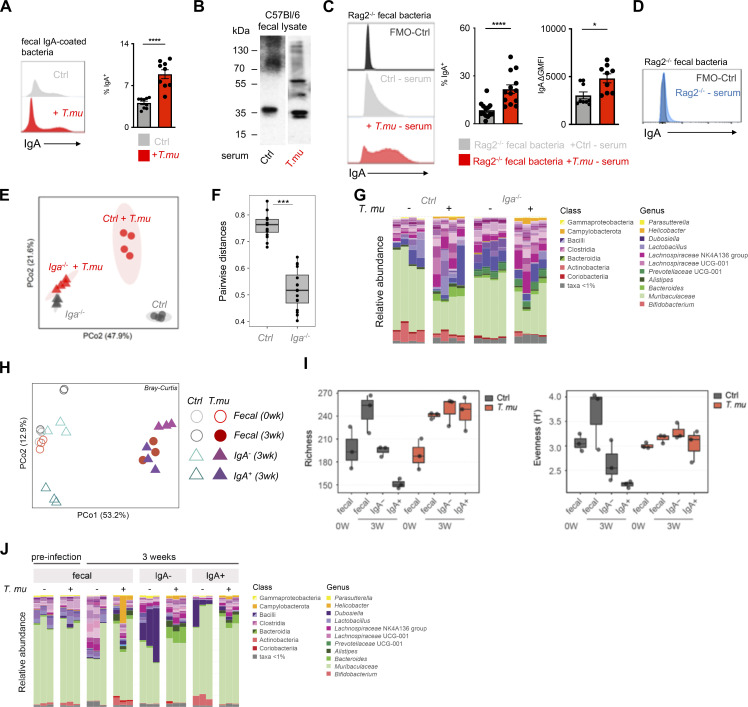
Figure 3. T.mu shapes the anti-bacterial IgA reactome. (A) Fecal bacteria were isolated from control or T.mu colonized mice and stained with anti-IgA antibodies. Histograms show staining of anti-IgA antibodies. Adjacent bar graph shows the quantification of IgA-coated bacteria. (B) Western blot analysis of IgA reactivity on wild type C57BL/6 fecal bacterial protein lysates. Membranes were developed after incubation with serum from control mice or T.mu colonized mice. Numbers adjacent to membranes indicate molecular weight. (C) Serum from control mice or T.mu colonized mice was collected and used to stain fecal bacteria obtained from Rag2−/− mice. Histogram shows coating of fecal bacteria with serum IgA. Adjacent bar graphs show quantification of IgA-coated bacteria and the serum staining intensity displayed as mean fluorescent intensity normalized to controls. (D) Fecal bacteria obtained from Rag2−/− mice were stained with serum from Rag2−/− mice (blue histogram). (E) PCoA of 16S rDNA gene sequencing data obtained from fecal samples collected from control and T.mu colonized littermates and Iga−/− mice. (F) Pairwise distance comparison of microbial communities in littermate controls and Iga−/− mice free of or colonized with T.mu. (G) Relative abundance of bacterial OTUs in littermate control and Iga−/− mice free of or colonized with T.mu. colored by phylum as indicated. (H) PCoA of 16S rDNA gene sequencing data obtained from fecal samples or sorted IgA− and IgA-coated bacteria, collected from control and T.mu colonized mice. (I) Bacterial richness of fecal and flow-sorted microbiota from control or T.mu colonized mice Bacterial evenness of fecal and flow-sorted microbiota from control or T.mu colonized mice. (J) Relative abundance of bacterial OTUs in fecal and flow sorted microbiota from control or T.mu colonized mice. Data shown is representative of at least one to three independent experiments with three to four mice/group. Mann–Whitney U test was performed. * = P ≤ 0.05, ** = P < 0.01, *** = P < 0.001, **** = P < 0.0001, NS = not significant. If not stated otherwise, displayed values include ± SEM. Source data are available for this figure: SourceData F3.
Figure 3. T.mu shapes the anti-bacterial IgA reactome. (A) Fecal bacteria were isolated from control or T.mu colonized mice and stained with anti-IgA antibodies. Histograms show staining of anti-IgA antibodies. Adjacent bar graph shows the quantification of IgA-coated bacteria. (B) Western blot analysis of IgA reactivity on wild type C57BL/6 fecal bacterial protein lysates. Membranes were developed after incubation with serum from control mice or T.mu colonized mice. Numbers adjacent to membranes indicate molecular weight. (C) Serum from control mice or T.mu colonized mice was collected and used to stain fecal bacteria obtained from Rag2−/− mice. Histogram shows coating of fecal bacteria with serum IgA. Adjacent bar graphs show quantification of IgA-coated bacteria and the serum staining intensity displayed as mean fluorescent intensity normalized to controls. (D) Fecal bacteria obtained from Rag2−/− mice were stained with serum from Rag2−/− mice (blue histogram). (E) PCoA of 16S rDNA gene sequencing data obtained from fecal samples collected from control and T.mu colonized littermates and Iga−/− mice. (F) Pairwise distance comparison of microbial communities in littermate controls and Iga−/− mice free of or colonized with T.mu. (G) Relative abundance of bacterial OTUs in littermate control and Iga−/− mice free of or colonized with T.mu. colored by phylum as indicated. (H) PCoA of 16S rDNA gene sequencing data obtained from fecal samples or sorted IgA− and IgA-coated bacteria, collected from control and T.mu colonized mice. (I) Bacterial richness of fecal and flow-sorted microbiota from control or T.mu colonized mice Bacterial evenness of fecal and flow-sorted microbiota from control or T.mu colonized mice. (J) Relative abundance of bacterial OTUs in fecal and flow sorted microbiota from control or T.mu colonized mice. Data shown is representative of at least one to three independent experiments with three to four mice/group. Mann–Whitney U test was performed. * = P ≤ 0.05, ** = P < 0.01, *** = P < 0.001, **** = P < 0.0001, NS = not significant. If not stated otherwise, displayed values include ± SEM. Source data are available for this figure: SourceData F3.CC BY · PubMed Central
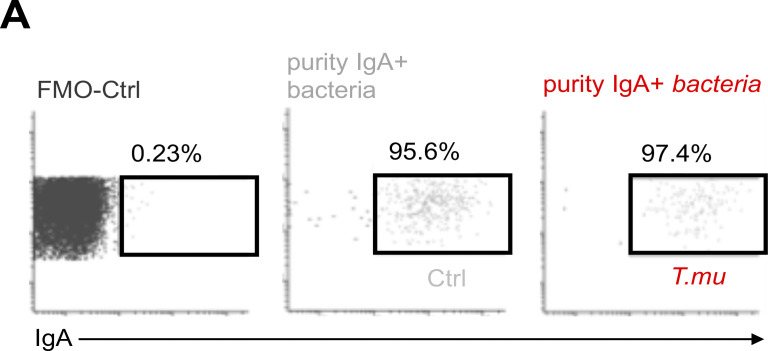
Figure S3. Purity of sorted IgA-coated bacteria. (A) Post sort analysis of IgA-coated bacteria purified from control or T.mu colonized mice. Values adjacent to gates indicate percentages.
Figure S3. Purity of sorted IgA-coated bacteria. (A) Post sort analysis of IgA-coated bacteria purified from control or T.mu colonized mice. Values adjacent to gates indicate percentages.CC BY · PubMed Central
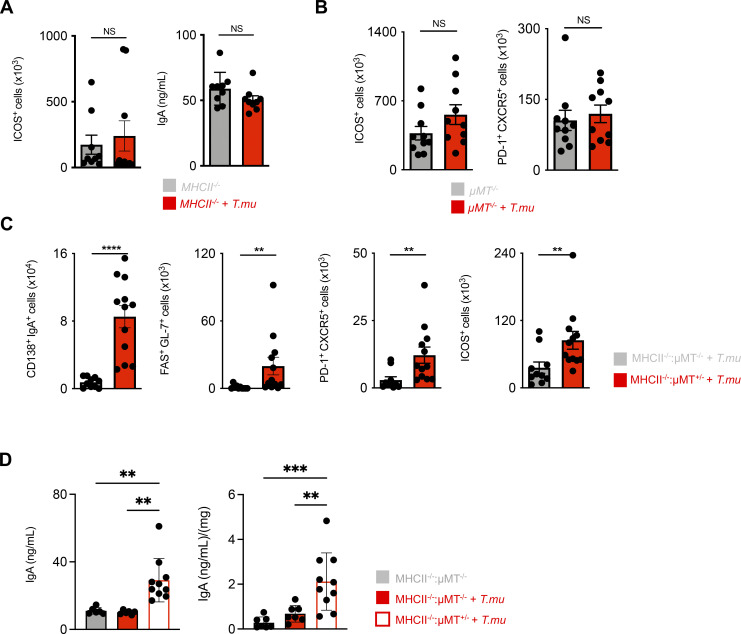
Figure 4. T.mu-driven IgA requires antigen-presentation by B cells. (A) Quantification of ICOS+ CD4+ non-Tfh cells in the MLN and serum IgA levels in control and T.mu colonized MHCII−/− mice. (B) Quantification of MLN ICOS+ CD4+ non-Tfh cell and Tfh cell numbers in µMT−/− control mice or µMT−/− mice colonized with T.mu. (C) Analysis of bone marrow chimeric mice. Groups of mice received a 50:50 mixture of either MHCII−/− µMT−/− or MHCII+/− µMT+/− bone marrow cells after lethal irradiation and were colonized with T.mu after full bone marrow reconstitution. Absolute numbers of colonic IgA+CD138+ PC, MLN FAS+GL-7+ GC B cells, PD-1+CXCR5+ Tfh cells, and ICOS+ CD4+ non-Tfh cells were quantified. (D) Serum and fecal IgA levels in control or T.mu colonized MHCII−/− µMT−/− mice and T.mu-colonized MHCII−/− µMT+/− mice. Data shown are representative of at least three independent experiments with three to four mice/group. Mann–Whitney U test was performed. * = P ≤ 0.05, ** = P < 0.01, *** = P < 0.001, **** = P < 0.0001, NS = not significant. If not stated otherwise, displayed values include ± SEM.
Figure 4. T.mu-driven IgA requires antigen-presentation by B cells. (A) Quantification of ICOS+ CD4+ non-Tfh cells in the MLN and serum IgA levels in control and T.mu colonized MHCII−/− mice. (B) Quantification of MLN ICOS+ CD4+ non-Tfh cell and Tfh cell numbers in µMT−/− control mice or µMT−/− mice colonized with T.mu. (C) Analysis of bone marrow chimeric mice. Groups of mice received a 50:50 mixture of either MHCII−/− µMT−/− or MHCII+/− µMT+/− bone marrow cells after lethal irradiation and were colonized with T.mu after full bone marrow reconstitution. Absolute numbers of colonic IgA+CD138+ PC, MLN FAS+GL-7+ GC B cells, PD-1+CXCR5+ Tfh cells, and ICOS+ CD4+ non-Tfh cells were quantified. (D) Serum and fecal IgA levels in control or T.mu colonized MHCII−/− µMT−/− mice and T.mu-colonized MHCII−/− µMT+/− mice. Data shown are representative of at least three independent experiments with three to four mice/group. Mann–Whitney U test was performed. * = P ≤ 0.05, ** = P < 0.01, *** = P < 0.001, **** = P < 0.0001, NS = not significant. If not stated otherwise, displayed values include ± SEM.CC BY · PubMed Central
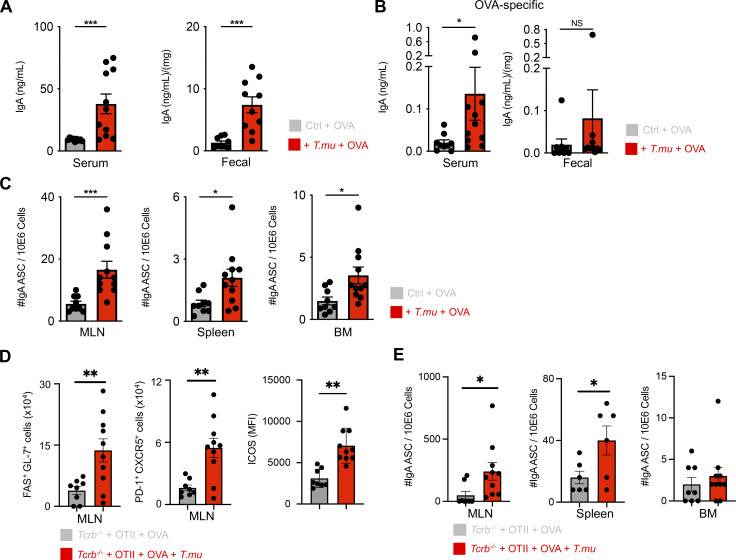
Figure 5. T.mu promotes peripheral dissemination of IgA-secreting plasma cells primed against gut antigens. (A) Groups of control or T.mu colonized mice were treated with OVA-containing drinking water ad libitum for 3 wk. Total serum and fecal IgA levels were assessed. (B) OVA-specific IgA levels were determined in the serum or feces of OVA-treated mice in the presence or absence of T.mu. (C) MLN, spleens, and bone marrow were harvested from mice used in A, and numbers of OVA-specific anti-IgA–secreting cells (ASC) were determined. (D) Purified CD4+ OTIITg T cells were adoptively transferred into control or T.mu colonized Tcrb−/− mice followed by treatment with OVA-containing drinking water. MLNs were analyzed for FAS+GL-7+ GC B cells, PD-1+CXCR5+ Tfh cells, and ICOS expression on non-Tfh cells. (E) MLN, spleens, and bone marrow were harvested from animals used in D, and numbers of OVA-specific anti-IgA secreting cells (ASC) determined. Data shown are representative of at least two to three independent experiments with three to four mice/group. Mann–Whitney U test was performed. * = P ≤ 0.05, ** = P < 0.01, *** = P < 0.001, **** = P < 0.0001, NS = not significant. If not stated otherwise, displayed values include ± SEM.
Figure 5. T.mu promotes peripheral dissemination of IgA-secreting plasma cells primed against gut antigens. (A) Groups of control or T.mu colonized mice were treated with OVA-containing drinking water ad libitum for 3 wk. Total serum and fecal IgA levels were assessed. (B) OVA-specific IgA levels were determined in the serum or feces of OVA-treated mice in the presence or absence of T.mu. (C) MLN, spleens, and bone marrow were harvested from mice used in A, and numbers of OVA-specific anti-IgA–secreting cells (ASC) were determined. (D) Purified CD4+ OTIITg T cells were adoptively transferred into control or T.mu colonized Tcrb−/− mice followed by treatment with OVA-containing drinking water. MLNs were analyzed for FAS+GL-7+ GC B cells, PD-1+CXCR5+ Tfh cells, and ICOS expression on non-Tfh cells. (E) MLN, spleens, and bone marrow were harvested from animals used in D, and numbers of OVA-specific anti-IgA secreting cells (ASC) determined. Data shown are representative of at least two to three independent experiments with three to four mice/group. Mann–Whitney U test was performed. * = P ≤ 0.05, ** = P < 0.01, *** = P < 0.001, **** = P < 0.0001, NS = not significant. If not stated otherwise, displayed values include ± SEM.CC BY · PubMed Central

Verification

Claims the paper makes

The claims and statistics of this paper haven’t been checked yet.

Run the check — free, no account needed. It reads the open-access text and checks the sources it cites.

A few free checks a day · papers already verified open instantly · results are public

Claims other papers make about this one

Each is checked against this paper’s own text: does it say what the citing paper says it does?

Self-check

Percentages, sums and reported differences re-computed from the paper’s own numbers.

The self-check needs the paper’s full text.

Citations

Cites

Show all 6 references

Research works printed but not linked: 52

  1. Belkaid, 2014, Role of the microbiota in immunity and inflammation, Cell, 157, 121, 10.1016/j.cell.2014.03.011 · DOI · Paper page
  2. Bhinder, 2014, Intestinal epithelium-specific MyD88 signaling impacts host susceptibility to infectious colitis by promoting protective goblet cell and antimicrobial responses, Infect. Immun., 82, 3753, 10.1128/IAI.02045-14 · DOI
  3. Blander, 2017, Regulation of inflammation by microbiota interactions with the host, Nat. Immunol., 18, 851, 10.1038/ni.3780 · DOI
  4. Boyaka, 2017, Inducing mucosal IgA: A challenge for vaccine adjuvants and delivery systems, J. Immunol., 199, 9, 10.4049/jimmunol.1601775 · DOI
  5. Brandtzaeg, 2009, Mucosal immunity: Induction, dissemination, and effector functions, Scand. J. Immunol., 70, 505, 10.1111/j.1365-3083.2009.02319.x · DOI
  6. Brandtzaeg, 1984, Direct evidence for an integrated function of J chain and secretory component in epithelial transport of immunoglobulins, Nature, 311, 71, 10.1038/311071a0 · DOI
  7. Bunker, 2015, Innate and adaptive humoral responses coat distinct commensal bacteria with immunoglobulin A, Immunity, 43, 541, 10.1016/j.immuni.2015.08.007 · DOI
  8. Burrows, 2020, Rapid isolation of mouse ILCs from murine intestinal tissues, Methods Enzymol., 631, 305, 10.1016/bs.mie.2019.10.001 · DOI
  9. Cao, 2012, Th17 cells upregulate polymeric Ig receptor and intestinal IgA and contribute to intestinal homeostasis, J. Immunol., 189, 4666, 10.4049/jimmunol.1200955 · DOI
  10. Cao, 2020, Tritrichomonas spp. and their impact on gut immune homeostasis, 133, 10.1007/978-3-030-44826-4_10 · DOI
  11. Caporaso, 2012, Ultra-high-throughput microbial community analysis on the Illumina HiSeq and MiSeq platforms, ISME J., 6, 1621, 10.1038/ismej.2012.8 · DOI · Paper page
  12. Cazac, 2000, TGF-beta receptor controls B cell responsiveness and induction of IgA in vivo, Immunity, 13, 443, 10.1016/S1074-7613(00)00044-3 · DOI
  13. Cerutti, 2008, The regulation of IgA class switching, Nat. Rev. Immunol., 8, 421, 10.1038/nri2322 · DOI
  14. Cerutti, 2011, Immunoglobulin responses at the mucosal interface, Annu. Rev. Immunol., 29, 273, 10.1146/annurev-immunol-031210-101317 · DOI
  15. Chiaranunt, 2022, NLRP1B and NLRP3 control the host response following colonization with the commensal protist Tritrichomonas musculis, J. Immunol., 208, 1782, 10.4049/jimmunol.2100802 · DOI
  16. Deenick, 2010, Follicular helper T cell differentiation requires continuous antigen presentation that is independent of unique B cell signaling, Immunity, 33, 241, 10.1016/j.immuni.2010.07.015 · DOI
  17. Edgar, 2010, Search and clustering orders of magnitude faster than BLAST, Bioinformatics, 26, 2460, 10.1093/bioinformatics/btq461 · DOI
  18. Edgar, 2013, UPARSE: Highly accurate OTU sequences from microbial amplicon reads, Nat. Methods, 10, 996, 10.1038/nmeth.2604 · DOI
  19. Edgar, 2015, Error filtering, pair assembly and error correction for next-generation sequencing reads, Bioinformatics, 31, 3476, 10.1093/bioinformatics/btv401 · DOI
  20. Escalante, 2016, The common mouse protozoa Tritrichomonas muris alters mucosal T cell homeostasis and colitis susceptibility, J. Exp. Med., 213, 2841, 10.1084/jem.20161776 · DOI
  21. Fadlallah, 2019, Synergistic convergence of microbiota-specific systemic IgG and secretory IgA, J. Allergy Clin. Immunol., 143, 1575, 10.1016/j.jaci.2018.09.036 · DOI
  22. Fagarasan, 2010, Adaptive immune regulation in the gut: T cell-dependent and T cell-independent IgA synthesis, Annu. Rev. Immunol., 28, 243, 10.1146/annurev-immunol-030409-101314 · DOI
  23. Hapfelmeier, 2010, Reversible microbial colonization of germ-free mice reveals the dynamics of IgA immune responses, Science, 328, 1705, 10.1126/science.1188454 · DOI · Paper page
  24. Hou, 2014, Follicular dendritic cell secreted protein FDC-SP controls IgA production, Mucosal Immunol., 7, 948, 10.1038/mi.2013.113 · DOI
  25. Howitt, 2016, Tuft cells, taste-chemosensory cells, orchestrate parasite type 2 immunity in the gut, Science, 351, 1329, 10.1126/science.aaf1648 · DOI
  26. Ise, 2018, T follicular helper cell-germinal center B cell interaction strength regulates entry into plasma cell or recycling germinal center cell fate, Immunity, 48, 702, 10.1016/j.immuni.2018.03.027 · DOI
  27. Isho, 2021, Fantastic IgA plasma cells and where to find them, Immunol. Rev., 303, 119, 10.1111/imr.12980 · DOI
  28. Israf, 2004, Enhancement of ovalbumin-specific IgA responses via oral boosting with antigen co-administered with an aqueous Solanum torvum extract, Life Sci., 75, 397, 10.1016/j.lfs.2003.10.038 · DOI
  29. Johansen, 2011, Regulation of the polymeric immunoglobulin receptor and IgA transport: New advances in environmental factors that stimulate pIgR expression and its role in mucosal immunity, Mucosal Immunol., 4, 598, 10.1038/mi.2011.37 · DOI
  30. Landuyt, 2021, ICOS ligand and IL-10 synergize to promote host-microbiota mutualism, Proc. Natl. Acad. Sci. USA, 118, 10.1073/pnas.2018278118 · DOI
  31. Li, 2020, Mucosal or systemic microbiota exposures shape the B cell repertoire, Nature, 584, 274, 10.1038/s41586-020-2564-6 · DOI
  32. Li, 2019, Toll-like receptor 2 (TLR2) and TLR4 mediate the IgA immune response induced by mycoplasma hyopneumoniae, Infect. Immun., 88, 10.1128/IAI.00697-19 · DOI
  33. Ma, 2012, The origins, function, and regulation of T follicular helper cells, J. Exp. Med., 209, 1241, 10.1084/jem.20120994 · DOI
  34. Macpherson, 2004, Induction of protective IgA by intestinal dendritic cells carrying commensal bacteria, Science, 303, 1662, 10.1126/science.1091334 · DOI · Paper page
  35. McAdam, 2001, ICOS is critical for CD40-mediated antibody class switching, Nature, 409, 102, 10.1038/35051107 · DOI
  36. Mei, 2009, Blood-borne human plasma cells in steady state are derived from mucosal immune responses, Blood, 113, 2461, 10.1182/blood-2008-04-153544 · DOI
  37. Muramatsu, 2000, Class switch recombination and hypermutation require activation-induced cytidine deaminase (AID), a potential RNA editing enzyme, Cell, 102, 553, 10.1016/S0092-8674(00)00078-7 · DOI
  38. Nadjsombati, 2018, Detection of succinate by intestinal tuft cells triggers a type 2 innate immune circuit, Immunity, 49, 33, 10.1016/j.immuni.2018.06.016 · DOI · Paper page
  39. Neutra, 1996, Antigen sampling across epithelial barriers and induction of mucosal immune responses, Annu. Rev. Immunol., 14, 275, 10.1146/annurev.immunol.14.1.275 · DOI
  40. Odegard, 2008, ICOS-dependent extrafollicular helper T cells elicit IgG production via IL-21 in systemic autoimmunity, J. Exp. Med., 205, 2873, 10.1084/jem.20080840 · DOI
  41. Palm, 2014, Immunoglobulin A coating identifies colitogenic bacteria in inflammatory bowel disease, Cell, 158, 1000, 10.1016/j.cell.2014.08.006 · DOI · Paper page
  42. Popovic, 2024, Commensal protist Tritrichomonas musculus exhibits a dynamic life cycle that induces extensive remodeling of the gut microbiota, ISME J., 18, wrae023, 10.1093/ismejo/wrae023 · DOI
  43. Price, 2009, FastTree: Computing large minimum evolution trees with profiles instead of a distance matrix, Mol. Biol. Evol., 26, 1641, 10.1093/molbev/msp077 · DOI · Paper page
  44. Reperant, 1992, Immunological characterization of a 17-kDa antigen from Cryptosporidium parvum recognized early by mucosal IgA antibodies, FEMS Microbiol. Lett., 78, 7, 10.1111/j.1574-6968.1992.tb05534.x · DOI
  45. Rognes, 2016, VSEARCH: A versatile open source tool for metagenomics, PeerJ, 4, 10.7717/peerj.2584 · DOI
  46. Sanderson, 1989, B lymphocytes express and lose syndecan at specific stages of differentiation, Cell Regul., 1, 27, 10.1091/mbc.1.1.27 · DOI
  47. Tan, 2021, Functional human IgA targets a conserved site on malaria sporozoites, Sci. Transl. Med., 13, 10.1126/scitranslmed.abg2344 · DOI
  48. Tezuka, 2007, Regulation of IgA production by naturally occurring TNF/iNOS-producing dendritic cells, Nature, 448, 929, 10.1038/nature06033 · DOI
  49. Tezuka, 2019, Regulation of IgA production by intestinal dendritic cells and related cells, Front. Immunol., 10, 1891, 10.3389/fimmu.2019.01891 · DOI
  50. Thouvenel, 2021, Multimeric antibodies from antigen-specific human IgM+ memory B cells restrict Plasmodium parasites, J. Exp. Med., 218, 10.1084/jem.20200942 · DOI
  51. Wan, 2007, Regulatory T-cell functions are subverted and converted owing to attenuated Foxp3 expression, Nature, 445, 766, 10.1038/nature05479 · DOI
  52. Wang, 2007, Naive Bayesian classifier for rapid assignment of rRNA sequences into the new bacterial taxonomy, Appl. Environ. Microbiol., 73, 5261, 10.1128/AEM.00062-07 · DOI

Cited by

Sorted by citations

See all 8

Metadata

Authors
Cao, E. Y., Burrows, K., Chiaranunt, P., Popovic, A., Zhou, X., Xie, C., Thakur, A., Britton, G., Spindler, M., Ngai, L., Tai, S. L., Dasoveanu, D. C., Nguyen, A., Faith, J. J., Parkinson, J., Gommerman, J. L., & Mortha, A.
Venue
Journal of Experimental Medicine
Published
2024-11-13
Volume
221
Issue
12
ISSN
  • 0022-1007
  • 1540-9538
Cited by
8
References
6
Language
en
Funders
  • Canadian Foundation for Innovation John R. Evans Leaders Fund
  • Canadian Institutes of Health Research (PJT-388337, PJT-480765, MRT-168043, PJT-15292)
  • Natural Sciences and Engineering Research Council of Canada (RGPIN-2019-04521, RGPIN-2019-06852)
  • Canadian Allergy Asthma and Immunology Foundation
  • Canadian Association of Gastroenterology
  • Tier 2 CRC-CIHR program (CRC-2021-00511)

About these checks

Registry, retraction, Cites and statistics results are computed, not judged, with one exception: a printed reference that no index lists is read once by a model before it counts as a citation error. Claims are extracted by a model and kept only when their quote appears verbatim in the text; each cited source is then checked, with a model’s help, for whether it says what the claim relies on. Those verdicts can be wrong — read the claim’s quote and the cited source before relying on one.

Statistics and arithmetic are recomputed, not judged.

Confidence bands are shown only for fields calibrated on our annotated test set. None is calibrated yet, so no band is shown.

What counts as a claim ›How we measure confidence ›How we check this ›

Are you an author, or do you see a problem with this page? Request a review

How to cite

Cite CoChat for the checks on this page, and the paper for its own findings.

This page
CoChat. (2026). Citation check: The protozoan commensal Tritrichomonas musculis is a natural adjuvant for mucosal IgA. https://app.cochat.ai/papers/10.1084/jem.20221727
The paper
Cao, E. Y., Burrows, K., Chiaranunt, P., Popovic, A., Zhou, X., Xie, C., Thakur, A., Britton, G., Spindler, M., Ngai, L., Tai, S. L., Dasoveanu, D. C., Nguyen, A., Faith, J. J., Parkinson, J., Gommerman, J. L., & Mortha, A. (2024). The protozoan commensal Tritrichomonas musculis is a natural adjuvant for mucosal IgA. Journal of Experimental Medicine. https://doi.org/10.1084/jem.20221727