

The DOI matches its Crossref record; 177 of the 177 references it cites were found in a registry or an index.
An overview of phase-change memory device physics
Open accessAbstract
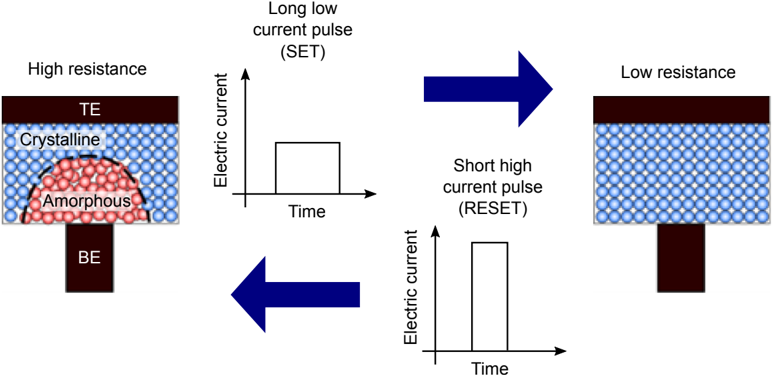
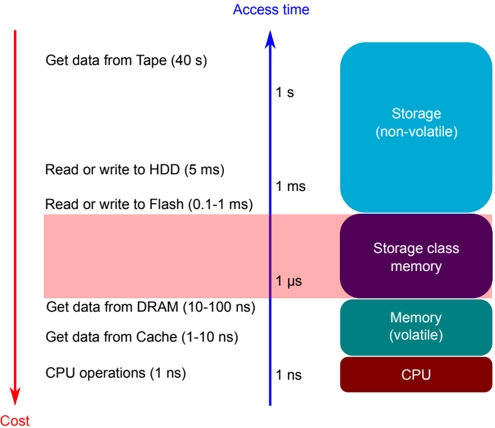
Phase-change memory (PCM) is an emerging non-volatile memory technology that has recently been commercialized as storage-class memory in a computer system. PCM is also being explored for non-von Neumann computing such as in-memory computing and neuromorphic computing. Although the device physics related to the operation of PCM have been widely studied since its discovery in the 1960s, there are still several open questions relating to their electrical, thermal, and structural dynamics. In this article, we provide an overview of the current understanding of the main PCM device physics that underlie the read and write operations. We present both experimental characterization of the various properties investigated in nanoscale PCM devices as well as physics-based modeling efforts. Finally, we provide an outlook on some remaining open questions and possible future research directions.
Overview
The claims and statistics of this paper haven’t been checked yet.
Free: it reads the open-access text and checks the first 5 claims that cite a source we can check. Create a free account to check every claim.
Integrity signals
Registry
Cites
Statistics
Figures






Verification
Claims the paper makes
The claims and statistics of this paper haven’t been checked yet.
Free: it reads the open-access text and checks the first 5 claims that cite a source we can check. Create a free account to check every claim.
Claims other papers make about this one
Each is checked against this paper’s own text: does it say what the citing paper says it does?
The cited source says what the claim attributes to it.
In the citing paper
“In many materials, such as phase-change memory (PCM)22,23, resistive random-access memory (ReRAM)24,25, conductive bridge RAM (CBRAM)26,27, or electro-chemical random-access memory (ECRAM)28,29, these conductances are effectively continuous physical quantities, and stored weights are not quantized.”
From Hardware-aware training for large-scale and diverse deep learning inference workloads using in-memory computing-based accelerators (2023) · cites this paper as [23]
Self-check
Percentages, sums and reported differences re-computed from the paper’s own numbers.
The self-check needs the paper’s full text.
Citations
Cites
Electronic Processes in Non-Crystalline Materials
Mott, N. F., Davis, E. A., & Lösche, A. (1972) · Kristall und Technik Band 7, Heft 4 · doi:10.1515/9783112653326-018 · Cited by 9,295
Temperature dependence of the energy gap in semiconductors
Varshni, Y. P. (1967) · Physica · doi:10.1016/0031-8914(67)90062-6 · Cited by 5,469
Formation of Glasses from Liquids and Biopolymers
Angell, C. A. (1995) · Science · doi:10.1126/science.267.5206.1924 · Cited by 4,799
Supercooled liquids and the glass transition
Debenedetti, P. G., & Stillinger, F. H. (2001) · Nature · doi:10.1038/35065704 · Cited by 4,643
Electronic processes in non-crystalline materials
Jonscher, A. K. (1972) · Thin Solid Films · doi:10.1016/0040-6090(72)90068-5 · Cited by 4,014
Phase-change materials for rewriteable data storage
Wuttig, M., & Yamada, N. (2007) · Nature Materials · doi:10.1038/nmat2009 · Cited by 3,655
Reversible Electrical Switching Phenomena in Disordered Structures
Ovshinsky, S. R. (1968) · Physical Review Letters · doi:10.1103/physrevlett.21.1450 · Cited by 3,144
Relaxation in glassforming liquids and amorphous solids
Angell, C. A., Ngai, K. L., McKenna, G. B., McMillan, P. F., & Martin, S. W. (2000) · Journal of Applied Physics · doi:10.1063/1.1286035 · Cited by 2,238
Valence-Alternation Model for Localized Gap States in Lone-Pair Semiconductors
Kastner, M., Adler, D., & Fritzsche, H. (1976) · Physical Review Letters · doi:10.1103/physrevlett.37.1504 · Cited by 1,318
Integrated all-photonic non-volatile multi-level memory
Ríos, C., Stegmaier, M., Hosseini, P., Wang, D., Scherer, T., Wright, C. D., Bhaskaran, H., & Pernice, W. H. P. (2015) · Nature Photonics · doi:10.1038/nphoton.2015.182 · Cited by 1,312
Research works printed but not linked: 35
- Choi Y, 2012, Int. Solid-State Conf. Digest of Technical Papers (ISSCC), 46
- Chen Y, 2006, Int. Electron Devices Meeting, 1
- Tominaga J, 2010, Int. Electron Devices Meeting, 22
- Kim I S, 2010, Symp. on VLSI Technology, 203
- Liang J, 2011, Symp. on VLSI Technology, 100
- Zheng Q, 2017, J. Phys. D: Appl. Phys., 50
- Athmanathan A, 2015, Int. Conf. on Simulation of Semiconductor Processes and Devices (SISPAD), 289
- Ferreira A P, 2010, Proc. Conf. on Design, Automation and Test Europe, 914
- Wu J, 2018, Proc. Int. Electron Devices Meeting (IEDM), 27
- Zuliani P, 2019, Proc. of Symp. on VLSI Technology, T192
- Disegni F, 2019, Proc. of Symp. on VLSI Circuits, 204
- Burr G W, 2017, Adv Phys., 2, 89
- Castro D T, 2007, IEEE Int. Electron Devices Meeting, 315
- Lee J, 2012, Nanotechnology, 23
- 10.1038/nmat3275 · DOI · Paper page
- Le Roux S, 2007, J. Phys.: Condens. Matter, 19
- Stanisavljevic M, 2016, IEEE 8th Int. Memory Workshop (IMW), 1
- Tsendin K D, 2007, J. Optoelectron Adv. M., 9, 3035
- Le Gallo M, 2016, Proc. Eur. Solid State Device Conf. (ESSDERC), 373
- Longeaud C, 2009, J. Phys.: Condens. Matter, 21
- Le Gallo M, 2015, New J. Phys., 17
- Shih Y H, 2009, IEEE Electron Devices Meeting (IEDM), 1
- Ongaro R, 1991, IEE Proc., 138, 127
- Stanisavljevic M, 2015, Proc. IRPS, 5B.6.1–6
- Sebastian A, 2015, Proc. IRPS, 1
- Gallo M L, 2016, Proc. IEEE Int. Reliability Symp. (IRPS), MY.1.1–6
- Papandreou N, 2011, IEEE Int Electron Devices Meeting, 3
- Cheon J, 2015, Proc. Custom Integrated Conf. (CICC), 1
- Fantini P, 2008, IEEE Int. Electron Devices Meeting (IEDM), 1
- Fugazza D, 2009, IEEE Electron Devices Meeting (IEDM), 1
- Giannopoulos I, 2018, IEEE Int. Electron Devices Meeting (IEDM), 27.7.1–4
- 10.1063/1.3664631 · DOI
- Close G, 2010, Int. Electron Devices Meeting (IEDM), 29
- Pozidis H, 2012, IEEE Int. Memory Workshop, 1
- BrightSky M, 2015, Proc. Int. Electron Devices Meeting (IEDM), 3
Cited by
Embedded Devices for Neuromorphic Time-Series Assessment
Mazumder, A. N., Hosseini, M., & Mohsenin, T. (2022) · Research Explorer (The University of Manchester) · doi:10.13016/m2ksy0-wxr3 · Cited by 652
Accurate deep neural network inference using computational phase-change memory
Joshi, V., Le Gallo, M., Haefeli, S., Boybat, I., Nandakumar, S. R., Piveteau, C., Dazzi, M., Rajendran, B., Sebastian, A., & Eleftheriou, E. (2020) · Nature Communications · doi:10.1038/s41467-020-16108-9 · Cited by 490
Self-citationAccurate deep neural network inference using computational phase-change memory
Joshi, V., Gallo, M. L., Haefeli, S., Boybat, I., Nandakumar, S. R., Piveteau, C., Dazzi, M., Rajendran, B., Sebastian, A., & Eleftheriou, E. S. (2020) · RePEc: Research Papers in Economics · doi:10.3929/ethz-b-000416797 · Cited by 379
Self-citationFrom Ferroelectric Material Optimization to Neuromorphic Devices
Mikolajick, T., Park, M. H., Begon‐Lours, L., & Slesazeck, S. (2023) · Advanced Materials · doi:10.1002/adma.202206042 · Cited by 215
Rasch, M. J., Mackin, C., Le Gallo, M., Chen, A., Fasoli, A., Odermatt, F., Li, N., Nandakumar, S. R., Narayanan, P., Tsai, H., et al. (2023) · Nature Communications · doi:10.1038/s41467-023-40770-4 · Cited by 213
“In many materials, such as phase-change memory (PCM) 22,23 , resistive random-access memory (ReRAM) 24,25 , conductive bridge RAM (CBRAM) 26,27 , or electro-chemical random-access memory (ECRAM) 28,29 , these conductances are effectively continuous physical quantities, and stored weights are not…”
BackgroundSelf-citation
Metadata
- Authors
- Le Gallo, M., & Sebastian, A.
- Affiliations
- IBM Research - Zurich (CH)
- Venue
- Journal of Physics D: Applied Physics
- Publisher
- IOP Publishing
- Published
- 2020-03-30
- Volume
- 53
- Issue
- 21
- Pages
- 213002
- ISSN
- 0022-3727 (ISSN-L)
- 1361-6463
- OpenAlex
- W3007317489
- Cited by
- 460
- References
- 177
- Citations by year
- 2026: 51 · 2025: 92 · 2024: 94 · 2023: 95 · 2022: 69 · 2021: 43 · 2020: 16
- FWCI
- 21.70
- Type
- journal article
- Language
- en
- Open access
- hybrid
- doi.org
- Licence
- cc-by
- iopscience.iop.org/info/page/text-and-data-mining (tdm)
- creativecommons.org/licenses/by/4.0 (vor)
- Locations
- Journal of Physics D Applied Physics (publishedVersion, cc-by)
- Funders
- H2020 European Research Council (682675)
- Topics
- Physical Sciences › Materials Science › Materials Chemistry › Phase-change materials and chalcogenides
- Physical Sciences › Engineering › Electrical and Electronic Engineering › Advanced Memory and Neural Computing
- Physical Sciences › Materials Science › Electronic, Optical and Magnetic Materials › Transition Metal Oxide Nanomaterials
- Keywords
- phase-change memory, device physics, non-volatile memory, storage class memory, in-memory computing, neuromorphic computing, read and write operations, physics-based modeling, thermal dynamics, structural dynamics
About these checks
Registry, retraction, Cites and statistics results are computed, not judged, with one exception: a printed reference that no index lists is read once by a model before it counts as a citation error. Claims are extracted by a model and kept only when their quote appears verbatim in the text; each cited source is then checked, with a model’s help, for whether it says what the claim relies on. Those verdicts can be wrong — read the claim’s quote and the cited source before relying on one.
Statistics and arithmetic are recomputed, not judged.
Confidence bands are shown only for fields calibrated on our annotated test set. None is calibrated yet, so no band is shown.
What counts as a claim ›How we measure confidence ›How we check this ›
Are you an author, or do you see a problem with this page? Request a review
How to cite
Cite CoChat for the checks on this page, and the paper for its own findings.
- This page
- CoChat. (2026). Citation check: An overview of phase-change memory device physics. https://app.cochat.ai/papers/10.1088/1361-6463/ab7794
- The paper
- Le Gallo, M., & Sebastian, A. (2020). An overview of phase-change memory device physics. Journal of Physics D: Applied Physics. https://doi.org/10.1088/1361-6463/ab7794
Data sources
Bibliographic data: Semantic Scholar, OpenAlex, Crossref.
Contains information from the Semantic Scholar Academic Graph Datasets, made available under the ODC Attribution License (ODC-BY 1.0).
Semantic Scholar’s data is described in: Kinney, R., et al. (2023). The Semantic Scholar Open Data Platform. arXiv:2301.10140.
