Cited by 225Nuclear Structure and FunctionNeurogenesis and neuroplasticity mechanismsSkin and Cellular Biology Research

The DOI matches its Crossref record; 41 of the 41 references it cites were found in a registry or an index.

Deficiencies in lamin B1 and lamin B2 cause neurodevelopmental defects and distinct nuclear shape abnormalities in neurons

Open access

Abstract

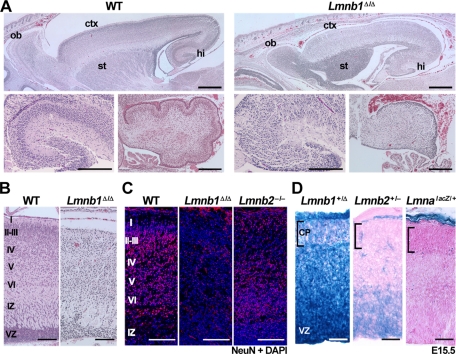
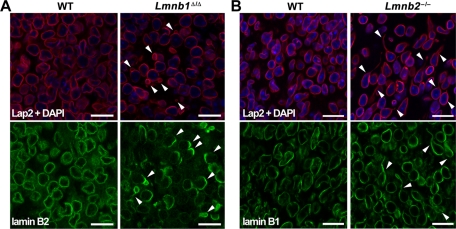
Neuronal migration is essential for the development of the mammalian brain. Here, we document severe defects in neuronal migration and reduced numbers of neurons in lamin B1–deficient mice. Lamin B1 deficiency resulted in striking abnormalities in the nuclear shape of cortical neurons; many neurons contained a solitary nuclear bleb and exhibited an asymmetric distribution of lamin B2. In contrast, lamin B2 deficiency led to increased numbers of neurons with elongated nuclei. We used conditional alleles for Lmnb1 and Lmnb2 to create forebrain-specific knockout mice. The forebrain-specific Lmnb1- and Lmnb2-knockout models had a small forebrain with disorganized layering of neurons and nuclear shape abnormalities, similar to abnormalities identified in the conventional knockout mice. A more severe phenotype, complete atrophy of the cortex, was observed in forebrain-specific Lmnb1/Lmnb2 double-knockout mice. This study demonstrates that both lamin B1 and lamin B2 are essential for brain development, with lamin B1 being required for the integrity of the nuclear lamina, and lamin B2 being important for resistance to nuclear elongation in neurons.

Overview

The claims and statistics of this paper haven’t been checked yet.

Run the check — free, no account needed. It reads the open-access text and checks the sources it cites.

A few free checks a day · papers already verified open instantly · results are public

Integrity signals

Registry

Crossref · 10.1091/mbc.e11-06-0504

Cites

41 of 41 references verified0 citation errors · 0 not checkable

Statistics

Figures

FIGURE 1: Brain abnormalities in newborn Lmnb1Δ/Δ mice. (A) Top, hematoxylin and eosin (H&E) staining of paraffin-embedded sections from newborn wild-type (WT) and Lmnb1Δ/Δ mice. ctx, cortex; hi, hippocampus; ob, olfactory bulb; st, striatum. Scale bar, 500 μm. Bottom, corresponding images at higher magnification of the hippocampus (left), and cerebellum (right); scale bar, 200 μm. (B) H&E–stained sections of the cerebral cortex from newborn WT and Lmnb1Δ/Δ mice. Roman numerals indicate the position of the cortical layers; IZ, intermediate zone; VZ, ventricular zone. (C) Immunostaining of the cerebral cortex of newborn WT, Lmnb1Δ/Δ, and Lmnb2–/– mice with an antibody against the neuronal marker NeuN (red). DNA was stained with DAPI (blue). Layers of the cortical plate are indicated on the left. (D) Lmnb1, Lmnb2, and Lmna expression patterns in the cerebral cortex at E15.5. Frozen sections of brain from Lmnb1+/Δ, Lmnb2+/–, and LmnalacZ/+ embryos were stained for β-galactosidase activity. Sections were counterstained with eosin. Brackets indicate the position of the cortical plate (CP). Scale bars, B and C, 100 μm; D, 50 μm.
FIGURE 1: Brain abnormalities in newborn Lmnb1Δ/Δ mice. (A) Top, hematoxylin and eosin (H&E) staining of paraffin-embedded sections from newborn wild-type (WT) and Lmnb1Δ/Δ mice. ctx, cortex; hi, hippocampus; ob, olfactory bulb; st, striatum. Scale bar, 500 μm. Bottom, corresponding images at higher magnification of the hippocampus (left), and cerebellum (right); scale bar, 200 μm. (B) H&E–stained sections of the cerebral cortex from newborn WT and Lmnb1Δ/Δ mice. Roman numerals indicate the position of the cortical layers; IZ, intermediate zone; VZ, ventricular zone. (C) Immunostaining of the cerebral cortex of newborn WT, Lmnb1Δ/Δ, and Lmnb2–/– mice with an antibody against the neuronal marker NeuN (red). DNA was stained with DAPI (blue). Layers of the cortical plate are indicated on the left. (D) Lmnb1, Lmnb2, and Lmna expression patterns in the cerebral cortex at E15.5. Frozen sections of brain from Lmnb1+/Δ, Lmnb2+/–, and LmnalacZ/+ embryos were stained for β-galactosidase activity. Sections were counterstained with eosin. Brackets indicate the position of the cortical plate (CP). Scale bars, B and C, 100 μm; D, 50 μm.CC BY-NC-SA · PubMed Central
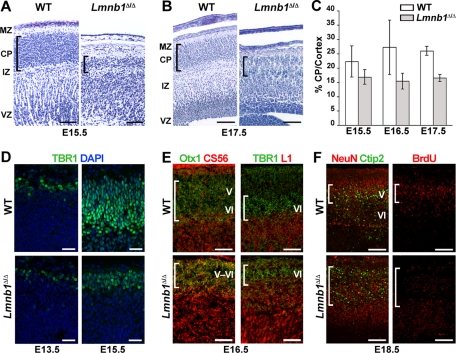
FIGURE 2: Reduced size of the cortical plate and abnormal layering of cortical neurons in Lmnb1Δ/Δ embryos. (A, B) H&E staining on parasagittal sections of wild-type (WT) and Lmnb1Δ/Δ brains at E15.5 (A) and E17.5 (B). IZ, intermediate zone; MZ; marginal zone; VZ, ventricular zone. Brackets indicate the position of the cortical plate (CP). In Lmnb1Δ/Δ mice, the cortical plate was thinner and the density of neurons was reduced. (C) Ratio of cortical plate thickness to cortex thickness in Lmnb1Δ/Δ mice (shaded bars) and WT mice (white bars) at E15.5 (n = 3 WT and 4 Lmnb1Δ/Δ embryos, p = 0.0218), E16.5 (n = 2 per group), and E17.5 (n = 3 per group, p < 0.0001). Measurements were made on matching sections (≥2 sections per embryo). Errors bars indicate SD. (D) Immunostaining for the layer VI marker TBR1 on brain sections from WT and Lmnb1Δ/Δ embryos. TBR1 (green) is expressed normally in Lmnb1Δ/Δ embryos at E13.5, but at E15.5, the layer of TBR1-positive cells was thinner and more superficial than in WT embryos. DNA was stained with DAPI (blue). (E) Reduced size and abnormal positioning of cortical layers V and VI in Lmnb1Δ/Δ embryos. Parasagittal sections of brains from E16.5 WT and Lmnb1Δ/Δ embryos stained with antibodies against the layer V–VI marker Otx1 (green) and the subplate marker CS56 (red) (left) as well as TBR1 (green) and the lateral projection marker L1 (red) (right). Brackets indicate the positions of the cortical plate (left) and layer VI (right). (F) Abnormal positioning of cortical neurons in Lmnb1Δ/Δ embryos. Sections of WT and Lmnb1Δ/Δ embryos collected at E18.5 after an injection of BrdU at E13.5. Left, tissues were stained for the neuronal marker NeuN (red) and the layer V marker Ctip2 (green). Right, tissues were stained with an anti-BrdU antibody (red). Brackets mark the position of the neurons positive for Ctip2. Scale bars, A and B, 100 μm; D, 50 μm; E, F, 200 μm.
FIGURE 2: Reduced size of the cortical plate and abnormal layering of cortical neurons in Lmnb1Δ/Δ embryos. (A, B) H&E staining on parasagittal sections of wild-type (WT) and Lmnb1Δ/Δ brains at E15.5 (A) and E17.5 (B). IZ, intermediate zone; MZ; marginal zone; VZ, ventricular zone. Brackets indicate the position of the cortical plate (CP). In Lmnb1Δ/Δ mice, the cortical plate was thinner and the density of neurons was reduced. (C) Ratio of cortical plate thickness to cortex thickness in Lmnb1Δ/Δ mice (shaded bars) and WT mice (white bars) at E15.5 (n = 3 WT and 4 Lmnb1Δ/Δ embryos, p = 0.0218), E16.5 (n = 2 per group), and E17.5 (n = 3 per group, p < 0.0001). Measurements were made on matching sections (≥2 sections per embryo). Errors bars indicate SD. (D) Immunostaining for the layer VI marker TBR1 on brain sections from WT and Lmnb1Δ/Δ embryos. TBR1 (green) is expressed normally in Lmnb1Δ/Δ embryos at E13.5, but at E15.5, the layer of TBR1-positive cells was thinner and more superficial than in WT embryos. DNA was stained with DAPI (blue). (E) Reduced size and abnormal positioning of cortical layers V and VI in Lmnb1Δ/Δ embryos. Parasagittal sections of brains from E16.5 WT and Lmnb1Δ/Δ embryos stained with antibodies against the layer V–VI marker Otx1 (green) and the subplate marker CS56 (red) (left) as well as TBR1 (green) and the lateral projection marker L1 (red) (right). Brackets indicate the positions of the cortical plate (left) and layer VI (right). (F) Abnormal positioning of cortical neurons in Lmnb1Δ/Δ embryos. Sections of WT and Lmnb1Δ/Δ embryos collected at E18.5 after an injection of BrdU at E13.5. Left, tissues were stained for the neuronal marker NeuN (red) and the layer V marker Ctip2 (green). Right, tissues were stained with an anti-BrdU antibody (red). Brackets mark the position of the neurons positive for Ctip2. Scale bars, A and B, 100 μm; D, 50 μm; E, F, 200 μm.CC BY-NC-SA · PubMed Central
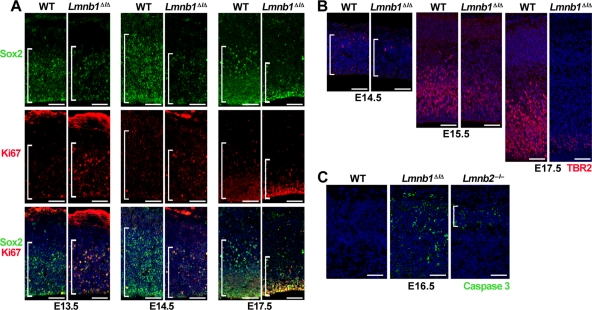
FIGURE 3: Reduced numbers of neuronal progenitors in Lmnb1Δ/Δ brains. (A) Immunostaining for the neuronal progenitor marker Sox2 (top, green) and the mitotic antigen Ki67 (middle, red) at E13.5, E14.5, and E17.5. Bottom, merged images with DAPI (blue). Brackets mark the ventricular zone containing the Sox2+ cells. (B) Immunostaining for TBR2, a marker for intermediate neuronal progenitors, at E14.5, E15.5, and E17.5. Brackets mark the territory occupied by TBR2-positive cells (red). DNA was stained with DAPI (blue). (C) Immunostaining for active caspase 3 (green), a marker of apoptosis, in cerebral cortex of E16.5 WT, Lmnb1Δ/Δ, and Lmnb2–/– embryos. Bracket indicates the position of the cortical plate. Scale bars, A and B, 50 μm; C, 100 μm.
FIGURE 3: Reduced numbers of neuronal progenitors in Lmnb1Δ/Δ brains. (A) Immunostaining for the neuronal progenitor marker Sox2 (top, green) and the mitotic antigen Ki67 (middle, red) at E13.5, E14.5, and E17.5. Bottom, merged images with DAPI (blue). Brackets mark the ventricular zone containing the Sox2+ cells. (B) Immunostaining for TBR2, a marker for intermediate neuronal progenitors, at E14.5, E15.5, and E17.5. Brackets mark the territory occupied by TBR2-positive cells (red). DNA was stained with DAPI (blue). (C) Immunostaining for active caspase 3 (green), a marker of apoptosis, in cerebral cortex of E16.5 WT, Lmnb1Δ/Δ, and Lmnb2–/– embryos. Bracket indicates the position of the cortical plate. Scale bars, A and B, 50 μm; C, 100 μm.CC BY-NC-SA · PubMed Central
FIGURE 4: Lamin B1 and lamin B2 deficiencies yield distinct nuclear abnormalities in cortical neurons from E16.5 embryos. (A) Immunostaining of cortex from WT and Lmnb1Δ/Δ embryos with antibodies against Lap2β (red) or lamin B2 (green). (B) Immunostaining of cortex from WT and Lmnb2–/– embryos with antibodies against Lap2β (red) or lamin B1 (green). Arrowheads indicate nuclei with morphological abnormalities—nuclear blebs and asymmetric distribution of lamin B2 in Lmnb1Δ/Δ neurons (A) and elongated nuclei in Lmnb2–/– neurons (B). DNA was stained with DAPI (blue). Scale bar, 25 μm.
FIGURE 4: Lamin B1 and lamin B2 deficiencies yield distinct nuclear abnormalities in cortical neurons from E16.5 embryos. (A) Immunostaining of cortex from WT and Lmnb1Δ/Δ embryos with antibodies against Lap2β (red) or lamin B2 (green). (B) Immunostaining of cortex from WT and Lmnb2–/– embryos with antibodies against Lap2β (red) or lamin B1 (green). Arrowheads indicate nuclei with morphological abnormalities—nuclear blebs and asymmetric distribution of lamin B2 in Lmnb1Δ/Δ neurons (A) and elongated nuclei in Lmnb2–/– neurons (B). DNA was stained with DAPI (blue). Scale bar, 25 μm.CC BY-NC-SA · PubMed Central
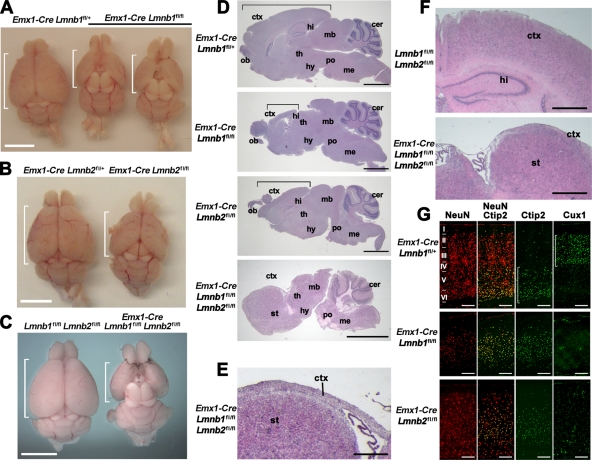
FIGURE 5: Forebrain-specific deletion of Lmnb1 and Lmnb2 results in small forebrains and abnormal layering of cortical neurons in adult mice. (A–C) Reduced size of the forebrain in Emx1-Cre Lmnb1fl/fl (A), Emx1-Cre Lmnb2fl/fl (B), and double-knockout Emx1-Cre Lmnb1fl/fl Lmnb2fl/fl (C) mice compared with control siblings. Brains are oriented with the olfactory lobes on top; the brackets indicate the length of the cerebral cortex. (D) H&E staining of sagittal brain sections from Emx1-Cre Lmnb1fl/fl, Emx1-Cre Lmnb2fl/fl, and Emx1-Cre Lmnb1fl/fl Lmnb2fl/fl mice, along with a control mouse (Emx1-Cre Lmnb1fl/+). Brackets indicate the length of the cortex. (E) Higher-magnification image of the double-knockout Emx1-Cre Lmnb1fl/fl Lmnb2fl/fl brain section to illustrate the reduced thickness of the cortex (ctx). (F) H&E staining of coronal brain sections from a control mouse and an Emx1-Cre Lmnb1fl/fl Lmnb2fl/fl double-knockout mouse. The hippocampus is absent in the double-knockout brain, and cortical tissue is markedly reduced in size, forming just a thin layer of tissue above the striatum. (G) Immunohistochemical staining on cortical sections with the neuronal marker NeuN (red), the layer V–VI marker Ctip2, and the layer II–III marker Cux1 (both green). Roman numerals indicate cortical layers; brackets indicate layers of neurons positive for Ctip2 or Cux1. Scale bars, A–C, 5 mm; D, 2 mm; E, 250 μm; F, 500 μm; G, 200 μm. All samples are from 1-mo-old mice. cer, cerebellum; ctx, cortex; hi, hippocampus; hy, hypothalamus; mb, midbrain; me, medulla; ob, olfactory bulb; po, pons; st, striatum; th, thalamus.
FIGURE 5: Forebrain-specific deletion of Lmnb1 and Lmnb2 results in small forebrains and abnormal layering of cortical neurons in adult mice. (A–C) Reduced size of the forebrain in Emx1-Cre Lmnb1fl/fl (A), Emx1-Cre Lmnb2fl/fl (B), and double-knockout Emx1-Cre Lmnb1fl/fl Lmnb2fl/fl (C) mice compared with control siblings. Brains are oriented with the olfactory lobes on top; the brackets indicate the length of the cerebral cortex. (D) H&E staining of sagittal brain sections from Emx1-Cre Lmnb1fl/fl, Emx1-Cre Lmnb2fl/fl, and Emx1-Cre Lmnb1fl/fl Lmnb2fl/fl mice, along with a control mouse (Emx1-Cre Lmnb1fl/+). Brackets indicate the length of the cortex. (E) Higher-magnification image of the double-knockout Emx1-Cre Lmnb1fl/fl Lmnb2fl/fl brain section to illustrate the reduced thickness of the cortex (ctx). (F) H&E staining of coronal brain sections from a control mouse and an Emx1-Cre Lmnb1fl/fl Lmnb2fl/fl double-knockout mouse. The hippocampus is absent in the double-knockout brain, and cortical tissue is markedly reduced in size, forming just a thin layer of tissue above the striatum. (G) Immunohistochemical staining on cortical sections with the neuronal marker NeuN (red), the layer V–VI marker Ctip2, and the layer II–III marker Cux1 (both green). Roman numerals indicate cortical layers; brackets indicate layers of neurons positive for Ctip2 or Cux1. Scale bars, A–C, 5 mm; D, 2 mm; E, 250 μm; F, 500 μm; G, 200 μm. All samples are from 1-mo-old mice. cer, cerebellum; ctx, cortex; hi, hippocampus; hy, hypothalamus; mb, midbrain; me, medulla; ob, olfactory bulb; po, pons; st, striatum; th, thalamus.CC BY-NC-SA · PubMed Central
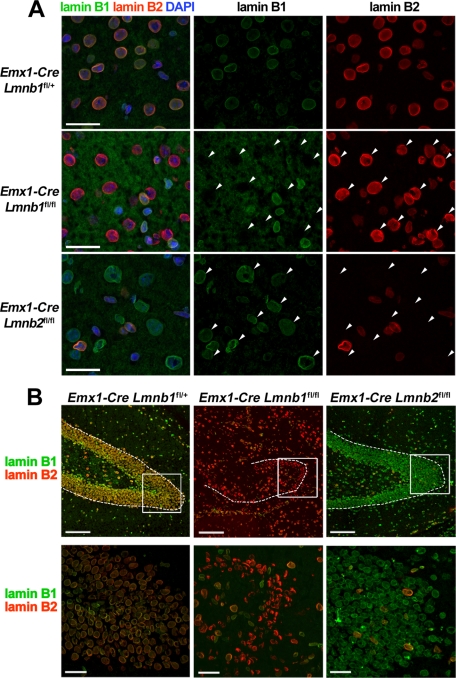
FIGURE 6: Nuclear morphology in the forebrain of adult Emx1-Cre Lmnb1fl/fl and Emx1-Cre Lmnb2fl/fl mice. (A) Immunohistochemical studies of the cortex in 1-mo-old mice with antibodies against lamin B1 (green) and lamin B2 (red); nuclear DNA is stained with DAPI (blue). Arrowheads indicate the position of nuclei of cells that lack one of the two B-type lamins. Scale bars, 50 μm. (B) Immunohistochemical studies of the dentate gyrus of 1-mo-old Emx1-Cre Lmnb1fl/+, Emx1-Cre Lmnb1fl/fl, and Emx1-Cre Lmnb2fl/fl mice with antibodies against lamin B1 (green) and lamin B2 (red). Top, low magnification; dotted lines outline the dentate gyrus; boxed areas indicate the positions of the high-magnification views on the bottom. Scale bars: top, 250 μm; bottom, 50 μm.
FIGURE 6: Nuclear morphology in the forebrain of adult Emx1-Cre Lmnb1fl/fl and Emx1-Cre Lmnb2fl/fl mice. (A) Immunohistochemical studies of the cortex in 1-mo-old mice with antibodies against lamin B1 (green) and lamin B2 (red); nuclear DNA is stained with DAPI (blue). Arrowheads indicate the position of nuclei of cells that lack one of the two B-type lamins. Scale bars, 50 μm. (B) Immunohistochemical studies of the dentate gyrus of 1-mo-old Emx1-Cre Lmnb1fl/+, Emx1-Cre Lmnb1fl/fl, and Emx1-Cre Lmnb2fl/fl mice with antibodies against lamin B1 (green) and lamin B2 (red). Top, low magnification; dotted lines outline the dentate gyrus; boxed areas indicate the positions of the high-magnification views on the bottom. Scale bars: top, 250 μm; bottom, 50 μm.CC BY-NC-SA · PubMed Central

Verification

Claims the paper makes

The claims and statistics of this paper haven’t been checked yet.

Run the check — free, no account needed. It reads the open-access text and checks the sources it cites.

A few free checks a day · papers already verified open instantly · results are public

Claims other papers make about this one

Each is checked against this paper’s own text: does it say what the citing paper says it does?

Self-check

Percentages, sums and reported differences re-computed from the paper’s own numbers.

The self-check needs the paper’s full text.

Citations

Cites

Show all 41 references

Cited by

Sorted by citations

See all 225

Metadata

Authors
Coffinier, C., Jung, H.-J., Nobumori, C., Chang, S., Tu, Y., Barnes, R. H., Yoshinaga, Y., de Jong, P. J., Vergnes, L., Reue, K., Fong, L. G., & Young, S. G.
Affiliations
  • University of California, Los Angeles (US)
  • Children's Hospital Oakland Research Institute, Oakland, CA 94609
Corresponding author
Coffinier, Catherine
Venue
Molecular Biology of the Cell
Published
2011-12
Volume
22
Issue
23
Pages
4683-4693
ISSN
  • 1059-1524 (ISSN-L)
  • 1939-4586
OpenAlex
W1978257498
Cited by
225
References
41
Citations by year
2026: 11 · 2025: 16 · 2024: 9 · 2023: 13 · 2022: 17 · 2021: 23 · 2020: 14 · 2019: 11 · 2018: 12 · 2017: 8 · 2016: 20 · 2015: 12 · 2014: 21 · 2013: 19 · 2012: 14
FWCI
7.54
Type
journal article
Language
en
Open access
Licence
cc-by-nc-sa
Locations
  • Molecular Biology of the Cell (publishedVersion)
  • Europe PMC (PubMed Central) (publishedVersion, cc-by-nc-sa)
  • PubMed Central (publishedVersion, cc-by-nc-sa)
  • PubMed (publishedVersion)
  • eScholarship (California Digital Library) (submittedVersion)
Funders
  • National Science Foundation (0722519)
  • Ellison Medical Foundation
  • March of Dimes Foundation
  • American Heart Association
  • National Institutes of Health
  • University of California, Los Angeles
  • U.S. Public Health Service (CJX1-44385-WS-29646)
  • National Institute on Aging (R01AG035626)
  • National Heart, Lung, and Blood Institute (HL89781, R01HL076839, R01HL086683, HL-86683, HL76839, R01HL089781)
  • National Institute of General Medical Sciences (GM66152, R01GM066152)
  • National Institute of Arthritis and Musculoskeletal and Skin Diseases (R01AR050200, AR 050200)
  • National Center for Research Resources (CHE-0722519)
  • Division of Chemistry (CHE-0722519)
  • California NanoSystems Institute
Topics
  • Life Sciences › Biochemistry, Genetics and Molecular Biology › Molecular Biology › Nuclear Structure and Function
  • Life Sciences › Neuroscience › Developmental Neuroscience › Neurogenesis and neuroplasticity mechanisms
  • Life Sciences › Biochemistry, Genetics and Molecular Biology › Cell Biology › Skin and Cellular Biology Research
Keywords
lamin B1, lamin B2, neuronal migration, brain development, nuclear lamina, cortical neurons, cortical atrophy, forebrain development, conditional knockout mice
MeSH terms
Animals, Brain, Neurons, Prosencephalon, Mice, Knockout, Nuclear Lamina, Lamin Type B, Mice

About these checks

Registry, retraction, Cites and statistics results are computed, not judged, with one exception: a printed reference that no index lists is read once by a model before it counts as a citation error. Claims are extracted by a model and kept only when their quote appears verbatim in the text; each cited source is then checked, with a model’s help, for whether it says what the claim relies on. Those verdicts can be wrong — read the claim’s quote and the cited source before relying on one.

Statistics and arithmetic are recomputed, not judged.

Confidence bands are shown only for fields calibrated on our annotated test set. None is calibrated yet, so no band is shown.

What counts as a claim ›How we measure confidence ›How we check this ›

Are you an author, or do you see a problem with this page? Request a review