

The DOI matches its Crossref record; 65 of the 65 references it cites were found in a registry or an index.
Three-dimensional ultrastructure of the septin filament network in Saccharomyces cerevisiae
Open accessAbstract
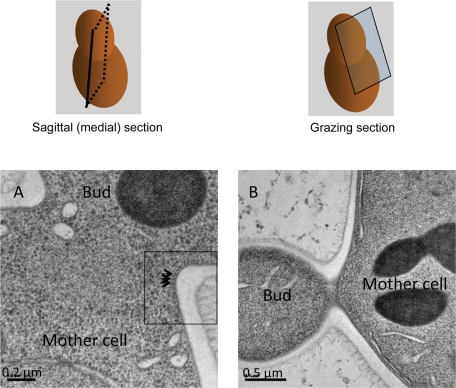
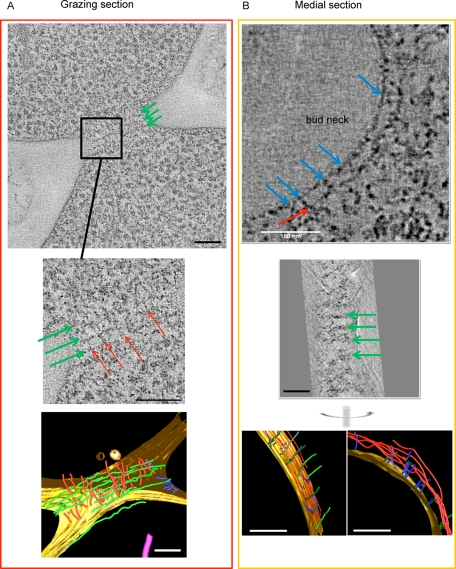
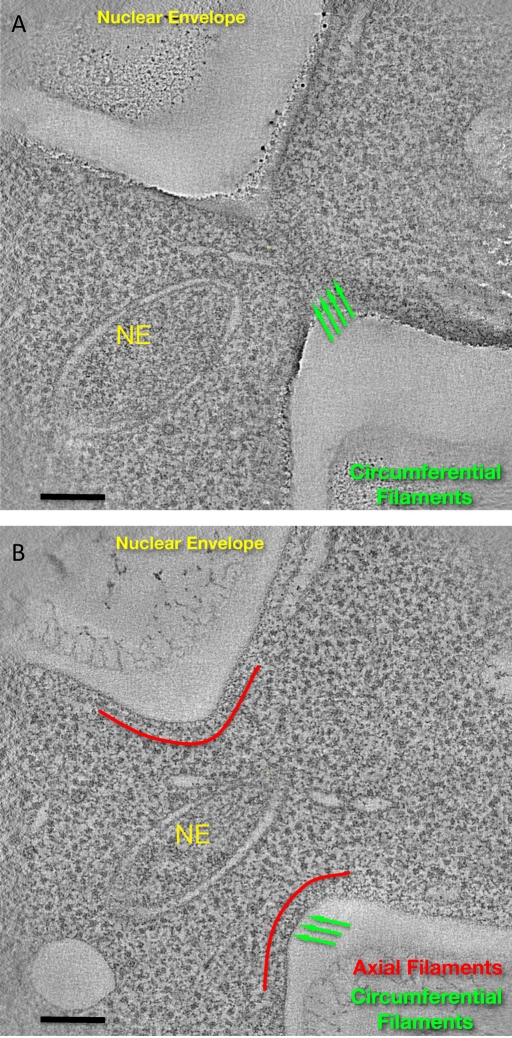
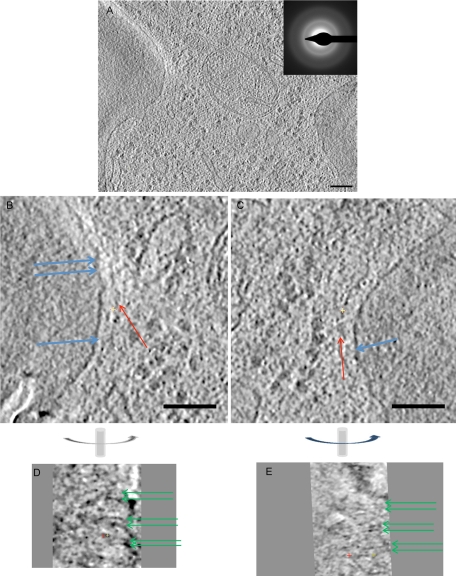
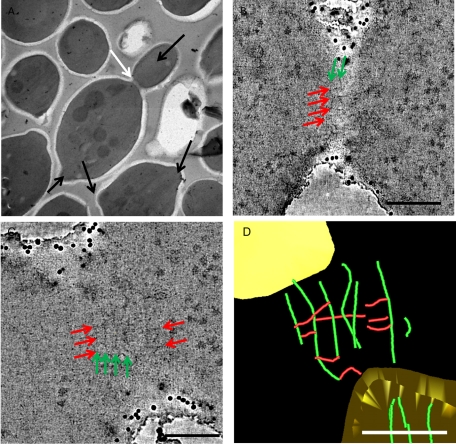
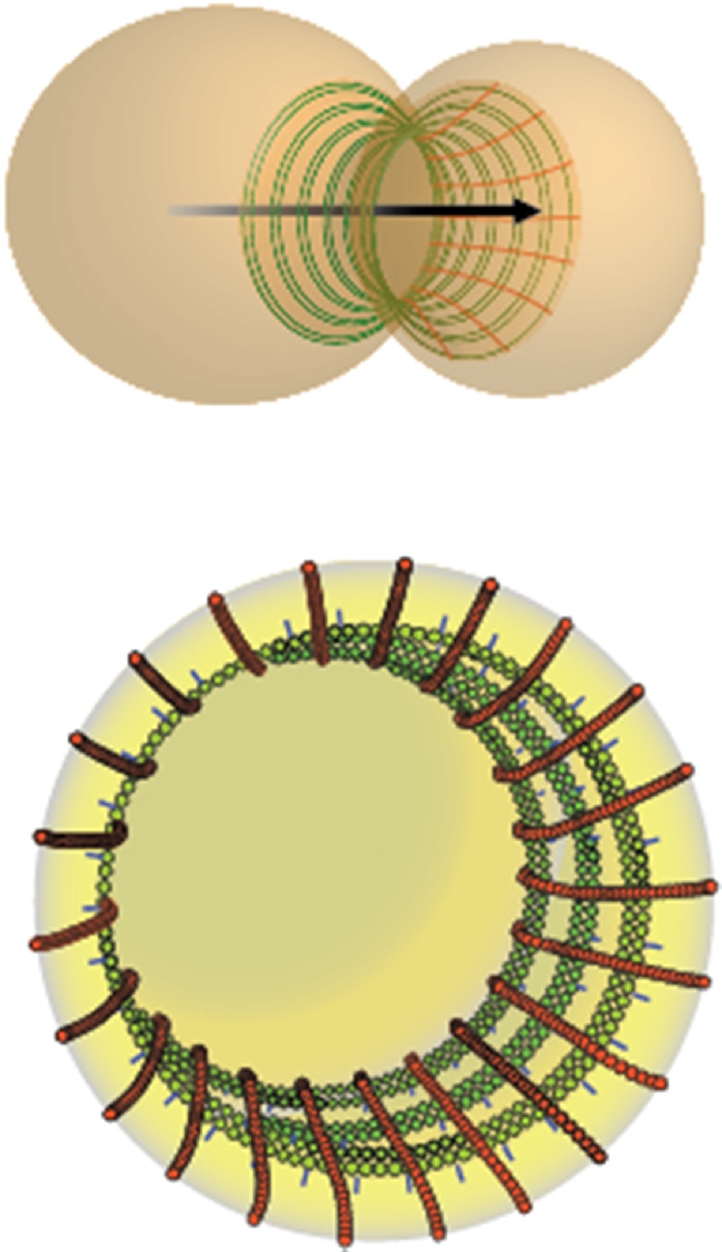
Septins are conserved GTP-binding proteins involved in membrane compartmentalization and remodeling. In budding yeast, five mitotic septins localize at the bud neck, where the plasma membrane is enriched in phosphatidylinositol-4,5-bisphosphate (PtdIns4,5P(2)). We previously established the subunit organization within purified yeast septin complexes and how these hetero-octamers polymerize into filaments in solution and on PtdIns4,5P(2)-containing lipid monolayers. How septin ultrastructure in vitro relates to the septin-containing filaments observed at the neck in fixed cells by thin-section electron microscopy was unclear. A morphological description of these filaments in the crowded space of the cell is challenging, given their small cross section. To examine septin organization in situ, sections of dividing yeast cells were analyzed by electron tomography of freeze-substituted cells, as well as by cryo-electron tomography. We found networks of filaments both perpendicular and parallel to the mother-bud axis that resemble septin arrays on lipid monolayers, displaying a repeat pattern that mirrors the molecular dimensions of the corresponding septin preparations in vitro. Thus these in situ structures most likely represent septin filaments. In viable mutants lacking a single septin, in situ filaments are still present, although more disordered, consistent with other evidence that the in vivo function of septins requires filament formation.
Overview
The claims and statistics of this paper haven’t been checked yet.
Run the check — free, no account needed. It reads the open-access text and checks the sources it cites.
Integrity signals
Registry
Cites
Statistics
Figures
Verification
Claims the paper makes
The claims and statistics of this paper haven’t been checked yet.
Run the check — free, no account needed. It reads the open-access text and checks the sources it cites.
Claims other papers make about this one
Each is checked against this paper’s own text: does it say what the citing paper says it does?
In the citing paper
“Septins form short filaments that self-assemble into parallel arrays which are non-polar in nature [50, 57, 58].”
From Tumor Treating Fields Perturb the Localization of Septins and Cause Aberrant Mitotic Exit (2015) · cites this paper as [57]
In the citing paper
“Since the Septin heterotirmeric subunits align parallel to each other within the ordered Septin structures that form during mitosis [57–59], there must be lateral interactions between the fibers that stabilize their lattice like structure.”
From Tumor Treating Fields Perturb the Localization of Septins and Cause Aberrant Mitotic Exit (2015) · cites this paper as [57]
Self-check
Percentages, sums and reported differences re-computed from the paper’s own numbers.
The self-check needs the paper’s full text.
Citations
Cites
Computer Visualization of Three-Dimensional Image Data Using IMOD
Kremer, J. R., Mastronarde, D. N., & McIntosh, J. R. (1996) · Journal of Structural Biology · doi:10.1006/jsbi.1996.0013 · Cited by 5,530
Genetic Control of the Cell Division Cycle in Yeast
Hartwell, L. H., Culotti, J. G., Pringle, J. R., & Reid, B. J. (1974) · Science · doi:10.1126/science.183.4120.46 · Cited by 1,567
Saccharomyces cerevisiae cell cycle
Hartwell, L. H. (1974) · Bacteriological Reviews · doi:10.1128/br.38.2.164-198.1974 · Cited by 723
HARTWELL, L. (1971) · Experimental Cell Research · doi:10.1016/0014-4827(71)90223-0 · Cited by 650
amira: A Highly Interactive System for Visual Data Analysis
Stalling, D., Westerhoff, M., & Hege, H. (2005) · Elsevier eBooks · doi:10.1016/b978-012387582-2/50040-x · Cited by 570
Structural insight into filament formation by mammalian septins
Sirajuddin, M., Farkasovsky, M., Hauer, F., Kühlmann, D., Macara, I. G., Weyand, M., Stark, H., & Wittinghofer, A. (2007) · Nature · doi:10.1038/nature06052 · Cited by 481
Cryo‐electron microscopy of vitreous sections
Al‐Amoudi, A., Chang, J.-J., Leforestier, A., McDowall, A. W., Michel, L. S., Norlen, L. P. O., Richter, K., Blanc, N. S., Studer, D., & Dubochet, J. (2004) · The EMBO Journal · doi:10.1038/sj.emboj.7600366 · Cited by 458
Takizawa, P. A., DeRisi, J. L., Wilhelm, J. E., & Vale, R. D. (2000) · Science · doi:10.1126/science.290.5490.341 · Cited by 440
Noise Reduction in Electron Tomographic Reconstructions Using Nonlinear Anisotropic Diffusion
Frangakis, A. S., & Hegerl, R. (2001) · Journal of Structural Biology · doi:10.1006/jsbi.2001.4406 · Cited by 425
A highly ordered ring of membrane-associated filaments in budding yeast.
Byers, B., & Goetsch, L. (1976) · The Journal of Cell Biology · doi:10.1083/jcb.69.3.717 · Cited by 420
Research works printed but not linked: 3
- Garcia G, 2011, J Cell Biol
- McMurray MA, 2008, The Septins, 49
- Pringle JR, 2008, The Septins, 7
Cited by
Sorted by citations
Septins: the fourth component of the cytoskeleton
Mostowy, S., & Cossart, P. (2012) · Nature Reviews Molecular Cell Biology · doi:10.1038/nrm3284 · Cited by 865
Tumor Treating Fields Perturb the Localization of Septins and Cause Aberrant Mitotic Exit
Gera, N., Yang, A., Holtzman, T. S., Lee, S. X., Wong, E. T., & Swanson, K. D. (2015) · PLOS ONE · doi:10.1371/journal.pone.0125269 · Cited by 217
Membrane Microdomains, Rafts, and Detergent-Resistant Membranes in Plants and Fungi
Malínský, J., Opekarová, M., Großmann, G., & Tanner, W. (2013) · Annual Review of Plant Biology · doi:10.1146/annurev-arplant-050312-120103 · Cited by 190
How carbohydrates sculpt cells: chemical control of morphogenesis in the yeast cell wall
Cabib, E., & Arroyo, J. (2013) · Nature Reviews Microbiology · doi:10.1038/nrmicro3090 · Cited by 156
Septin Form and Function at the Cell Cortex
Bridges, A. A., & Gladfelter, A. S. (2015) · Journal of Biological Chemistry · doi:10.1074/jbc.r114.634444 · Cited by 152
Daughter Cell Identity Emerges from the Interplay of Cdc42, Septins, and Exocytosis
Okada, S., Leda, M., Hanna, J., Savage, N. S., Bi, E., & Goryachev, A. B. (2013) · Developmental Cell · doi:10.1016/j.devcel.2013.06.015 · Cited by 143
Architecture and dynamic remodelling of the septin cytoskeleton during the cell cycle
Ong, K. L., Wloka, C., Okada, S., Svitkina, T., & Bi, E. (2014) · Nature Communications · doi:10.1038/ncomms6698 · Cited by 137
Jogler, C., Waldmann, J., Huang, X., Jogler, M., Glöckner, F. O., Mascher, T., & Kolter, R. (2012) · Journal of Bacteriology · doi:10.1128/jb.01325-12 · Cited by 122
Cell and Molecular Biology of Septins
Fung, K., Dai, L., & Trimble, W. S. (2014) · International review of cytology · doi:10.1016/b978-0-12-800180-6.00007-4 · Cited by 129
Cell polarization in budding and fission yeasts
Martin, S. G., & Arkowitz, R. A. (2013) · FEMS Microbiology Reviews · doi:10.1111/1574-6976.12055 · Cited by 123
Membrane reshaping by micrometric curvature sensitive septin filaments
Beber, A., Taveneau, C., Nania, M., Tsai, F., Cicco, A. D., Bassereau, P. M., Lévy, D., Cabral, J. T., Isambert, H., Mangenot, S., et al. (2019) · Nature Communications · doi:10.1038/s41467-019-08344-5 · Cited by 119
Self-citationCryo-electron tomography reveals novel features of a viral RNA replication compartment
Ertel, K. J., Benefield, D. A., Castaño‐Díez, D., Pennington, J. G., Horswill, M. A., den Boon, J. A., Otegui, M. S., & Ahlquist, P. (2017) · eLife · doi:10.7554/elife.25940 · Cited by 113
Posttranslational modifications and assembly of septin heteropolymers and higher-order structures
Hernández-Rodríguez, Y., & Momany, M. (2012) · Current Opinion in Microbiology · doi:10.1016/j.mib.2012.09.007 · Cited by 98
Mechanisms of cytokinesis in budding yeast
Wloka, C., & Bi, E. (2012) · Cytoskeleton · doi:10.1002/cm.21046 · Cited by 84
Architecture, remodeling, and functions of the septin cytoskeleton
Marquardt, J. R., Chen, X., & Bi, E. (2018) · Cytoskeleton · doi:10.1002/cm.21475 · Cited by 80
Role of asymmetric cell division in lifespan control in Saccharomyces cerevisiae
Higuchi‐Sanabria, R., Pernice, W. M., Vevea, J., Wolken, D. M. A., Boldogh, I. R., & Pon, L. A. (2014) · FEMS Yeast Research · doi:10.1111/1567-1364.12216 · Cited by 82
Membrane binding controls ordered self-assembly of animal septins
Szuba, A., Bano, F., Castro-Linares, G., Iv, F., Mavrakis, M., Richter, R. P., Bertin, A., & Koenderink, G. H. (2021) · eLife · doi:10.7554/elife.63349 · Cited by 71
Self-citationHuman septins organize as octamer-based filaments and mediate actin-membrane anchoring in cells
Martins, C. S., Taveneau, C., Castro-Linares, G., Baibakov, M., Buzhinsky, N., Eroles, M., Milanović, V., Omi, S., Pédelacq, J. D., Iv, F., et al. (2022) · The Journal of Cell Biology · doi:10.1083/jcb.202203016 · Cited by 56
Alonso, A., Greenlee, M., Matts, J. A. B., Kline, J. T., Davis, K. J., & Miller, R. K. (2015) · Cytoskeleton · doi:10.1002/cm.21226 · Cited by 68
Plasma Membrane MCC/Eisosome Domains Promote Stress Resistance in Fungi
Lanze, C. E., Gandra, R. M., Foderaro, J. E., Swenson, K. A., Douglas, L. M., & Konopka, J. B. (2020) · Microbiology and Molecular Biology Reviews · doi:10.1128/mmbr.00063-19 · Cited by 59
Finnigan, G. C., Booth, E. A., Duvalyan, A., Liao, E. N., & Thorner, J. W. (2015) · Genetics · doi:10.1534/genetics.115.176503 · Cited by 55
Self-citationMechanics and regulation of cytokinesis in budding yeast
Bhavsar-Jog, Y. P., & Bi, E. (2016) · Seminars in Cell and Developmental Biology · doi:10.1016/j.semcdb.2016.12.010 · Cited by 57
Analysis of Septin Reorganization at Cytokinesis Using Polarized Fluorescence Microscopy
McQuilken, M., Jentzsch, M. S., Verma, A., Mehta, S. B., Oldenbourg, R., & Gladfelter, A. S. (2017) · Frontiers in Cell and Developmental Biology · doi:10.3389/fcell.2017.00042 · Cited by 49
Finnigan, G. C., Takagi, J., Cho, C., & Thorner, J. W. (2015) · Genetics · doi:10.1534/genetics.115.176495 · Cited by 48
Self-citationSchneider, C., Grois, J., Renz, C., Gronemeyer, T., & Johnsson, N. (2013) · Journal of Cell Science · doi:10.1242/jcs.125302 · Cited by 45
Actomyosin ring driven cytokinesis in budding yeast
Meitinger, F., & Palani, S. (2016) · Seminars in Cell and Developmental Biology · doi:10.1016/j.semcdb.2016.01.043 · Cited by 45
Finnigan, G. C., Duvalyan, A., Liao, E. N., Sargsyan, A., & Thorner, J. W. (2016) · Molecular Biology of the Cell · doi:10.1091/mbc.e16-05-0337 · Cited by 46
Self-citationInsights into animal septins using recombinant human septin octamers with distinct SEPT9 isoforms
Iv, F., Martins, C. S., Castro-Linares, G., Taveneau, C., Barbier, P., Verdier‐Pinard, P., Camoin, L., Audebert, S., Tsai, F., Ramond, L., et al. (2021) · Journal of Cell Science · doi:10.1242/jcs.258484 · Cited by 41
Self-citationSeptin-microtubule association via a motif unique to isoform 1 of septin 9 tunes stress fibers
Kuzmić, M., Castro-Linares, G., Fialová, J. L., Iv, F., Salaün, D., Llewellyn, A., Gomes, M., Belhabib, M., Liu, Y., Asano, K., et al. (2021) · Journal of Cell Science · doi:10.1242/jcs.258850 · Cited by 40
Booth, E. A., Vane, E. W., Dovala, D., & Thorner, J. W. (2015) · Journal of Biological Chemistry · doi:10.1074/jbc.m115.683128 · Cited by 37
Self-citationChoudhry, S. K., de Boer, R., & van der Klei, I. J. (2018) · Journal of Cell Science · doi:10.1242/jcs.207522 · Cited by 36
Septins and Generation of Asymmetries in Fungal Cells
Khan, A., McQuilken, M., & Gladfelter, A. S. (2015) · Annual Review of Microbiology · doi:10.1146/annurev-micro-091014-104250 · Cited by 36
Off-Target Effects of the Septin Drug Forchlorfenuron on Nonplant Eukaryotes
Heasley, L. R., García, G., & McMurray, M. A. (2014) · Eukaryotic Cell · doi:10.1128/ec.00191-14 · Cited by 35
Self-citationLi, L., Zhang, C., & Konopka, J. B. (2012) · Eukaryotic Cell · doi:10.1128/ec.00216-12 · Cited by 35
Crystal structure of Cdc11, a septin subunit from Saccharomyces cerevisiae
Brausemann, A., Gerhardt, S., Schott, A.-K., Einsle, O., Große-Berkenbusch, A., Johnsson, N., & Gronemeyer, T. (2016) · Journal of Structural Biology · doi:10.1016/j.jsb.2016.01.004 · Cited by 30
Kaplan, C., Jing, B., Winterflood, C. M., Bridges, A. A., Occhipinti, P., Schmied, J. J., Grinhagens, S., Gronemeyer, T., Tinnefeld, P., Gladfelter, A. S., et al. (2015) · Nano Letters · doi:10.1021/acs.nanolett.5b00693 · Cited by 31
Septins regulate junctional integrity of endothelial monolayers
Kim, J., & Cooper, J. A. (2018) · Molecular Biology of the Cell · doi:10.1091/mbc.e18-02-0136 · Cited by 31
New Insight Into the Roles of Membrane Microdomains in Physiological Activities of Fungal Cells
Malínský, J., & Opekarová, M. (2016) · International review of cytology · doi:10.1016/bs.ircmb.2016.02.005 · Cited by 30
Nanoscale details of mitochondrial constriction revealed by cryoelectron tomography
Mageswaran, S. K., Grotjahn, D. A., Zeng, X., Barad, B. A., Medina, M., Hoang, M. H., Dobro, M. J., Chang, Y., Xu, M., Yang, W. Y., et al. (2023) · Biophysical Journal · doi:10.1016/j.bpj.2023.07.030 · Cited by 36
A septin-Hof1 scaffold at the yeast bud neck binds and organizes actin cables
Garabedian, M. V., Wirshing, A. C. E., Vakhrusheva, A., Turegun, B., Sokolova, O. S., & Goode, B. L. (2020) · Molecular Biology of the Cell · doi:10.1091/mbc.e19-12-0693 · Cited by 29
Abbey, M., Hakim, C., Anand, R., Lafera, J., Schambach, A., Kispert, A., Taft, M. H., Kaever, V., Kotlyarov, A., Gaestel, M., et al. (2016) · Scientific Reports · doi:10.1038/srep20007 · Cited by 34
Fungal pathogens are platforms for discovering novel and conserved septin properties
Bridges, A. A., & Gladfelter, A. S. (2014) · Current Opinion in Microbiology · doi:10.1016/j.mib.2014.04.004 · Cited by 29
Septin-Associated Protein Kinases in the Yeast Saccharomyces cerevisiae
Perez, A. M., Finnigan, G. C., Roelants, F. M., & Thorner, J. W. (2016) · Frontiers in Cell and Developmental Biology · doi:10.3389/fcell.2016.00119 · Cited by 29
Self-citationSeptin Assembly and Remodeling at the Cell Division Site During the Cell Cycle
Marquardt, J. R., Chen, X. X., & Bi, E. (2021) · Frontiers in Cell and Developmental Biology · doi:10.3389/fcell.2021.793920 · Cited by 27
Frankl, A., Mari, M. C., & Reggiori, F. (2015) · Microbial Cell · doi:10.15698/mic2015.11.237 · Cited by 27
Septins, a cytoskeletal protein family, with emerging role in striated muscle
Gönczi, M., Dienes, B., Dobrosi, N., Fodor, J., Balogh, N., Oláh, T., & Csernoch, L. J. (2020) · Journal of Muscle Research and Cell Motility · doi:10.1007/s10974-020-09573-8 · Cited by 23
Heasley, L. R., & McMurray, M. A. (2015) · Molecular Biology of the Cell · doi:10.1091/mbc.e15-10-0721 · Cited by 26
Self-citationFinnigan, G. C., Sterling, S. M., Duvalyan, A., Liao, E. N., Sargsyan, A., García, G., Nogales, E., & Thorner, J. W. (2016) · Molecular Biology of the Cell · doi:10.1091/mbc.e16-03-0177 · Cited by 22
Self-citationWong, E. T., Lok, E., & Swanson, K. D. (2018) · Progress in neurological surgery · doi:10.1159/000469690 · Cited by 22
Nakazawa, K., Kumar, G., Chauvin, B., Cicco, A. D., Pellegrino, L., Trichet, M., Hajj, B., Cabral, J. T., Sain, A., Mangenot, S., et al. (2023) · Journal of Cell Science · doi:10.1242/jcs.260813 · Cited by 20
Self-citationKim, J., & Cooper, J. A. (2020) · Arteriosclerosis Thrombosis and Vascular Biology · doi:10.1161/atvbaha.120.315472 · Cited by 20
Synergistic role of nucleotides and lipids for the self-assembly of Shs1 septin oligomers
Taveneau, C., Blanc, R., Pehau‐Arnaudet, G., Cicco, A. D., & Bertin, A. (2020) · Biochemical Journal · doi:10.1042/bcj20200199 · Cited by 18
Self-citationWang, Z., Lv, Z., Li, C., Shao, Y., Zhang, W., & Zhao, X. (2018) · International Journal of Biological Macromolecules · doi:10.1016/j.ijbiomac.2018.03.033 · Cited by 18
Damalio, J. C. P., Nobre, T. M., Lopes, J. L. D. S., Oliveira, O. N., & de Araújo, A. P. U. (2013) · Biochimica et Biophysica Acta (BBA) - Biomembranes · doi:10.1016/j.bbamem.2013.02.003 · Cited by 16
Kaltdorf, K. V., Schulze, K., Helmprobst, F., Kollmannsberger, P., Dandekar, T., & Stigloher, C. (2017) · PLoS Computational Biology · doi:10.1371/journal.pcbi.1005317 · Cited by 15
Al-Ali, H., Baig, A., Alkhanjari, R. R., Murtaza, Z. F., Alhajeri, M. M., Elbahrawi, R. T., Abdukadir, A. M., Bhamidimarri, P. M., Kashir, J., & Hamdan, H. (2024) · Cell Communication and Signaling · doi:10.1186/s12964-024-01889-z · Cited by 14
Nakamura, T. S., Numajiri, Y., Okumura, Y., Hidaka, J., Tanaka, T., Inoue, I., Suda, Y., Takahashi, T., Nakanishi, H., Gao, X., et al. (2017) · Molecular Biology of the Cell · doi:10.1091/mbc.e17-08-0521 · Cited by 14
Effects of Bni5 Binding on Septin Filament Organization
Booth, E. A., Sterling, S. M., Dovala, D., Nogales, E., & Thorner, J. W. (2016) · Journal of Molecular Biology · doi:10.1016/j.jmb.2016.10.024 · Cited by 14
Self-citationPerez, A. M., & Thorner, J. W. (2018) · Cytoskeleton · doi:10.1002/cm.21500 · Cited by 15
Self-citationSeptin filament organization in Saccharomyces cerevisiae
Bertin, A., & Nogales, E. (2012) · Communicative & Integrative Biology · doi:10.4161/cib.21125 · Cited by 13
Self-citationReciprocal regulation by Elm1 and Gin4 controls septin hourglass assembly and remodeling
Marquardt, J. R., Chen, X., & Bi, E. (2024) · The Journal of Cell Biology · doi:10.1083/jcb.202308143 · Cited by 11
Computational model of polarized actin cables and cytokinetic actin ring formation in budding yeast
Tang, H., Bidone, T. C., & Vavylonis, D. (2015) · Cytoskeleton · doi:10.1002/cm.21258 · Cited by 11
Visualization of in vivo septin ultrastructures by platinum replica electron microscopy
Ong, K. L., Svitkina, T., & Bi, E. (2016) · Methods in cell biology · doi:10.1016/bs.mcb.2016.03.011 · Cited by 10
The Syp1/FCHo2 protein induces septin filament bundling through its intrinsically disordered domain
Ibanes, S., Alaoui, F. E., Lai‐Kee‐Him, J., Cazevieille, C., Hoh, F., Lyonnais, S., Bron, P., Cipelletti, L., Picas, L., & Piatti, S. (2022) · Cell Reports · doi:10.1016/j.celrep.2022.111765 · Cited by 9
Garno, C., Irons, Z. H., Gamache, C. M., McKim, Q. W., Reyes, G., Wu, X., Shuster, C. B., & Henson, J. H. (2021) · PLoS ONE · doi:10.1371/journal.pone.0252845 · Cited by 10
A FRET-based method for monitoring septin polymerization and binding of septin-associated proteins
Booth, E. A., & Thorner, J. W. (2016) · Methods in cell biology · doi:10.1016/bs.mcb.2016.03.024 · Cited by 10
Self-citationCentral Role of the Actomyosin Ring in Coordinating Cytokinesis Steps in Budding Yeast
Foltman, M., & Sánchez‐Díaz, A. (2024) · Journal of Fungi · doi:10.3390/jof10090662 · Cited by 10
Septins modulate the autophagy response after nutrient starvation
Perucho-Jaimes, L., Do, J., Elgort, A. V., & Kaplan, K. B. (2023) · Molecular Biology of the Cell · doi:10.1091/mbc.e22-11-0520 · Cited by 8
Vargas-Muñiz, J. M., Juvvadi, P. R., & Steinbach, W. J. (2016) · Microbiology · doi:10.1099/mic.0.000359 · Cited by 10
Septin higher-order structure on yeast membranes in vitro
Goodchild, J. A., Curtis, B. N., Pan, Y., Jiang, Y., Jiao, F., Gladfelter, A. S., & Scheuring, S. (2025) · Nature Communications · doi:10.1038/s41467-025-60344-w · Cited by 8
The Cytoskeleton and Polarity Markers During Polarized Growth of Filamentous Fungi
Takeshita, N., & Fischer, R. (2019) · Springer eBooks · doi:10.1007/978-3-030-05448-9_3 · Cited by 8
Phosphorylation of the F-BAR protein Hof1 drives septin ring splitting in budding yeast
Salgado, M. V., Adriaans, I. E., Touati, S. A., Ibanes, S., Lai‐Kee‐Him, J., Ancelin, A., Cipelletti, L., Picas, L., & Piatti, S. (2024) · Nature Communications · doi:10.1038/s41467-024-47709-3 · Cited by 7
Septin architecture and function in budding yeast
Farkašovský, M. (2020) · Biological Chemistry · doi:10.1515/hsz-2019-0401 · Cited by 8
Wolken, D. M. A., McInnes, J., & Pon, L. A. (2014) · Molecular Biology of the Cell · doi:10.1091/mbc.e13-06-0317 · Cited by 7
Characterization of Septin Ultrastructure in Budding Yeast Using Electron Tomography
Bertin, A., & Nogales, E. (2015) · Methods in molecular biology · doi:10.1007/978-1-4939-3145-3_9 · Cited by 7
Self-citationOrellana‐Muñoz, S., Dueñas‐Santero, E., Arnáiz‐Pita, Y., del Rey, F., Correa‐Bordes, J., & de Aldana, C. R. V. (2018) · Scientific Reports · doi:10.1038/s41598-018-20249-9 · Cited by 7
Nanoscale details of mitochondrial fission revealed by cryo-electron tomographyPreprint
Mageswaran, S. K., Grotjahn, D. A., Zeng, X., Barad, B. A., Medina, M., Hoang, M. H., Dobro, M. J., Chang, Y., Xu, M., Yang, W., et al. (2021) · bioRxiv (Cold Spring Harbor Laboratory) · doi:10.1101/2021.12.13.472487 · Cited by 7
de Val, N., McMurray, M. A., Lam, L. H., Hsiung, C. C. ‐., Bertin, A., Nogales, E., & Thorner, J. W. (2013) · Proteins Structure Function and Bioinformatics · doi:10.1002/prot.24345 · Cited by 6
Self-citationThe Long and Viscous Road: Uncovering Nuclear Diffusion Barriers in Closed Mitosis
Zavala, E., & Marquez‐Lago, T. T. (2014) · PLoS Computational Biology · doi:10.1371/journal.pcbi.1003725 · Cited by 6
Rippert, D., & Heinisch, J. J. (2016) · Fungal Genetics and Biology · doi:10.1016/j.fgb.2016.07.007 · Cited by 6
COPI-dependent intra-Golgi recycling at an intermediate stage of cisternal maturation
Krahn, A. H., Pantazopoulou, A., Austin, J. R., Johnson, N., Lee-Smith, C. F., & Glick, B. S. (2026) · The Journal of Cell Biology · doi:10.1083/jcb.202509174 · Cited by 5
Reconstituted in vitro systems to reveal the roles and functions of septins
Nakazawa, K., Chauvin, B., Mangenot, S., & Bertin, A. (2023) · Journal of Cell Science · doi:10.1242/jcs.259448 · Cited by 5
Self-citationCytokinesis: An Anillin–RhoGEF Module Sets the Stage for Septin Double Ring Assembly
Piatti, S. (2020) · Current Biology · doi:10.1016/j.cub.2020.02.035 · Cited by 6
Septin Organization and Dynamics for Budding Yeast Cytokinesis
Salgado, M. V., & Piatti, S. (2024) · Journal of Fungi · doi:10.3390/jof10090642 · Cited by 5
Reconstructed evolutionary history of the yeast septins Cdc11 and Shs1
Takagi, J., Cho, C., Duvalyan, A., Yan, Y., Halloran, M., Hanson-Smith, V., Thorner, J. W., & Finnigan, G. C. (2020) · G3 Genes Genomes Genetics · doi:10.1093/g3journal/jkaa006 · Cited by 3
Self-citationSeptin architecture dictates size-dependent diffusion barriers on biomimetic membranes
Chauvin, B., Nakazawa, K., Adriaans, I. E., Geymonat, M., Piatti, S., Hajj, B., Mangenot, S., & Bertin, A. (2026) · Communications Biology · doi:10.1038/s42003-026-10811-x · Cited by 2
Self-citationBni5 regulates and coordinates septin architecture and myosin-II functions at the cell division site
Okada, H., Chen, X., Marquardt, J. R., Wang, K., & Bi, E. (2025) · The Journal of Cell Biology · doi:10.1083/jcb.202311040 · Cited by 7
Characterization of Bud3 domains sufficient for bud neck targeting in S. cerevisiae
Schrock, M. N., Yan, Y., Goeckel, M. E., Basgall, E. M., Lewis, I. C., Leonard, K. G., Halloran, M., & Finnigan, G. C. (2022) · Access Microbiology · doi:10.1099/acmi.0.000341 · Cited by 2
Cytoskeleton: Septins Do the Horizontal Tango
Pham, T., DiCiccio, J. E., & Trimble, W. S. (2014) · Current Biology · doi:10.1016/j.cub.2014.02.047 · Cited by 2
Kaplan, C., Yu, C., & Ewers, H. (2016) · Methods in cell biology · doi:10.1016/bs.mcb.2016.04.007 · Cited by 2
Application of Nanotechnologies in Studying Yeast Structure in Candida
Savin, N. A., Колмогоров, В., Timoshenko, R. V., Klyachko, N. L., Parkhomenko, Y. N., Salikhov, S. V., Majouga, A. G., Erofeev, A. S., & Gorelkin, P. V. (2021) · Nanobiotechnology Reports · doi:10.1134/s263516762104011x · Cited by 2
Meeting report – the ever-fascinating world of septins
Baillet, A., McMurray, M. A., & Oakes, P. W. (2021) · Journal of Cell Science · doi:10.1242/jcs.259552 · Cited by 2
Self-citationKuzmić, M., Castro-Linares, G., Fialová, J. L., Iv, F., Salaün, D., Llewellyn, A., Gomes, M., Belhabib, M., Liu, Y., Asano, K., et al. (2021) · bioRxiv (Cold Spring Harbor Laboratory) · doi:10.1101/2021.04.06.438596 · Cited by 4
Aip1p Dynamics Are Altered by the R256H Mutation in Actin
Pierick, A. R., McKane, M., Wen, K., & Bartlett, H. L. (2014) · Journal of Visualized Experiments · doi:10.3791/51551 · Cited by 1
Elucidating the Synergistic Role of Elm1 and Gin4 Kinases in Regulating Septin Hourglass AssemblyPreprint
Marquardt, J. R., Chen, X., & Bi, E. (2023) · bioRxiv (Cold Spring Harbor Laboratory) · doi:10.1101/2023.11.08.566235 · Cited by 1
Chauvin, B., Costa, L., Lenz, M., Hajj, B., Milhiet, P., Mangenot, S., & Bertin, A. (2026) · bioRxiv (Cold Spring Harbor Laboratory) · doi:10.64898/2026.04.27.721050 · Cited by 1
Self-citationCell Division | Septins and Cytokinesis
Perry, J. A., & Maddox, A. S. (2021) · Elsevier eBooks · doi:10.1016/b978-0-12-819460-7.00317-0
Bhojappa, B., Dhar, A., Bagyashree, V. T., Kumari, J., Cardozo, F., Rizvi, V. A., Guturu, D., & Palani, S. (2026) · eLife · doi:10.7554/elife.106366.3
Bhojappa, B., Dhar, A., Bagyashree, V. T., Kumari, J., Cardozo, F., Rizvi, V. A., & Palani, S. (2025) · eLife · doi:10.7554/elife.106366.1
Bhojappa, B., Dhar, A., Bagyashree, V. T., Kumari, J., Cardozo, F., Rizvi, V. A., Guturu, D., & Palani, S. (2025) · eLife · doi:10.7554/elife.106366
Metadata
- Authors
- Bertin, A., McMurray, M. A., Pierson, J., Thai, L., McDonald, K. L., Zehr, E. A., García, G., Peters, P., Thorner, J., & Nogales, E.
- Affiliations
- University of California, Berkeley (US)
- The Netherlands Cancer Institute (NL)
- Howard Hughes Medical Institute (US)
- Corresponding author
- Nogales, Eva
- ORCID
- Venue
- Molecular Biology of the Cell
- Published
- 2012-02
- Volume
- 23
- Issue
- 3
- Pages
- 423-432
- ISSN
- 1059-1524 (ISSN-L)
- 1939-4586
- PMC
- PMC3268722
- OpenAlex
- W2013196716
- Cited by
- 106
- References
- 64
- Citations by year
- 2026: 5 · 2025: 5 · 2024: 5 · 2023: 5 · 2022: 5 · 2021: 10 · 2020: 8 · 2019: 3 · 2018: 8 · 2017: 4 · 2016: 14 · 2015: 12 · 2014: 9 · 2013: 7 · 2012: 6
- FWCI
- 2.85
- Type
- journal article
- Language
- en
- Open access
- green
- www.ncbi.nlm.nih.gov
- Licence
- cc-by-nc-sa
- Locations
- Molecular Biology of the Cell (publishedVersion)
- Europe PMC (PubMed Central) (publishedVersion, cc-by-nc-sa)
- PubMed Central (publishedVersion, cc-by-nc-sa)
- PubMed (publishedVersion)
- OSTI OAI (U.S. Department of Energy Office of Scientific and Technical Information) (submittedVersion)
- Funders
- Howard Hughes Medical Institute
- National Institute of General Medical Sciences (R00GM086603, K99 GM86603, R01GM21841, R01GM101314, K99GM086603, R01GM021841)
- Topics
- Life Sciences › Biochemistry, Genetics and Molecular Biology › Molecular Biology › Fungal and yeast genetics research
- Life Sciences › Biochemistry, Genetics and Molecular Biology › Cell Biology › Microtubule and mitosis dynamics
- Life Sciences › Biochemistry, Genetics and Molecular Biology › Cell Biology › Cellular transport and secretion
- Keywords
- septins, Saccharomyces cerevisiae, bud neck, membrane compartmentalization, electron tomography, cryo-electron tomography, thin section electron microscopy, filament polymerization
- MeSH terms
- Cytoskeleton, Mutation, Saccharomyces cerevisiae, Imaging, Three-Dimensional, Saccharomyces cerevisiae Proteins, Septins
About these checks
Registry, retraction, Cites and statistics results are computed, not judged, with one exception: a printed reference that no index lists is read once by a model before it counts as a citation error. Claims are extracted by a model and kept only when their quote appears verbatim in the text; each cited source is then checked, with a model’s help, for whether it says what the claim relies on. Those verdicts can be wrong — read the claim’s quote and the cited source before relying on one.
Statistics and arithmetic are recomputed, not judged.
Confidence bands are shown only for fields calibrated on our annotated test set. None is calibrated yet, so no band is shown.
What counts as a claim ›How we measure confidence ›How we check this ›
Are you an author, or do you see a problem with this page? Request a review
