Cited by 209Mitochondrial Function and PathologyAutophagy in Disease and TherapyCell death mechanisms and regulation

The DOI matches its Crossref record; 61 of the 61 references it cites were found in a registry or an index.

Mutations in Fis1 disrupt orderly disposal of defective mitochondria

Open access

Abstract

Mitochondrial fission is mediated by the dynamin-related protein Drp1 in metazoans. Drp1 is recruited from the cytosol to mitochondria by the mitochondrial outer membrane protein Mff. A second mitochondrial outer membrane protein, named Fis1, was previously proposed as recruitment factor, but Fis1(-/-) cells have mild or no mitochondrial fission defects. Here we show that Fis1 is nevertheless part of the mitochondrial fission complex in metazoan cells. During the fission cycle, Drp1 first binds to Mff on the surface of mitochondria, followed by entry into a complex that includes Fis1 and endoplasmic reticulum (ER) proteins at the ER-mitochondrial interface. Mutations in Fis1 do not normally affect fission, but they can disrupt downstream degradation events when specific mitochondrial toxins are used to induce fission. The disruptions caused by mutations in Fis1 lead to an accumulation of large LC3 aggregates. We conclude that Fis1 can act in sequence with Mff at the ER-mitochondrial interface to couple stress-induced mitochondrial fission with downstream degradation processes.

Overview

The claims and statistics of this paper haven’t been checked yet.

Run the check — free, no account needed. It reads the open-access text and checks the sources it cites.

A few free checks a day · papers already verified open instantly · results are public

Integrity signals

Registry

Crossref · 10.1091/mbc.e13-09-0525

Cites

61 of 61 references verified0 citation errors · 0 not checkable

Statistics

Figures

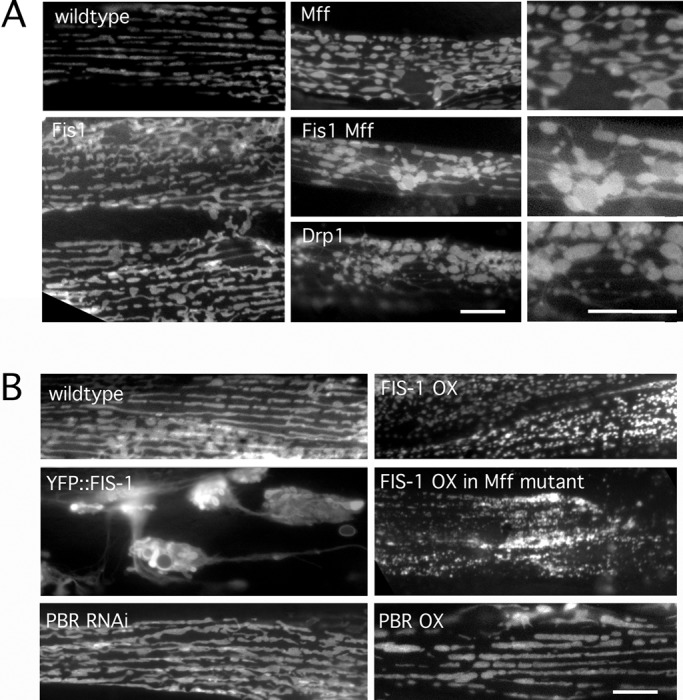
FIGURE 1: Effects of Mff and Fis1 on mitochondrial fission in C. elegans. (A) Mitochondria in C. elegans body wall muscles were labeled with mitochondrial outer membrane marker (YFP::Tom70, green) in strains as indicated. Right, enlargements of the Mff, Fis1 Mff, and Drp1 mutant images. (B) Effects of FIS-1 and YFP::FIS-1 overexpression with the muscle-specific myo-3 promoter. Mitochondria were labeled with YFP::TOM70. As a control for the effects of outer membrane proteins on mitochondrial morphology, we used feeding RNAi and an overexpression construct for another mitochondrial outer membrane protein (peripheral benzodiazepine receptor [PBR]). Bars, 10 μm.
FIGURE 1: Effects of Mff and Fis1 on mitochondrial fission in C. elegans. (A) Mitochondria in C. elegans body wall muscles were labeled with mitochondrial outer membrane marker (YFP::Tom70, green) in strains as indicated. Right, enlargements of the Mff, Fis1 Mff, and Drp1 mutant images. (B) Effects of FIS-1 and YFP::FIS-1 overexpression with the muscle-specific myo-3 promoter. Mitochondria were labeled with YFP::TOM70. As a control for the effects of outer membrane proteins on mitochondrial morphology, we used feeding RNAi and an overexpression construct for another mitochondrial outer membrane protein (peripheral benzodiazepine receptor [PBR]). Bars, 10 μm.CC BY-NC-SA · PubMed Central
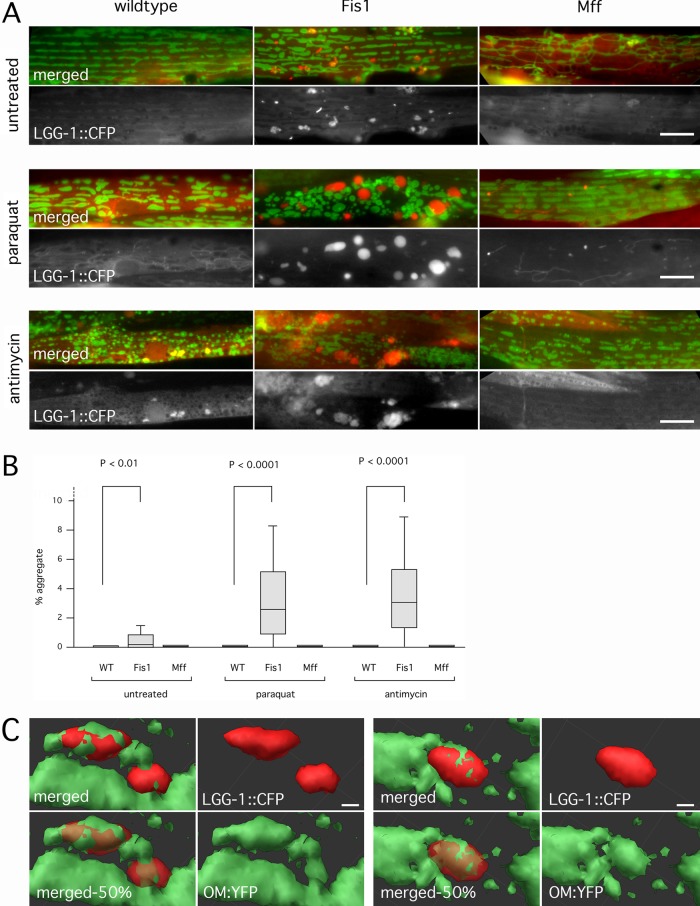
FIGURE 2: Fis1 genes trigger the formation of large autophagic aggregates. (A) CFP::LGG-1 (worm LC3, red) ectopically expressed in worm muscle cells along with YFP::TOM70 (green). Worms were untreated or incubated with Paraquat or antimycin A. Paraquat- and antimycin-treated worms were allowed to recover on plates without drugs (5 and 4 h, respectively). Bar, 10 μm. (B) Aggregate sizes, shown as percentages of cell surface area. Box plots represent 40 or more cells per condition (p values determined with unpaired Student's t test). (C) Surface renderings of LGG-1 aggregates (red) and mitochondria (green) in a Fis1 mutant treated with Paraquat as in A, but without recovery time. Two examples. These renderings were made from confocal microscope images (stacks of 27 images with steps of 230 nm). Bottom left, opacity of the red channel set at 50% to visualize embedded mitochondria (labeled as merged-50%). Otherwise, opacity was set at 100%. Bar, 1 μm.
FIGURE 2: Fis1 genes trigger the formation of large autophagic aggregates. (A) CFP::LGG-1 (worm LC3, red) ectopically expressed in worm muscle cells along with YFP::TOM70 (green). Worms were untreated or incubated with Paraquat or antimycin A. Paraquat- and antimycin-treated worms were allowed to recover on plates without drugs (5 and 4 h, respectively). Bar, 10 μm. (B) Aggregate sizes, shown as percentages of cell surface area. Box plots represent 40 or more cells per condition (p values determined with unpaired Student's t test). (C) Surface renderings of LGG-1 aggregates (red) and mitochondria (green) in a Fis1 mutant treated with Paraquat as in A, but without recovery time. Two examples. These renderings were made from confocal microscope images (stacks of 27 images with steps of 230 nm). Bottom left, opacity of the red channel set at 50% to visualize embedded mitochondria (labeled as merged-50%). Otherwise, opacity was set at 100%. Bar, 1 μm.CC BY-NC-SA · PubMed Central
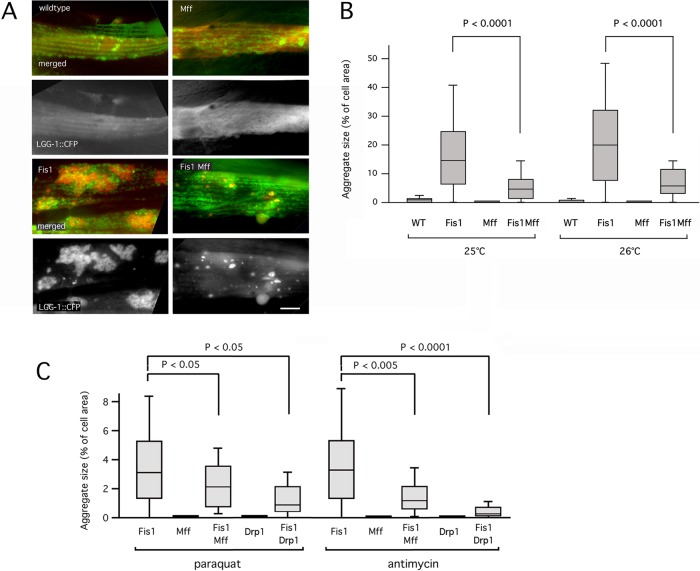
FIGURE 3: Mutations in Mff and Drp1 suppress aggregate formation. (A) The Fis1 double mutant has large aggregates when grown at 26°C. The Fis1 Mff quadruple mutant has much smaller aggregates under these conditions. Labeled as in Figure 2A. Bar, 10 μm. (B) Aggregate sizes, shown as percentages of cell surface area. Box plots represent 40 or more cells per condition (p values determined with unpaired Student's t test). Results are shown for growth at 25 and 26°C. (C) Mutations in Mff or Drp1 suppress Paraquat- and antimycin A–induced aggregate formation in Fis1 double mutants. Quantification of results is shown as in B.
FIGURE 3: Mutations in Mff and Drp1 suppress aggregate formation. (A) The Fis1 double mutant has large aggregates when grown at 26°C. The Fis1 Mff quadruple mutant has much smaller aggregates under these conditions. Labeled as in Figure 2A. Bar, 10 μm. (B) Aggregate sizes, shown as percentages of cell surface area. Box plots represent 40 or more cells per condition (p values determined with unpaired Student's t test). Results are shown for growth at 25 and 26°C. (C) Mutations in Mff or Drp1 suppress Paraquat- and antimycin A–induced aggregate formation in Fis1 double mutants. Quantification of results is shown as in B.CC BY-NC-SA · PubMed Central
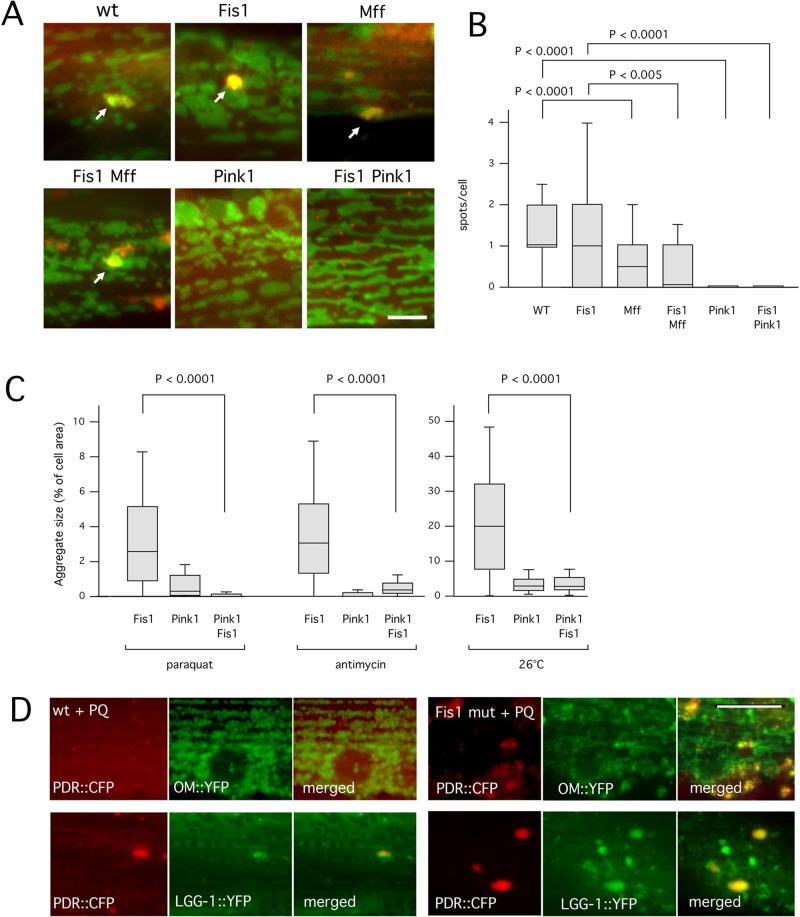
FIGURE 4: A mutation in Pink1 reduces the number of nascent mitophagosomes and suppresses aggregate formation in Fis1 mutants. (A) Mitophagy was induced by treatment for 1 h with Paraquat. Nascent mitophagosomes were detected by colocalization of CFP::LGG-1 (red) and YFP::TOM70 (green) in spots on the surface of mitochondria (arrows). As long as these spots were small (≤1 μm in diameter) they were classified as mitophagosomes. Larger spots were classified as aggregates. Strains were fis-1(tm1861); fis-2(gk414), pink-1(tm1799), and pink-1(tm1799) fis-1(tm1861); fis-2(gk414) (labeled as Fis1, Pink1, and Fis1 Pink1, respectively). Bar, 5 μm. (B) Boxplots showing the occurrence of CFP and YFP colocalizing spots per cell in the different strains (≥100 cells per condition, unpaired Student's t test). (C) Paraquat-, antimycin A–, and temperature-induced aggregate formation in Fis1, Pink1, and Fis1 Pink1 mutant strains. Aggregate sizes are shown as percentages of cell surface area. Box plots represent ≥40 cells per condition (p values determined with unpaired Student's t test). (D) C. elegans muscle cells labeled with (top) Parkin (PDR::CFP, red) and YFP::TOM70 (green) or (bottom) Parkin (PDR::CFP, red) and YFP::LGG-1 (green). Left, wild type, and right, Fis1 mutants treated with Paraquat (PQ). Bar, 10 μm.
FIGURE 4: A mutation in Pink1 reduces the number of nascent mitophagosomes and suppresses aggregate formation in Fis1 mutants. (A) Mitophagy was induced by treatment for 1 h with Paraquat. Nascent mitophagosomes were detected by colocalization of CFP::LGG-1 (red) and YFP::TOM70 (green) in spots on the surface of mitochondria (arrows). As long as these spots were small (≤1 μm in diameter) they were classified as mitophagosomes. Larger spots were classified as aggregates. Strains were fis-1(tm1861); fis-2(gk414), pink-1(tm1799), and pink-1(tm1799) fis-1(tm1861); fis-2(gk414) (labeled as Fis1, Pink1, and Fis1 Pink1, respectively). Bar, 5 μm. (B) Boxplots showing the occurrence of CFP and YFP colocalizing spots per cell in the different strains (≥100 cells per condition, unpaired Student's t test). (C) Paraquat-, antimycin A–, and temperature-induced aggregate formation in Fis1, Pink1, and Fis1 Pink1 mutant strains. Aggregate sizes are shown as percentages of cell surface area. Box plots represent ≥40 cells per condition (p values determined with unpaired Student's t test). (D) C. elegans muscle cells labeled with (top) Parkin (PDR::CFP, red) and YFP::TOM70 (green) or (bottom) Parkin (PDR::CFP, red) and YFP::LGG-1 (green). Left, wild type, and right, Fis1 mutants treated with Paraquat (PQ). Bar, 10 μm.CC BY-NC-SA · PubMed Central
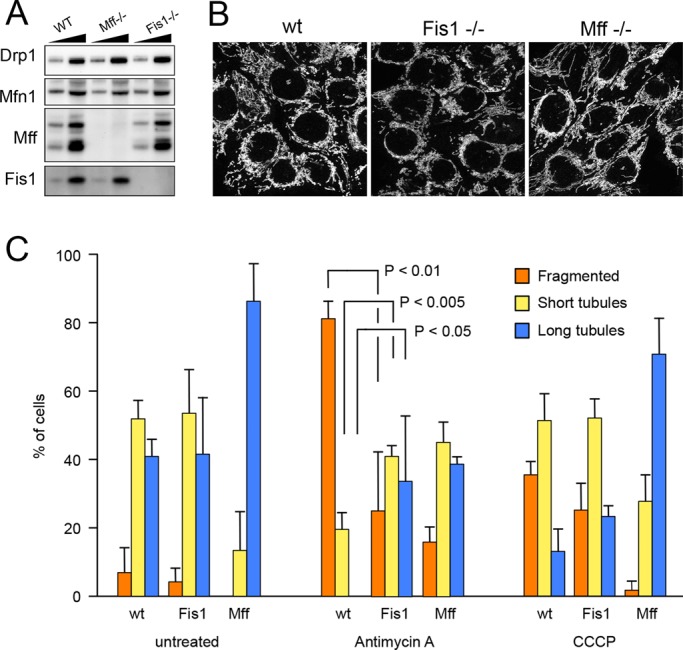
FIGURE 5: Characterization of mammalian Fis1−/− and Mff−/− cells. (A) Western blots showing that Fis1 is absent from HCT116 Fis1−/− cells and Mff is absent from HCT116 Mff−/− cells. Drp1 and Mfn1 expression levels were not changed. Low and high amounts of cell lysates were loaded on the gel for comparison. (B) Mitochondrial morphologies detected with anti-Tom20 antibody immunostaining in wild-type, Mff−/−, and Fis1−/− cells. (C) Quantification of mitochondrial morphologies in HCT116 wild-type, Fis1−/−, and Mff−/− cells that were left untreated or were treated for 10 min with antimycin A or CCCP. These cells were stained with MitoTracker Green and photographed. Thirty images for each condition were coded and pooled with the images for other conditions, allowing blind classification. Cells were classified as having predominantly fragmented, short tubular, or long tubular mitochondria. Mean and SD for three independent experiments. p values were determined with an unpaired Student's t test.
FIGURE 5: Characterization of mammalian Fis1−/− and Mff−/− cells. (A) Western blots showing that Fis1 is absent from HCT116 Fis1−/− cells and Mff is absent from HCT116 Mff−/− cells. Drp1 and Mfn1 expression levels were not changed. Low and high amounts of cell lysates were loaded on the gel for comparison. (B) Mitochondrial morphologies detected with anti-Tom20 antibody immunostaining in wild-type, Mff−/−, and Fis1−/− cells. (C) Quantification of mitochondrial morphologies in HCT116 wild-type, Fis1−/−, and Mff−/− cells that were left untreated or were treated for 10 min with antimycin A or CCCP. These cells were stained with MitoTracker Green and photographed. Thirty images for each condition were coded and pooled with the images for other conditions, allowing blind classification. Cells were classified as having predominantly fragmented, short tubular, or long tubular mitochondria. Mean and SD for three independent experiments. p values were determined with an unpaired Student's t test.CC BY-NC-SA · PubMed Central
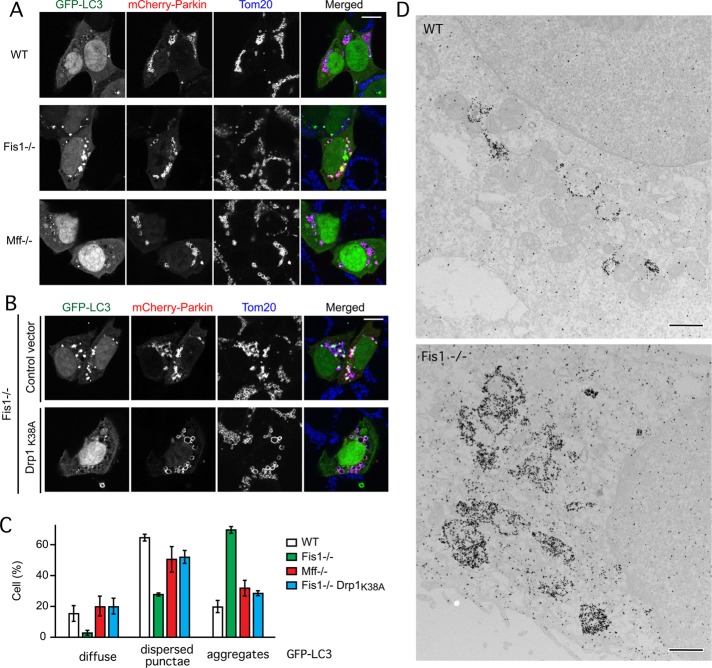
FIGURE 6: Large LC3 aggregates are formed in Fis1−/− mammalian cells. (A) LC3 aggregates induced by antimycin A in HCT116 Fis1−/− cells but not wild-type (WT) or Mff−/− cells. HCT116 WT, Fis1−/−, and Mff−/− cells were transfected with GFP-LC3 and mCherry-Parkin expression constructs, followed 18 h later by 3-h incubation with antimycin A to induce Parkin translocation onto mitochondria and immunostaining with anti-Tom20 antibody to label mitochondria. Bar, 10 μm. (B) GFP-LC3 aggregate formation is largely suppressed by transfection with a dominant-negative Drp1 mutant (Drp1K38A). Transfections and drugs as in A. (C) Quantification of results in A and B by classifying LC3 distributions as diffuse cytosolic, dispersed punctae, or large aggregates. Untreated cells (no antimycin A) had no aggregates (unpublished data). Mean and SD for three independent experiments (>100 cells/experiment). (D) Immunogold-labeled GFP-LC3 in an HCT116 WT cell and a Fis1−/− cell. Bar, 1 μm.
FIGURE 6: Large LC3 aggregates are formed in Fis1−/− mammalian cells. (A) LC3 aggregates induced by antimycin A in HCT116 Fis1−/− cells but not wild-type (WT) or Mff−/− cells. HCT116 WT, Fis1−/−, and Mff−/− cells were transfected with GFP-LC3 and mCherry-Parkin expression constructs, followed 18 h later by 3-h incubation with antimycin A to induce Parkin translocation onto mitochondria and immunostaining with anti-Tom20 antibody to label mitochondria. Bar, 10 μm. (B) GFP-LC3 aggregate formation is largely suppressed by transfection with a dominant-negative Drp1 mutant (Drp1K38A). Transfections and drugs as in A. (C) Quantification of results in A and B by classifying LC3 distributions as diffuse cytosolic, dispersed punctae, or large aggregates. Untreated cells (no antimycin A) had no aggregates (unpublished data). Mean and SD for three independent experiments (>100 cells/experiment). (D) Immunogold-labeled GFP-LC3 in an HCT116 WT cell and a Fis1−/− cell. Bar, 1 μm.CC BY-NC-SA · PubMed Central
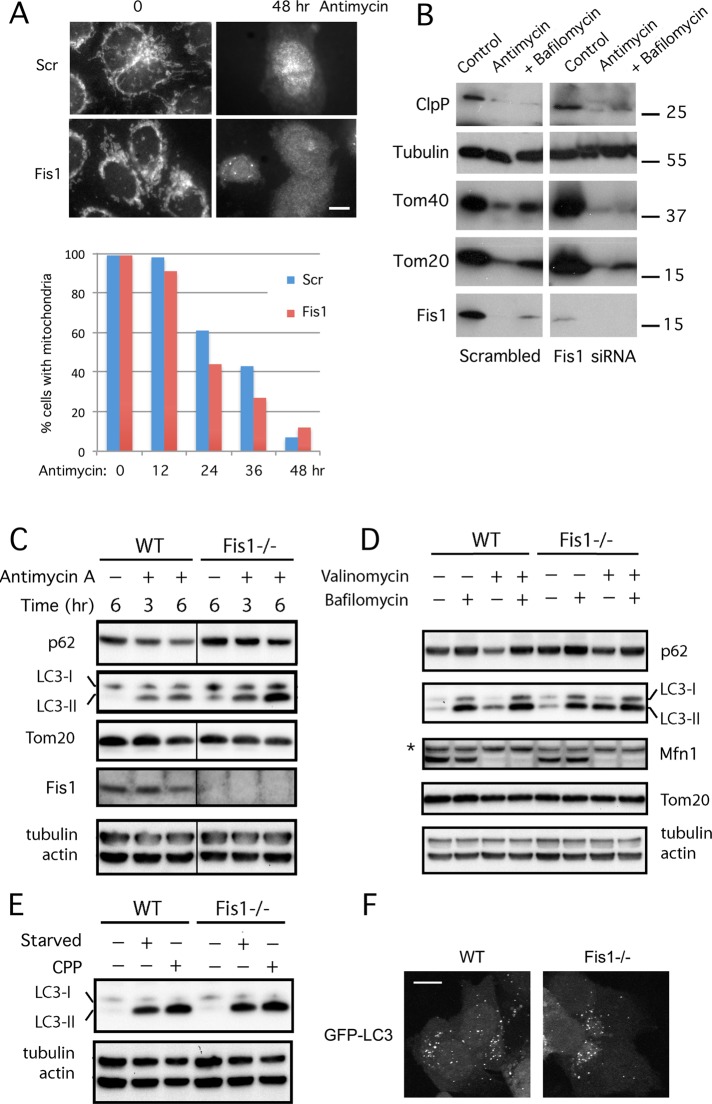
FIGURE 7: Fis1 acts before fusion to lysosomes in mammalian cells. (A) Clearance of mitochondria detected with fluorescence. HeLa cells that stably express GFP-Parkin were transfected with scrambled or Fis1 siRNA oligonucleotides and then treated for the indicated amounts of time with antimycin A. Cells were fixed and stained with Tom20 antibody (shown for 0- and 48-h treatments in the fluorescence images; bar, 10 μm). One hundred or more cells were assessed for the presence mitochondria and dispersal of Parkin as independent criteria at the time points shown in the histogram. (B) Clearance of mitochondria detected with Western blots. GFP-Parkin–expressing HeLa cells were transfected with siRNA and incubated for 48 h with solvent (dimethylsulfoxide), antimycin A, or antimycin A plus bafilomycin A1. Western blots were probed with antibodies for a mitochondrial matrix protein (ClpP), a cytosolic protein (tubulin), and three mitochondrial outer membrane proteins (Tom20, Tom40, and Fis1). The results show that mitochondrial outer membrane and matrix proteins are degraded to similar degrees in scrambled and Fis1 siRNA cells. (C) Western blots show accumulation of lipidated LC3 and inhibition of p62 degradation in Fis1−/− cells treated with antimycin A. HCT116 WT and Fis1−/− cell lines with stable EYFP-Parkin expression were treated with antimycin A for 3 or 6 h before cell lysis and immunoblotting. (D) Valinomycin induces increased LC3 lipidation in Fis1−/− cells, similar to antimycin A treatment, but this increase does not reflect an overall increase in autophagy, as shown with a block in further degradation by bafilomycin A1, nor does it reflect a block in mitochondrial degradation, as shown by the continued degradation of Mfn1 in valinomycin-treated Fis1−/− cells. HCT116 WT and Fis1−/− cell lines with stable enhanced YFP-Parkin expression were incubated for 1 h with or without valinomycin, followed by 5 h with or without bafilomycin A1. The asterisk indicates a nonspecific band. (E) Macroautophagy does not cause more LC3 lipidation in Fis1−/− than in WT cells. Macroautophagy was induced in EYFP-Parkin expressing HCT116 WT and Fis1−/− cells by 6-h amino acid starvation or with 4-h incubation with calcium phosphate precipitate (CPP). (F) Lack of LC3 clustering in cells with starvation-induced macroautophagy. GFP-LC3–transfected HCT116 WT and Fis1−/− cells were subjected to 6-h amino acid starvation and analyzed by fluorescence microscopy. Bar, 10 μm.
FIGURE 7: Fis1 acts before fusion to lysosomes in mammalian cells. (A) Clearance of mitochondria detected with fluorescence. HeLa cells that stably express GFP-Parkin were transfected with scrambled or Fis1 siRNA oligonucleotides and then treated for the indicated amounts of time with antimycin A. Cells were fixed and stained with Tom20 antibody (shown for 0- and 48-h treatments in the fluorescence images; bar, 10 μm). One hundred or more cells were assessed for the presence mitochondria and dispersal of Parkin as independent criteria at the time points shown in the histogram. (B) Clearance of mitochondria detected with Western blots. GFP-Parkin–expressing HeLa cells were transfected with siRNA and incubated for 48 h with solvent (dimethylsulfoxide), antimycin A, or antimycin A plus bafilomycin A1. Western blots were probed with antibodies for a mitochondrial matrix protein (ClpP), a cytosolic protein (tubulin), and three mitochondrial outer membrane proteins (Tom20, Tom40, and Fis1). The results show that mitochondrial outer membrane and matrix proteins are degraded to similar degrees in scrambled and Fis1 siRNA cells. (C) Western blots show accumulation of lipidated LC3 and inhibition of p62 degradation in Fis1−/− cells treated with antimycin A. HCT116 WT and Fis1−/− cell lines with stable EYFP-Parkin expression were treated with antimycin A for 3 or 6 h before cell lysis and immunoblotting. (D) Valinomycin induces increased LC3 lipidation in Fis1−/− cells, similar to antimycin A treatment, but this increase does not reflect an overall increase in autophagy, as shown with a block in further degradation by bafilomycin A1, nor does it reflect a block in mitochondrial degradation, as shown by the continued degradation of Mfn1 in valinomycin-treated Fis1−/− cells. HCT116 WT and Fis1−/− cell lines with stable enhanced YFP-Parkin expression were incubated for 1 h with or without valinomycin, followed by 5 h with or without bafilomycin A1. The asterisk indicates a nonspecific band. (E) Macroautophagy does not cause more LC3 lipidation in Fis1−/− than in WT cells. Macroautophagy was induced in EYFP-Parkin expressing HCT116 WT and Fis1−/− cells by 6-h amino acid starvation or with 4-h incubation with calcium phosphate precipitate (CPP). (F) Lack of LC3 clustering in cells with starvation-induced macroautophagy. GFP-LC3–transfected HCT116 WT and Fis1−/− cells were subjected to 6-h amino acid starvation and analyzed by fluorescence microscopy. Bar, 10 μm.CC BY-NC-SA · PubMed Central
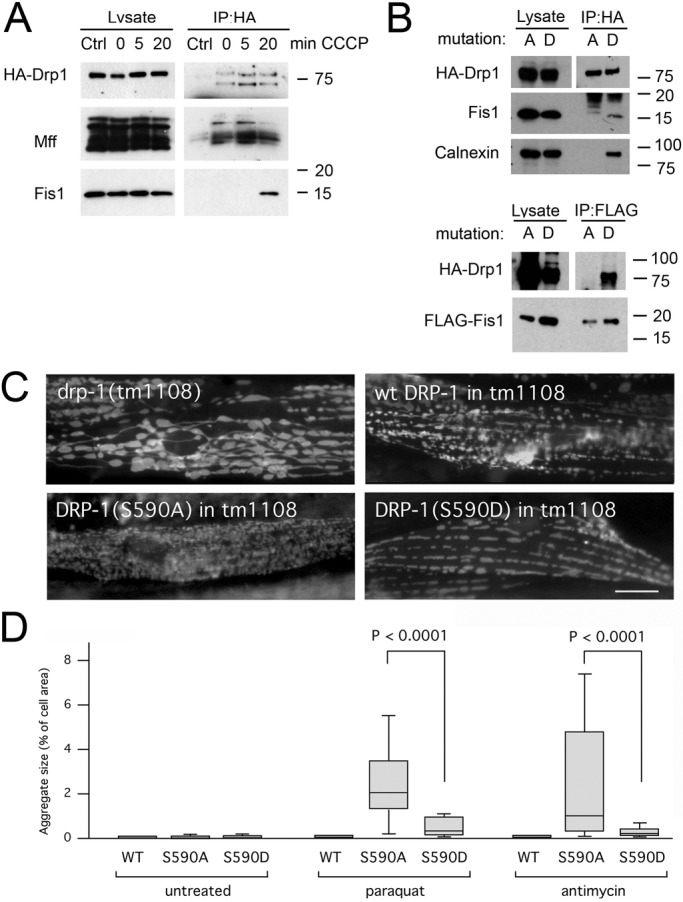
FIGURE 8: Drp1 enters into a complex with Fis1 when fission is induced. (A) HeLa cells were transfected with HA-Drp1 and treated for the indicated amounts of time with CCCP to induce mitochondrial fission. The cells were then treated with DSP and lysed with 1% SDS before coimmunoprecipitation with mock (Ctrl) or mouse HA antibody. Western blots were probed with rabbit anti-HA, Mff, and Fis1 antibodies. (B) Top, results of HeLa cell transfections with HA-Drp1(S600A) or HA-Drp1(S600D), treatment with DSP, coimmunoprecipitation with HA antibody, and probing for endogenous Fis1. Calnexin also coimmunoprecipitates with HA-Drp1(S600D) but not with HA-Drp1(S600A). Bottom, results obtained after cotransfection with FLAG-tagged Fis1 and coimmunoprecipitation with FLAG antibody. (C) Mitochondrial morphologies in C. elegans muscle cells detected with the mitochondrial outer membrane marker (Pmyo-3::Tom70::YFP). Mitochondria in drp-1(tm1108) worms are highly connected. Mitochondrial fission was restored with transgenic DRP-1(wt), transgenic DRP-1(S590A), or transgenic DRP-1(S590D). Bar, 10 μm. (D) LGG-1 aggregate sizes in muscle cells of drp-1(tm1108) worms treated with chemicals as indicated. Mitochondrial fission was restored with transgenic DRP-1(wt), transgenic DRP-1(S590A), or transgenic DRP-1(S590D). Aggregate sizes are shown as percentages of cell surface area as in Figure 2B (n > 40 cells/condition, unpaired Student's t test).
FIGURE 8: Drp1 enters into a complex with Fis1 when fission is induced. (A) HeLa cells were transfected with HA-Drp1 and treated for the indicated amounts of time with CCCP to induce mitochondrial fission. The cells were then treated with DSP and lysed with 1% SDS before coimmunoprecipitation with mock (Ctrl) or mouse HA antibody. Western blots were probed with rabbit anti-HA, Mff, and Fis1 antibodies. (B) Top, results of HeLa cell transfections with HA-Drp1(S600A) or HA-Drp1(S600D), treatment with DSP, coimmunoprecipitation with HA antibody, and probing for endogenous Fis1. Calnexin also coimmunoprecipitates with HA-Drp1(S600D) but not with HA-Drp1(S600A). Bottom, results obtained after cotransfection with FLAG-tagged Fis1 and coimmunoprecipitation with FLAG antibody. (C) Mitochondrial morphologies in C. elegans muscle cells detected with the mitochondrial outer membrane marker (Pmyo-3::Tom70::YFP). Mitochondria in drp-1(tm1108) worms are highly connected. Mitochondrial fission was restored with transgenic DRP-1(wt), transgenic DRP-1(S590A), or transgenic DRP-1(S590D). Bar, 10 μm. (D) LGG-1 aggregate sizes in muscle cells of drp-1(tm1108) worms treated with chemicals as indicated. Mitochondrial fission was restored with transgenic DRP-1(wt), transgenic DRP-1(S590A), or transgenic DRP-1(S590D). Aggregate sizes are shown as percentages of cell surface area as in Figure 2B (n > 40 cells/condition, unpaired Student's t test).CC BY-NC-SA · PubMed Central
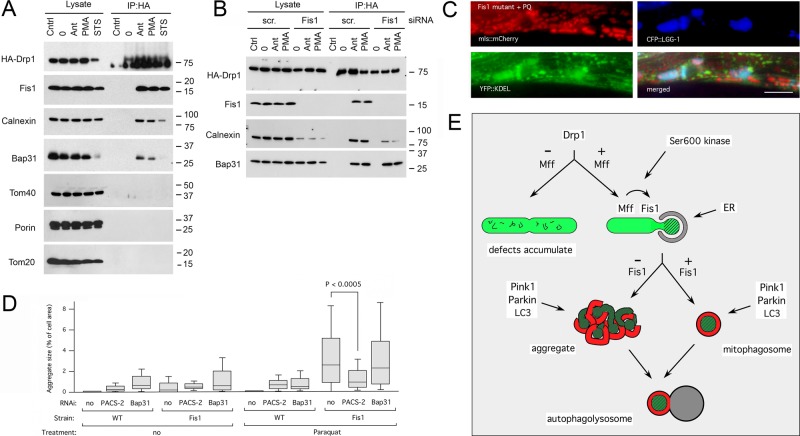
FIGURE 9: The Drp1-Fis1 complex also contains ER proteins. (A) HeLa cells were transfected with HA-Drp1 and treated as in Figure 8A, but instead of CCCP they were incubated for 3 h with antimycin A (Ant), phorbol myristic acid (PMA), or staurosporine (STS), followed by cross-linking and lysis with RIPA. Blots were probed with HA, Fis1, calnexin, Bap31, Tom40, porin, and Tom20 antibodies. Bap31 is partially degraded by caspase 8–dependent cleavage when cells are treated with staurosporine (Iwasawa et al., 2011), but this treatment clearly also induces coimmunoprecipitation with Drp1. (B) HeLa cells were transfected with scrambled or Fis1 siRNA oligonucleotides, followed after 2 d by transfection with HA-Drp1, and then treated as in A. Surprisingly, the overall amount of calnexin was reduced by Fis1 siRNA, but this did not prevent coimmunoprecipitation with HA-Drp1. (C) Triple labeling with mls::mCherry (red), the ER marker ss:YFP::KDEL (green), and CFP::LGG-1 (blue). The images show that LGG-1 clusters contain ER. Bar, 10 μm. (D) Aggregate sizes in muscle cells of wild-type worms and Fis1 mutants grown with RNAi for C. elegans PACS-2 (T18H9.7) or Bap31 (Y54G2A.18) homologues, followed by treatment with Paraquat. Aggregate sizes are shown as percentages of cell surface area. Boxplots represent ≥40 cells/condition (p values determined with unpaired Student's t test). (E) Diagram showing where Drp1, Mff, and Fis1 act during mitochondrial fission and subsequent degradation through mitophagy.
FIGURE 9: The Drp1-Fis1 complex also contains ER proteins. (A) HeLa cells were transfected with HA-Drp1 and treated as in Figure 8A, but instead of CCCP they were incubated for 3 h with antimycin A (Ant), phorbol myristic acid (PMA), or staurosporine (STS), followed by cross-linking and lysis with RIPA. Blots were probed with HA, Fis1, calnexin, Bap31, Tom40, porin, and Tom20 antibodies. Bap31 is partially degraded by caspase 8–dependent cleavage when cells are treated with staurosporine (Iwasawa et al., 2011), but this treatment clearly also induces coimmunoprecipitation with Drp1. (B) HeLa cells were transfected with scrambled or Fis1 siRNA oligonucleotides, followed after 2 d by transfection with HA-Drp1, and then treated as in A. Surprisingly, the overall amount of calnexin was reduced by Fis1 siRNA, but this did not prevent coimmunoprecipitation with HA-Drp1. (C) Triple labeling with mls::mCherry (red), the ER marker ss:YFP::KDEL (green), and CFP::LGG-1 (blue). The images show that LGG-1 clusters contain ER. Bar, 10 μm. (D) Aggregate sizes in muscle cells of wild-type worms and Fis1 mutants grown with RNAi for C. elegans PACS-2 (T18H9.7) or Bap31 (Y54G2A.18) homologues, followed by treatment with Paraquat. Aggregate sizes are shown as percentages of cell surface area. Boxplots represent ≥40 cells/condition (p values determined with unpaired Student's t test). (E) Diagram showing where Drp1, Mff, and Fis1 act during mitochondrial fission and subsequent degradation through mitophagy.CC BY-NC-SA · PubMed Central

Verification

Claims the paper makes

The claims and statistics of this paper haven’t been checked yet.

Run the check — free, no account needed. It reads the open-access text and checks the sources it cites.

A few free checks a day · papers already verified open instantly · results are public

Claims other papers make about this one

Each is checked against this paper’s own text: does it say what the citing paper says it does?

Self-check

Percentages, sums and reported differences re-computed from the paper’s own numbers.

The self-check needs the paper’s full text.

Citations

Cites

Show all 61 references

Cited by

Sorted by citations

See all 209

Metadata

Authors
Shen, Q., Yamano, K., Head, B. P., Kawajiri, S., Cheung, J. T. M., Wang, C., Cho, J.-H., Hattori, N., Youle, R. J., & van der Bliek, A. M.
Affiliations
  • University of California, Los Angeles (US)
  • National Institutes of Health (US)
  • Juntendo University (JP)
  • Department of Biological Chemistry, David Geffen School of Medicine at UCLA, Los Angeles, CA 90095
Venue
Molecular Biology of the Cell
Published
2014-01
Volume
25
Issue
1
Pages
145-159
ISSN
  • 1059-1524 (ISSN-L)
  • 1939-4586
OpenAlex
W2166496519
Cited by
209
References
61
Citations by year
2026: 7 · 2025: 8 · 2024: 14 · 2023: 13 · 2022: 19 · 2021: 29 · 2020: 17 · 2019: 19 · 2018: 16 · 2017: 19 · 2016: 21 · 2015: 16 · 2014: 11
FWCI
7.13
Type
journal article
Language
en
Open access
Licence
cc-by-nc-sa
Locations
  • Molecular Biology of the Cell (publishedVersion)
  • Europe PMC (PubMed Central) (publishedVersion, cc-by-nc-sa)
  • PubMed Central (publishedVersion, cc-by-nc-sa)
  • PubMed (publishedVersion)
Funders
  • National Institute of General Medical Sciences (T32GM007104, R01GM051866, GM-051866)
  • National Institute of Neurological Disorders and Stroke
Topics
  • Life Sciences › Biochemistry, Genetics and Molecular Biology › Molecular Biology › Mitochondrial Function and Pathology
  • Life Sciences › Biochemistry, Genetics and Molecular Biology › Cell Biology › Autophagy in Disease and Therapy
  • Life Sciences › Biochemistry, Genetics and Molecular Biology › Molecular Biology › Cell death mechanisms and regulation
Keywords
Fis1, mitochondrial fission, Drp1, Mff, mitochondrial outer membrane proteins, mitophagy, mitochondrial toxins, dynamin-related proteins
MeSH terms
Animals, Endoplasmic Reticulum, HeLa Cells, Humans, Membrane Proteins, Microtubule-Associated Proteins, Muscles, Caenorhabditis elegans, Mutation, Missense, Mitochondrial Proteins, Caenorhabditis elegans Proteins, HCT116 Cells, Proteolysis, Mitochondrial Dynamics

About these checks

Registry, retraction, Cites and statistics results are computed, not judged, with one exception: a printed reference that no index lists is read once by a model before it counts as a citation error. Claims are extracted by a model and kept only when their quote appears verbatim in the text; each cited source is then checked, with a model’s help, for whether it says what the claim relies on. Those verdicts can be wrong — read the claim’s quote and the cited source before relying on one.

Statistics and arithmetic are recomputed, not judged.

Confidence bands are shown only for fields calibrated on our annotated test set. None is calibrated yet, so no band is shown.

What counts as a claim ›How we measure confidence ›How we check this ›

Are you an author, or do you see a problem with this page? Request a review