

The DOI matches its Crossref record; 3 of the 3 references it cites were found in a registry or an index.
Ligand identification in CryoEM and X-ray maps using deep learning
Open accessPublished version of a preprint
Abstract
Motivation: Accurately identifying ligands plays a crucial role in the process of structure-guided drug design. Based on density maps from X-ray diffraction or cryogenic-sample electron microscopy (cryoEM), scientists verify whether small-molecule ligands bind to active sites of interest. However, the interpretation of density maps is challenging, and cognitive bias can sometimes mislead investigators into modeling fictitious compounds. Ligand identification can be aided by automatic methods, but existing approaches are available only for X-ray diffraction and are based on iterative fitting or feature-engineered machine learning rather than end-to-end deep learning. Results: Here, we propose to identify ligands using a deep-learning approach that treats density maps as 3D point clouds. We show that the proposed model is on par with existing machine learning methods for X-ray crystallography while also being applicable to cryoEM density maps. Our study demonstrates that electron density map fragments can aid the training of models that can later be applied to cryoEM structures but also highlights challenges associated with the standardization of electron microscopy maps and the quality assessment of cryoEM ligands. Availability and implementation: Code and model weights are available on GitHub at https://github.com/jkarolczak/ligands-classification. An accompanying ChimeraX bundle is available at https://github.com/wtaisner/chimerax-ligand-recognizer.
Overview
The claims and statistics of this paper haven’t been checked yet.
Run the check — free, no account needed. It reads the open-access text and checks the sources it cites.
Integrity signals
Registry
Cites
Statistics
Figures
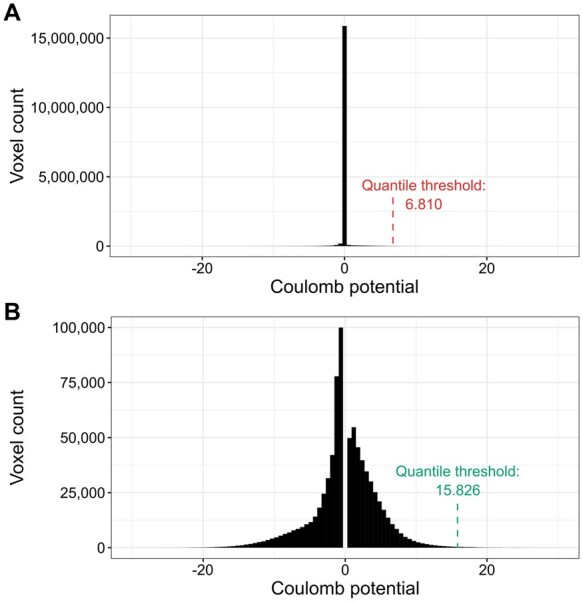

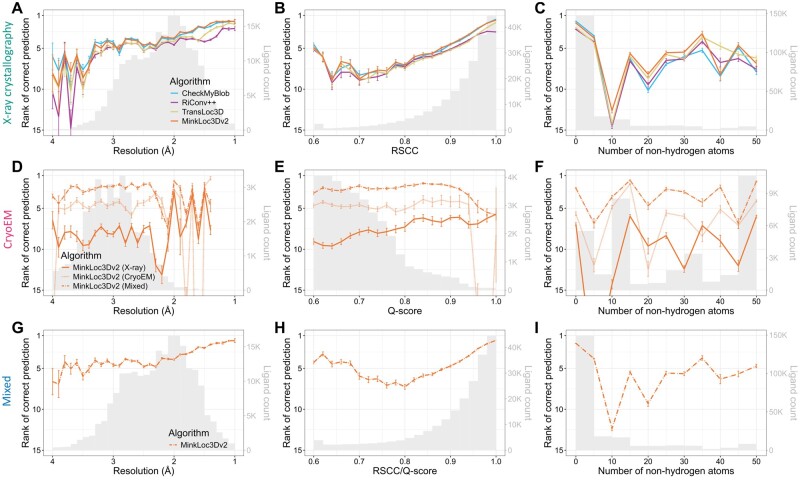
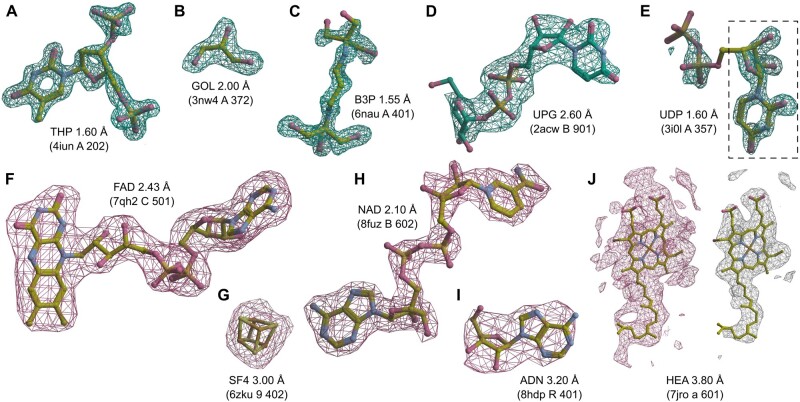
Verification
Claims the paper makes
The claims and statistics of this paper haven’t been checked yet.
Run the check — free, no account needed. It reads the open-access text and checks the sources it cites.
Self-check
Percentages, sums and reported differences re-computed from the paper’s own numbers.
The self-check needs the paper’s full text.
Citations
Cites
Highly accurate protein structure prediction with AlphaFold
Jumper, J., Evans, R., Pritzel, A., Green, T., Figurnov, M., Ronneberger, O., Tunyasuvunakool, K., Bates, R., Žídek, A., Potapenko, A., et al. (2021) · Nature · doi:10.1038/s41586-021-03819-2 · Cited by 43,764
Accurate prediction of protein structures and interactions using a 3-track network
Baek, M., DiMaio, F., Anishchenko, I., Dauparas, J., Ovchinnikov, S., Lee, G. R., Wang, J., Cong, Q., Kinch, L. N., Schaeffer, R. D., et al. (2021) · doi:10.1101/2021.06.14.448402 · Cited by 5,549
Automated model building and protein identification in cryo-EM maps
Jamali, K., Käll, L., Zhang, R., Brown, A., Kimanius, D., & Scheres, S. H. W. (2023) · doi:10.1101/2023.05.16.541002 · Cited by 686
Research works printed but not linked: 42
- Afonine, 2018, New tools for the analysis and validation of cryo-EM maps and atomic models, Acta Crystallogr D Struct Biol, 74, 814, 10.1107/S2059798318009324 · DOI
- Aishima, 2005, Automated crystallographic ligand building using the medial axis transform of an electron-density isosurface, Acta Crystallogr D Biol Crystallogr, 61, 1354, 10.1107/S0907444905023152 · DOI
- Banko, 2021, Deep learning for visualization and novelty detection in large X-ray diffraction datasets, NPJ Comput Mater, 7, 104, 10.1038/s41524-021-00575-9 · DOI
- Beckers, 2019, Thresholding of cryo-EM density maps by false discovery rate control, IUCrJ, 6, 18, 10.1107/S2052252518014434 · DOI
- Bepler, 2019, Positive-unlabeled convolutional neural networks for particle picking in cryo-electron micrographs, Nat Methods, 16, 1153, 10.1038/s41592-019-0575-8 · DOI
- Berman, 2000, The protein data bank, Nucleic Acids Res, 28, 235, 10.1093/nar/28.1.235 · DOI · Paper page
- Brzezinski, 2021, Recognizing and validating ligands with CheckMyBlob, Nucleic Acids Res, 49, W86, 10.1093/nar/gkab296 · DOI
- Burley, 2022, Electron microscopy holdings of the protein data bank: the impact of the resolution revolution, new validation tools, and implications for the future, Biophys Rev, 14, 1281, 10.1007/s12551-022-01013-w · DOI
- Carolan, 2014, Automated identification of crystallographic ligands using sparse-density representations, Acta Crystallogr D Biol Crystallogr, 70, 1844, 10.1107/S1399004714008578 · DOI
- Czyzewski, 2021, Detecting anomalies in X-ray diffraction images using convolutional neural networks, Expert Syst Appl, 174, 114740, 10.1016/j.eswa.2021.114740 · DOI
- Deller, 2015, Models of protein–ligand crystal structures: trust, but verify, J Comput Aided Mol Des, 29, 817, 10.1007/s10822-015-9833-8 · DOI
- Dhakal, 2024, CryoTransformer: a transformer model for picking protein particles from Cryo-EM micrographs, Bioinformatics, 40, 10.1093/bioinformatics/btae109 · DOI
- Evrard, 2007, Assessment of automatic ligand building in ARP/wARP, Acta Crystallogr D Biol Crystallogr, 63, 108, 10.1107/S0907444906023389 · DOI
- Gunasekaran, 2009, Pattern Recognition in Bioinformatics, Lecture Notes in Computer Science, 125, 10.1007/978-3-642-04031-3_12 · DOI
- He, 2023, Improvement of cryo-EM maps by simultaneous local and non-local deep learning, Nat Commun, 14, 3217, 10.1038/s41467-023-39031-1 · DOI
- Ito, 2019, DeepCentering: fully automated crystal centering using deep learning for macromolecular crystallography, J Synchrotron Radiat, 26, 1361, 10.1107/S160057751900434X · DOI
- Japkowicz, 2011, Evaluating Learning Algorithms: A Classification Perspective, 10.1017/CBO9780511921803 · DOI · Paper page
- Kowiel, 2019, Automatic recognition of ligands in electron density by machine learning, Bioinformatics, 35, 452, 10.1093/bioinformatics/bty626 · DOI
- Lawson, 2024, Outcomes of the EMDataResource cryo-EM ligand modeling challenge, Nat Methods, 21, 1340, 10.1038/s41592-024-02321-7 · DOI
- Li, 2024, All-atom RNA structure determination from cryo-EM maps, Nat Biotechnol, 10.1038/s41587-024-02149-8 · DOI
- Liebschner, 2019, Macromolecular structure determination using X-rays, neutrons and electrons: recent developments in phenix, Acta Crystallogr D Struct Biol, 75, 861, 10.1107/S2059798319011471 · DOI · Paper page
- Marques, 2019, CryoEM maps are full of potential, Curr Opin Struct Biol, 58, 214, 10.1016/j.sbi.2019.04.006 · DOI
- Matinyan, 2024, Deep learning applications in protein crystallography, Acta Crystallogr A Found Adv, 80, 1, 10.1107/S2053273323009300 · DOI
- Misiura, 2022, DLPacker : deep learning for prediction of amino acid side chain conformations in proteins, Proteins, 90, 1278, 10.1002/prot.26311 · DOI · Paper page
- Mitsuoka, 1999, The structure of bacteriorhodopsin at 3.0 Å resolution based on electron crystallography: implication of the charge distribution 1 1Edited by R. Huber, J Mol Biol, 286, 861, 10.1006/jmbi.1998.2529 · DOI
- Muenks, 2023, Automatic and accurate ligand structure determination guided by cryo-electron microscopy maps, Nat Commun, 14, 1164, 10.1038/s41467-023-36732-5 · DOI · Paper page
- Pan, 2023, A deep learning solution for crystallographic structure determination, IUCrJ, 10, 487, 10.1107/S2052252523004293 · DOI
- Pearce, 2017, A multi-crystal method for extracting obscured crystallographic states from conventionally uninterpretable electron density, Nat Commun, 8, 15123, 10.1038/ncomms15123 · DOI
- Pintilie, 2020, Measurement of atom resolvability in cryo-EM maps with Q-scores, Nat Methods, 17, 328, 10.1038/s41592-020-0731-1 · DOI
- Rosenthal, 2003, Optimal determination of particle orientation, absolute hand, and contrast loss in single-particle electron cryomicroscopy, J Mol Biol, 333, 721, 10.1016/j.jmb.2003.07.013 · DOI · Paper page
- Sanchez-Garcia, 2021, DeepEMhancer: a deep learning solution for cryo-EM volume post-processing, Commun Biol, 4, 874, 10.1038/s42003-021-02399-1 · DOI
- Smart, 2018, Validation of ligands in macromolecular structures determined by X-ray crystallography, Acta Crystallogr D Struct Biol, 74, 228, 10.1107/S2059798318002541 · DOI
- Terwilliger, 2006, Automated ligand fitting by core-fragment fitting and extension into density, Acta Crystallogr D Biol Crystallogr, 62, 915, 10.1107/S0907444906017161 · DOI
- Terwilliger, 2007, Ligand identification using electron-density map correlations, Acta Crystallogr D Biol Crystallogr, 63, 101, 10.1107/S0907444906046233 · DOI
- Turner, 2024, EMDB—the electron microscopy data bank, Nucleic Acids Res, 52, D456, 10.1093/nar/gkad1019 · DOI
- Wang, 2017, Experimental charge density from electron microscopic maps, Protein Sci, 26, 1619, 10.1002/pro.3198 · DOI
- Weiler, 2018, 32nd Conference on Neural Information Processing Systems (NeurIPS 2018). Montréal, Canada
- Wlodawer, 2018, Detect, correct, retract: how to manage incorrect structural models, Febs J, 285, 444, 10.1111/febs.14320 · DOI
- Xu, 2023, TransLoc3D: point cloud based large-scale place recognition using adaptive receptive fields, Commun Inf Syst, 23, 57, 10.4310/CIS.2023.v23.n1.a3 · DOI
- Zhang, 2022, RIConv++: effective rotation invariant convolutions for 3D point clouds deep learning, Int J Comput Vis, 130, 1228, 10.1007/s11263-022-01601-z · DOI
- Zwart, 2004, Modelling bound ligands in protein crystal structures, Acta Crystallogr D Biol Crystallogr, 60, 2230, 10.1107/S0907444904012995 · DOI
- Zywanowski, 2022, MinkLoc3D-SI: 3D LiDAR place recognition with sparse convolutions, spherical coordinates, and intensity, IEEE Robot Autom Lett, 7, 1079, 10.1109/LRA.2021.3136863 · DOI
Metadata
- Authors
- Karolczak, J., Przybyłowska, A., Szewczyk, K., Taisner, W., Heumann, J. M., Stowell, M. H. B., Nowicki, M., & Brzezinski, D.
- Affiliations
- Poznań University of Technology (PL)
- University of Colorado Boulder (US)
- Institute of Computing Science, Poznan University of Technology , Poznan 60-965,
- ORCID
- Venue
- Bioinformatics
- Publisher
- Oxford University Press (OUP)
- Published
- 2024-12-19
- Volume
- 41
- Issue
- 1
- ISSN
- 1367-4803 (ISSN-L)
- 1367-4811
- PMC
- PMC11709248
- OpenAlex
- W4405596261
- Cited by
- 7
- References
- 3
- Citations by year
- 2026: 3 · 2025: 4
- FWCI
- 0.68
- Type
- journal article
- Language
- en
- Open access
- gold
- doi.org
- Licence
- Locations
- Bioinformatics (publishedVersion, cc-by)
- bioRxiv (Cold Spring Harbor Laboratory) (acceptedVersion, cc-by)
- PubMed Central (publishedVersion, cc-by)
- PubMed (publishedVersion)
- PubMed Central (submittedVersion, cc-by)
- Funders
- NIH (AG061829, NS120496, U24-GM139174)
- Topics
- Life Sciences › Biochemistry, Genetics and Molecular Biology › Structural Biology › Enzyme Structure and Function
- Life Sciences › Pharmacology, Toxicology and Pharmaceutics › Drug Discovery › Computational Drug Discovery Methods
- Life Sciences › Biochemistry, Genetics and Molecular Biology › Structural Biology › Advanced Electron Microscopy Techniques and Applications
- Keywords
- ligand identification, 3D point clouds, deep learning, ligand classification, structure-based drug design, map standardization
About these checks
Registry, retraction, Cites and statistics results are computed, not judged, with one exception: a printed reference that no index lists is read once by a model before it counts as a citation error. Claims are extracted by a model and kept only when their quote appears verbatim in the text; each cited source is then checked, with a model’s help, for whether it says what the claim relies on. Those verdicts can be wrong — read the claim’s quote and the cited source before relying on one.
Statistics and arithmetic are recomputed, not judged.
Confidence bands are shown only for fields calibrated on our annotated test set. None is calibrated yet, so no band is shown.
What counts as a claim ›How we measure confidence ›How we check this ›
Are you an author, or do you see a problem with this page? Request a review
How to cite
Cite CoChat for the checks on this page, and the paper for its own findings.
- This page
- CoChat. (2026). Citation check: Ligand identification in CryoEM and X-ray maps using deep learning. https://app.cochat.ai/papers/10.1093/bioinformatics/btae749
- The paper
- Karolczak, J., Przybyłowska, A., Szewczyk, K., Taisner, W., Heumann, J. M., Stowell, M. H. B., Nowicki, M., & Brzezinski, D. (2024). Ligand identification in CryoEM and X-ray maps using deep learning. Bioinformatics. https://doi.org/10.1093/bioinformatics/btae749
