

The DOI matches its Crossref record; 38 of the 38 references it cites were found in a registry or an index.
Removing technical variability in RNA-seq data using conditional quantile normalization
Open accessAbstract
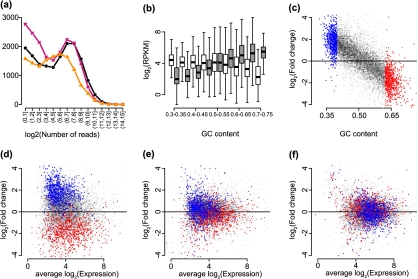
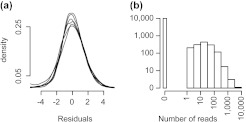
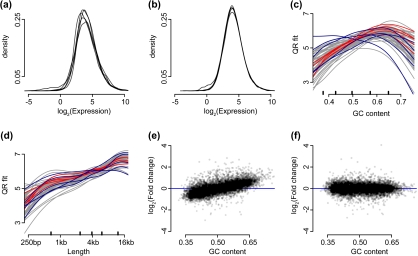
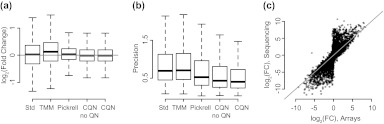
The ability to measure gene expression on a genome-wide scale is one of the most promising accomplishments in molecular biology. Microarrays, the technology that first permitted this, were riddled with problems due to unwanted sources of variability. Many of these problems are now mitigated, after a decade's worth of statistical methodology development. The recently developed RNA sequencing (RNA-seq) technology has generated much excitement in part due to claims of reduced variability in comparison to microarrays. However, we show that RNA-seq data demonstrate unwanted and obscuring variability similar to what was first observed in microarrays. In particular, we find guanine-cytosine content (GC-content) has a strong sample-specific effect on gene expression measurements that, if left uncorrected, leads to false positives in downstream results. We also report on commonly observed data distortions that demonstrate the need for data normalization. Here, we describe a statistical methodology that improves precision by 42% without loss of accuracy. Our resulting conditional quantile normalization algorithm combines robust generalized regression to remove systematic bias introduced by deterministic features such as GC-content and quantile normalization to correct for global distortions.
Overview
The claims and statistics of this paper haven’t been checked yet.
Run the check — free, no account needed. It reads the open-access text and checks the sources it cites.
Integrity signals
Registry
Cites
Statistics
Figures
Verification
Claims the paper makes
The claims and statistics of this paper haven’t been checked yet.
Run the check — free, no account needed. It reads the open-access text and checks the sources it cites.
Claims other papers make about this one
Each is checked against this paper’s own text: does it say what the citing paper says it does?
The source backs part of the claim, not all of it — or backs it for a different population, condition or comparison.
In the citing paper
“commonly used methods fornormalization (cqn, EDASeq, RUV2, sva, PEER) varied in their ability to remove these systematic biases, depending on sample complexity and initial data quality.”
From Detecting and correcting systematic variation in large-scale RNA sequencing data (2014) · cites this paper as [14]
Experimental — accuracy not yet measuredThe cited source says what the claim attributes to it.
In the citing paper
“Alternatively, voom has the ability to respect normalization factors computed outside of limma by methods such as trimmed mean of M-values (41) or conditional quantile normalization (42).”
From limma powers differential expression analyses for RNA-sequencing and microarray studies (2015) · cites this paper as [42]
The cited source says what the claim attributes to it.
In the citing paper
“Conditional quantile normalization using the cqn Bioconductor package48 was applied to the RNAseq data, to reduce variability introduced by GC content, gene size and total gene counts per sample.”
From Cellular senescence mediates fibrotic pulmonary disease (2017) · cites this paper as [48]
In the citing paper
“Notably, neither applying GC bias correction tools (cqn14 and EDASeq15) to individual sites nor changing read counts to only use 3′-UTRs was effective at decreasing the number of inter-site false positive DEGs (Fig. 1b and Supplementary Fig. 3); in most cases, these methods actually increased the number of false positives.”
From Detecting and correcting systematic variation in large-scale RNA sequencing data (2014) · cites this paper as [14]
In the citing paper
“The application of GC content bias correction packages including cqn14 and EDASeq15 could not remove these false positives, likely because GC content bias is not the only source that contributes to bias in gene expression data.”
From Detecting and correcting systematic variation in large-scale RNA sequencing data (2014) · cites this paper as [14]
In the citing paper
“This slow progress can be attributed, in part, to both the extreme phenotypic heterogeneity and involvement of hundreds of loci in the disorder45.”
From Transcriptome analysis reveals dysregulation of innate immune response genes and neuronal activity-dependent genes in autism (2014) · cites this paper as [45]
Self-check
Percentages, sums and reported differences re-computed from the paper’s own numbers.
The self-check needs the paper’s full text.
Citations
Cites
Robinson, M. D., McCarthy, D. J., & Smyth, G. K. (2010) · Bioinformatics · doi:10.1093/bioinformatics/btp616 · Cited by 41,364
Ultrafast and memory-efficient alignment of short DNA sequences to the human genome.
Langmead, B., Trapnell, C., Pop, M., & Salzberg, S. L. (2009) · Genome Biology · doi:10.1186/gb-2009-10-3-r25 · Cited by 21,849
Differential expression analysis for sequence count data
Anders, S., & Huber, W. (2010) · Genome Biology · doi:10.1186/gb-2010-11-10-r106 · Cited by 15,581
Trapnell, C., Williams, B. A., Pertea, G., Mortazavi, A., Kwan, G., van Baren, M. J., Salzberg, S. L., Wold, B. J., & Pachter, L. (2010) · Nature Biotechnology · doi:10.1038/nbt.1621 · Cited by 15,556
Mapping and quantifying mammalian transcriptomes by RNA-Seq
Mortazavi, A., Williams, B. A., McCue, K., Schaeffer, L., & Wold, B. (2008) · Nature Methods · doi:10.1038/nmeth.1226 · Cited by 13,696
RNA-Seq: a revolutionary tool for transcriptomics
Wang, Z., Gerstein, M., & Snyder, M. (2009) · Nature Reviews Genetics · doi:10.1038/nrg2484 · Cited by 13,174
Bolstad, B. M., Irizarry, R. A., Åstrand, M., & Speed, T. P. (2003) · Bioinformatics · doi:10.1093/bioinformatics/19.2.185 · Cited by 8,328
Self-citationA scaling normalization method for differential expression analysis of RNA-seq data
Robinson, M. D., & Oshlack, A. (2010) · Genome Biology · doi:10.1186/gb-2010-11-3-r25 · Cited by 7,876
The International HapMap Project
†The International HapMap Consortium, Genotyping centres: Baylor College of Medicine and ParAllele BioScience, Gibbs, R. A., Belmont, J. W., Hardenbol, P., Willis, T. D., Yu, F., Chinese HapMap Consortium, Yang, H., Ch'ang, L.-Y., et al. (2003) · Nature · doi:10.1038/nature02168 · Cited by 6,057
McCarthy, D. J., Chen, Y., & Smyth, G. K. (2012) · Nucleic Acids Research · doi:10.1093/nar/gks042 · Cited by 5,195
Research works printed but not linked: 1
- 2011, SUPPL, 1), D800
Cited by
Sorted by citations
Items 601–617 of 617
Bergsagel, P. L., Wiedmeier-Nutor, J. E., Riggs, D. L., Stein, C. K., Mangalaparthi, K. K., Kandasamy, R. K., Brown, S., Franke, K., Shotts, Y., Aguirre, J. F., et al. (2026) · Research Square · doi:10.21203/rs.3.rs-9003051/v1
Alwahaishi, S. S., & Nisar, H. (2026) · Journal of King Saud University - Science · doi:10.25259/jksus_1217_2025
Nisar, H., Sahibzada, K. I., Khan, A., Alwahaishi, S. S., & Agouni, A. (2026) · Journal of Molecular Graphics and Modelling · doi:10.1016/j.jmgm.2026.109357
Etude des polymorphismes altérant la régulation de l'expression des gènes chez le bovin
Guillocheau, G. (2018) · theses.fr (ABES) · doi:10.70675/82e19bd8z026ez4dabza0b6z3474c50172bc
Qi, L., Bertucci, T. B., Borden, S. M., Arduini, B. L., Lotz, S., Bowles, K. R., Goate, A., Karch, C. M. M., Temple, S., & Geschwind, D. H. (2026) · SSRN Electronic Journal · doi:10.64898/2026.04.29.721747
Beckhove, P., Chen, C.-Y., Klug, F., Wong, S.-H., Sanna, F. C., Pinto, S., Wurzel, A., Yamano, T., Riegel, D., Delacher, M., et al. (2026) · Research Square · doi:10.21203/rs.3.rs-9853026/v1
A Network-Guided Modular Framework for drug response prediction in acute myeloid leukemia
Wu, Y., Wang, Y., Zhao, W., & Gao, J. (2026) · Computational Biology and Chemistry · doi:10.1016/j.compbiolchem.2026.109355
Zinc-dependent turnover of ZIP3 transporter mRNA by trypanosome ZNK1
Leão, T., Trenaman, A., Tinti, M., Ruiz, G. B., Viegas, I. J., Figueiredo, L. M., Duarte, M., Tomás, A. M., & Horn, D. (2026) · Nucleic Acids Research · doi:10.1093/nar/gkag877
Weitzman, S. A., Orrick, J., Fulton‐Howard, B., Renton, A. E., Fridrikh, M., McKetney, J., Dixon, G., Qi, L., Labrie‐Cleary, C., Rizzi, L., et al. (2026) · Neuron · doi:10.1016/j.neuron.2026.09.008 · Cited by 1
Comparative lifespan trajectories of brain energy metabolism in human and macaque
Pourmajidian, M., Misic, B., & Dagher, A. (2026) · Appetite · doi:10.1016/j.appet.2026.108800
Qi, L., Bertucci, T. B., Borden, S. M., Arduini, B. L., Lotz, S., Bowles, K. R., Goate, A., Karch, C. M. M., Temple, S., & Geschwind, D. H. (2026) · Neuron · doi:10.1016/j.neuron.2026.09.022
Paniagua, A., Jetzinger, F., Tarazona, S., & Conesa, A. (2026) · bioRxiv (Cold Spring Harbor Laboratory) · doi:10.64898/2026.10.10.757893
Swindell, W. R., Ali, A. T., Iacoangeli, A., & Bhai, S. F. (2026) · Brain Sciences · doi:10.3390/brainsci16101120
Kennedy, R. (2024) · ImmPort · doi:10.21430/m3iim8aers
Zhuang, Y.-S., Gao, Y.-Y., Zhang, Z., Wang, Z.-P., Liu, J.-J., Zhang, L., Bateer, S., & Zhang, L.-Q. (2026) · International Journal of Molecular Sciences · doi:10.3390/ijms27219606
YAP Partially Reprograms Chromatin Accessibility to Directly Induce Adult Cardiogenesis In Vivo
Monroe, T. O., Hill, M. C., Morikawa, Y., Leach, J. P., Heallen, T., Cao, S., Krijger, P. H. L., de Laat, W., Wehrens, X. H. T., Rodney, G. G., et al. (2019) · Developmental Cell · doi:10.1016/j.devcel.2019.01.017 · Cited by 289
Metadata
- Authors
- Hansen, K. D., Irizarry, R. A., & WU, Z.
- Affiliations
- Johns Hopkins University (US)
- Brown University (US)
- Corresponding author
- WU, Z.
- Venue
- Biostatistics
- Publisher
- Oxford University Press (OUP)
- Published
- 2012-01-27
- Volume
- 13
- Issue
- 2
- Pages
- 204-216
- ISSN
- 1465-4644 (ISSN-L)
- 1468-4357
- PMC
- PMC3297825
- OpenAlex
- W2170219300
- Cited by
- 607
- References
- 38
- Citations by year
- 2026: 25 · 2025: 42 · 2024: 40 · 2023: 38 · 2022: 51 · 2021: 64 · 2020: 53 · 2019: 50 · 2018: 38 · 2017: 39 · 2016: 54 · 2015: 21 · 2014: 39 · 2013: 31 · 2012: 21
- FWCI
- 14.39
- Type
- journal article
- Language
- en
- Open access
- hybrid
- doi.org
- Licence
- cc-by-nc
- Locations
- Biostatistics (publishedVersion, cc-by-nc)
- Europe PMC (PubMed Central) (publishedVersion, cc-by-nc)
- PubMed Central (publishedVersion, cc-by-nc)
- PubMed (publishedVersion)
- Collection of Biostatistics Research Archive (submittedVersion)
- Funders
- National Science Foundation (1054905)
- University of Memphis
- National Institutes of Health
- National Human Genome Research Institute (R01HG004059, R01HG005220)
- Topics
- Life Sciences › Biochemistry, Genetics and Molecular Biology › Molecular Biology › Gene expression and cancer classification
- Life Sciences › Biochemistry, Genetics and Molecular Biology › Molecular Biology › Genomics and Phylogenetic Studies
- Life Sciences › Biochemistry, Genetics and Molecular Biology › Molecular Biology › Single-cell and spatial transcriptomics
- Keywords
- RNA-seq, gene expression normalization, GC content bias, technical variability, false positives, quantile normalization, microarray comparison, data distortion
- MeSH terms
- Algorithms, Analysis of Variance, Base Composition, Humans, Sequence Analysis, RNA, Oligonucleotide Array Sequence Analysis, Gene Expression Profiling, Databases, Nucleic Acid, Biostatistics, High-Throughput Nucleotide Sequencing
About these checks
Registry, retraction, Cites and statistics results are computed, not judged, with one exception: a printed reference that no index lists is read once by a model before it counts as a citation error. Claims are extracted by a model and kept only when their quote appears verbatim in the text; each cited source is then checked, with a model’s help, for whether it says what the claim relies on. Those verdicts can be wrong — read the claim’s quote and the cited source before relying on one.
Statistics and arithmetic are recomputed, not judged.
Confidence bands are shown only for fields calibrated on our annotated test set. None is calibrated yet, so no band is shown.
What counts as a claim ›How we measure confidence ›How we check this ›
Are you an author, or do you see a problem with this page? Request a review
