

The DOI matches its Crossref record; 55 of the 56 references it cites were found in a registry or an index.
TDP-43 real-time quaking induced conversion reaction optimization and detection of seeding activity in CSF of amyotrophic lateral sclerosis and frontotemporal dementia patients
Open accessAbstract
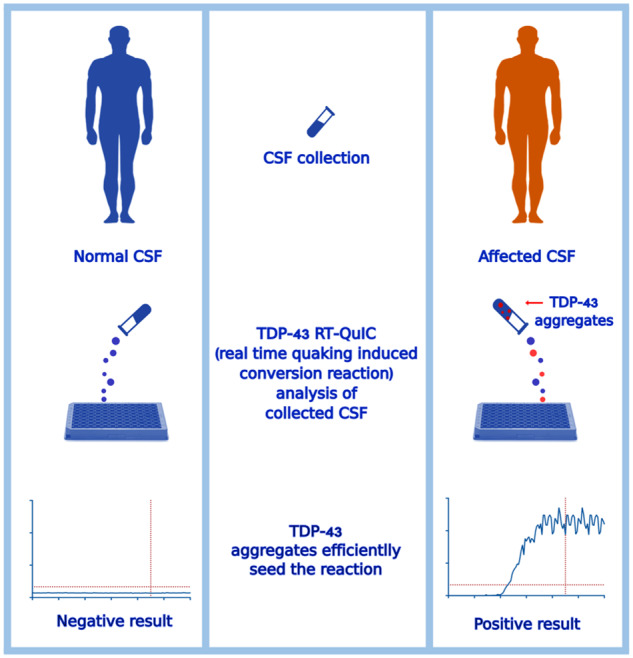
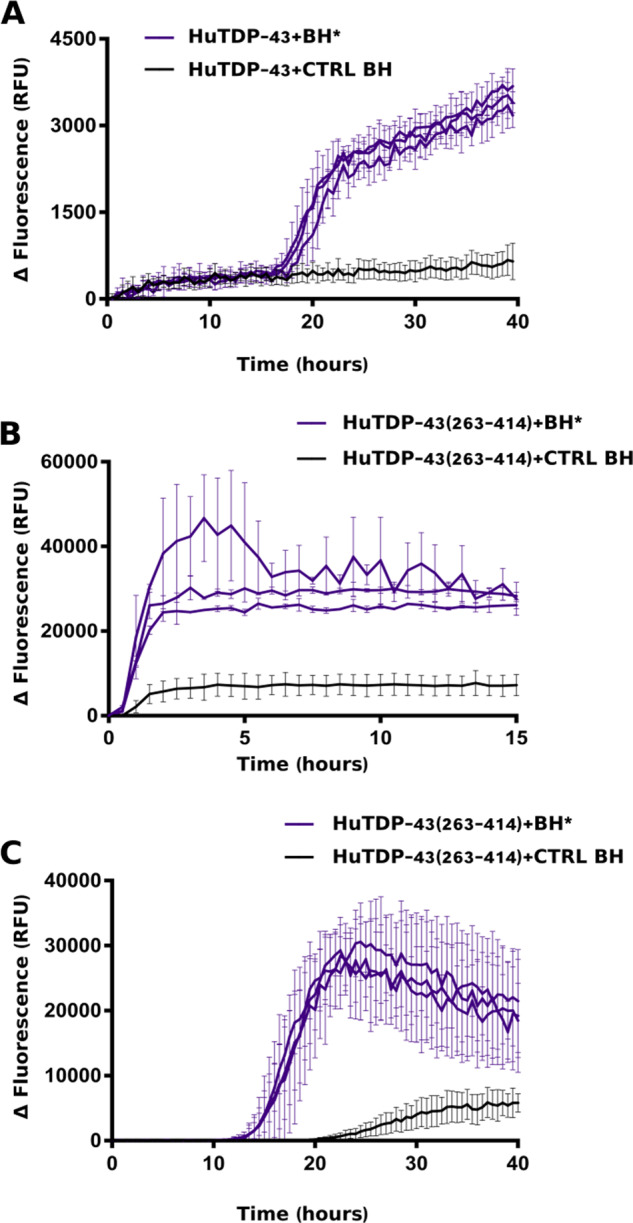
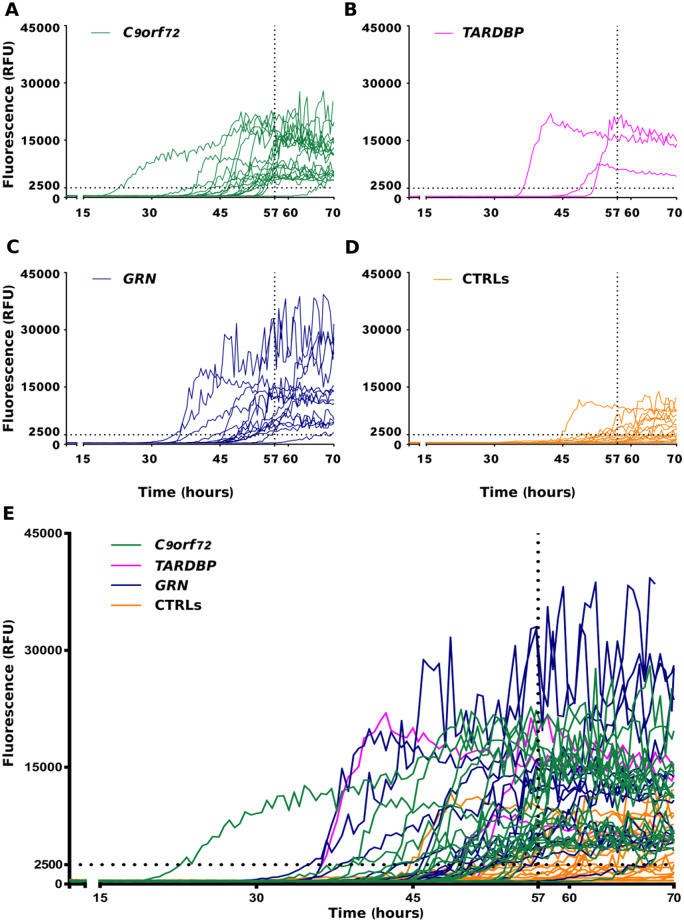
The pathological deposition of the transactive response DNA-binding protein of 43 kDa occurs in the majority (∼97%) of amyotrophic lateral sclerosis and in around 45% of frontotemporal lobar degeneration cases. Amyotrophic lateral sclerosis and frontotemporal lobar degeneration clinically overlap, presenting a continuum of phenotypes. Both amyotrophic lateral sclerosis and frontotemporal lobar degeneration lack treatments capable of interfering with the underlying pathological process and early detection of transactive response DNA-binding protein of 43 kDa pathology would facilitate the development of disease-modifying drugs. The real-time quaking-induced conversion reaction showed the ability to detect prions in several peripheral tissues of patients with different forms of prion and prion-like diseases. Despite transactive response DNA-binding protein of 43 kDa displays prion-like properties, to date the real-time quaking-induced conversion reaction technology has not yet been adapted to this protein. The aim of this study was to adapt the real-time quaking-induced conversion reaction technique for the transactive response DNA-binding protein of 43 kDa substrate and to exploit the intrinsic ability of this technology to amplify minute amount of mis-folded proteins for the detection of pathological transactive response DNA-binding protein of 43 kDa species in the cerebrospinal fluid of amyotrophic lateral sclerosis and frontotemporal lobar degeneration patients. We first optimized the technique with synthetic transactive response DNA-binding protein of 43 kDa–pre-formed aggregates and with autopsy-verified brain homogenate samples and subsequently analysed CSF samples from amyotrophic lateral sclerosis and frontotemporal lobar degeneration patients and controls. Transactive response DNA-binding protein of 43 kDa real-time quaking-induced conversion reaction was able to detect as little as 15 pg of transactive response DNA-binding protein of 43 kDa aggregates, discriminating between a cohort of patients affected by amyotrophic lateral sclerosis and frontotemporal lobar degeneration and age-matched controls with a total sensitivity of 94% and a specificity of 85%. Our data give a proof-of-concept that transactive response DNA-binding protein of 43 kDa is a suitable substrate for the real-time quaking-induced conversion reaction. Transactive response DNA-binding protein of 43 kDa real-time quaking-induced conversion reaction could be an innovative and useful tool for diagnosis and drug development in amyotrophic lateral sclerosis and frontotemporal lobar degeneration. The cerebrospinal fluid detection of transactive response DNA-binding protein of 43 kDa pathological aggregates may be exploited as a disease biomarker for amyotrophic lateral sclerosis and frontotemporal lobar degeneration patients.
Overview
The claims and statistics of this paper haven’t been checked yet.
Run the check — free, no account needed. It reads the open-access text and checks the sources it cites.
Integrity signals
Registry
Cites
Statistics
Figures



Verification
Claims the paper makes
The claims and statistics of this paper haven’t been checked yet.
Run the check — free, no account needed. It reads the open-access text and checks the sources it cites.
Claims other papers make about this one
Each is checked against this paper’s own text: does it say what the citing paper says it does?
In the citing paper
“A recent study using real time quaking‐induced conversion assay, a test based on the amplification of misfolded proteins and used for detection of prion proteins, showed in vitro TDP‐43 aggregate formation in CSF.”
From New developments of biofluid‐based biomarkers for routine diagnosis and disease trajectories in frontotemporal dementia (2022) · cites this paper as [100]
In the citing paper
“In a recent proof‐of‐concept small clinical study this assay discriminated FTD and ALS patients from controls with 94% sensitivity and 85% specificity.”
From New developments of biofluid‐based biomarkers for routine diagnosis and disease trajectories in frontotemporal dementia (2022) · cites this paper as [100]
In the citing paper
“Diagnosis is typically delayed for up to 6 years. 100”
From New developments of biofluid‐based biomarkers for routine diagnosis and disease trajectories in frontotemporal dementia (2022) · cites this paper as [100]
Self-check
Percentages, sums and reported differences re-computed from the paper’s own numbers.
The self-check needs the paper’s full text.
Citations
Cites
McKhann, G. M., Knopman, D. S., Chertkow, H., Hyman, B. T., Jack, C. R., Kawas, C. H., Klunk, W. E., Koroshetz, W. J., Manly, J. J., Mayeux, R., et al. (2011) · Alzheimer's & Dementia · doi:10.1016/j.jalz.2011.03.005 · Cited by 18,657
ggplot2: Elegant Graphics for Data Analysis
Wickham, H. (2009) · doi:10.1007/978-0-387-98141-3 · Cited by 14,447
Ubiquitinated TDP-43 in Frontotemporal Lobar Degeneration and Amyotrophic Lateral Sclerosis
Neumann, M., Sampathu, D. M., Kwong, L. K., Truax, A. C., Micsenyi, M. C., Chou, T. T., Bruce, J., Schuck, T., Grossman, M., Clark, C. M., et al. (2006) · Science · doi:10.1126/science.1134108 · Cited by 6,576
El Escorial revisited: revised criteria for the diagnosis of amyotrophic lateral sclerosis
Brooks, B. R., Miller, R. G., Swash, M., & Munsat, T. L. (2000) · Amyotrophic Lateral Sclerosis and Other Motor Neuron Disorders · doi:10.1080/146608200300079536 · Cited by 5,433
Sensitivity of revised diagnostic criteria for the behavioural variant of frontotemporal dementia
Rascovsky, K., Hodges, J. R., Knopman, D., Mendez, M. F., Kramer, J. H., Neuhaus, J., van Swieten, J. C., Seelaar, H., Dopper, E. G. P., Onyike, C. U., et al. (2011) · Brain · doi:10.1093/brain/awr179 · Cited by 5,221
Classification of primary progressive aphasia and its variants
Gorno-Tempini, M. L., Hillis, A. E., Weintraub, S., Kertesz, A., Mendez, M., Cappa, S. F., Ogar, J. M., Rohrer, J. D., Black, S., Boeve, B. F., et al. (2011) · Neurology · doi:10.1212/wnl.0b013e31821103e6 · Cited by 5,141
Clinical and biomarker changes in dominantly inherited Alzheimer's disease
Bateman, R. J., Xiong, C., Benzinger, T. L. S., Fagan, A. M., Goate, A., Fox, N. C., Marcus, D. S., Cairns, N. J., Xie, X., Blazey, T. M., et al. (2012) · New England Journal of Medicine · doi:10.1056/nejmoa1202753 · Cited by 3,814
Appelhof, B., Bakker, C., Van Duinen-van den Ijssel, J. C. L., Zwijsen, S. A., Smalbrugge, M., Verhey, F. R. J., de Vugt, M. E., Zuidema, S. U., & Koopmans, R. T. C. M. (2017) · Dementia and Geriatric Cognitive Disorders · doi:10.1159/000477087 · Cited by 2,760
Arai, T., Hasegawa, M., Akiyama, H., Ikeda, K., Nonaka, T., Mori, H., Mann, D., Tsuchiya, K., Yoshida, M., Hashizume, Y., et al. (2006) · Biochemical and Biophysical Research Communications · doi:10.1016/j.bbrc.2006.10.093 · Cited by 2,732
Qualitative Assessment of Verbal Fluency Performance in Frontotemporal Dementia
van den Berg, E., Jiskoot, L. C., Grosveld, M. J. H., van Swieten, J. C., & Papma, J. M. (2017) · Dementia and Geriatric Cognitive Disorders · doi:10.1159/000477538 · Cited by 2,046
Cited by
Plasma extracellular vesicle tau and TDP-43 as diagnostic biomarkers in FTD and ALS
(2024) · doi:10.1038/s41591-024-02937-4 · Cited by 217
Boeve, B. F., Boxer, A. L., Kumfor, F., Pijnenburg, Y., & Rohrer, J. D. (2022) · The Lancet Neurology · doi:10.1016/s1474-4422(21)00341-0 · Cited by 218
Designing the next-generation clinical care pathway for Alzheimer’s disease
Hampel, H., Au, R., Mattke, S., van der Flier, W. M., Aisen, P., Apostolova, L., Chen, C., Cho, M., De Santi, S., Gao, P., et al. (2022) · Nature Aging · doi:10.1038/s43587-022-00269-x · Cited by 191
Frontotemporal lobar degeneration
Grossman, M., Seeley, W. W., Boxer, A. L., Hillis, A. E., Knopman, D. S., Ljubenov, P. A., Miller, B., Piguet, O., Rademakers, R., Whitwell, J. L., et al. (2023) · Nature Reviews Disease Primers · doi:10.1038/s41572-023-00447-0 · Cited by 178
Frontotemporal Dementia, Where Do We Stand? A Narrative Review
Antonioni, A., Raho, E. M., Lopriore, P., Pace, A. P., Latino, R. R., Assogna, M., Mancuso, M., Gragnaniello, D., Granieri, E., Pugliatti, M., et al. (2023) · International Journal of Molecular Sciences · doi:10.3390/ijms241411732 · Cited by 145
Metadata
- Authors
- Scialò, C., Tran, T. H., Salzano, G., Novi, G., Caponnetto, C., Chiò, A., Calvo, A., Canosa, A., Moda, F., Caroppo, P., Silani, V., Ticozzi, N., Ratti, A., Borroni, B., Benussi, L., Ghidoni, R., Furlanis, G., Manganotti, P., Senigagliesi, B., Parisse, P., Brasselet, R., Buratti, E., & Legname, G.
- Affiliations
- Scuola Internazionale Superiore di Studi Avanzati (IT)
- Ospedale Policlinico San Martino (IT)
- University of Turin (IT)
- Fondazione IRCCS Istituto Neurologico Carlo Besta (IT)
- University of Milan (IT)
- University of Brescia (IT)
- Centro San Giovanni di Dio Fatebenefratelli (IT)
- University of Trieste (IT)
- Elettra-Sincrotrone Trieste S.C.p.A. (IT)
- International Centre for Genetic Engineering and Biotechnology (IT)
- Corresponding author
- Legname, Giuseppe
- ORCID
- Scialò, Carlo
- Tran, Thanh Hoa
- Salzano, Giulia
- Novi, Giovanni
- Caponnetto, Claudia
- Chiò, Adriano
- Calvo, Andrea
- Canosa, Antonio
- Moda, Fabio
- Caroppo, Paola
- Silani, Vincenzo
- Ticozzi, Nicola
- Ratti, Antonia
- Borroni, Barbara
- Benussi, Luisa
- Ghidoni, Roberta
- Furlanis, Giovanni
- Manganotti, Paolo
- Senigagliesi, Beatrice
- Parisse, Pietro
- Brasselet, Romain
- Buratti, Emanuele
- Legname, Giuseppe
- Venue
- Brain Communications
- Publisher
- Oxford University Press (OUP)
- Published
- 2020
- Volume
- 2
- Issue
- 2
- Pages
- fcaa142-fcaa142
- ISSN
- 2632-1297 (ISSN-L)
- PMC
- PMC7566418
- OpenAlex
- W3086212084
- Cited by
- 123
- References
- 56
- Citations by year
- 2026: 22 · 2025: 35 · 2024: 14 · 2023: 19 · 2022: 19 · 2021: 12 · 2020: 2
- FWCI
- 5.63
- Type
- journal article
- Language
- en
- Open access
- gold
- doi.org
- Licence
- Locations
- Brain Communications (publishedVersion, cc-by-nc)
- PubMed Central (publishedVersion, cc-by-nc)
- PubMed (publishedVersion)
- Archivio Istituzionale della Ricerca (Universita Degli Studi Di Milano) (submittedVersion, cc-by)
- Institutional Research Information System University of Turin (University of Turin) (submittedVersion, other-oa)
- SDL (submittedVersion)
- Institutional Research Information System (Università degli Studi di Brescia) (submittedVersion)
- Funders
- Scuola Internazionale Superiore di Studi Avanzati intramural
- Italian Ministry of Health (GR-2013-02355724, GR-2013-02355764)
- Frontotemporal Degeneration Susan Marcus Memorial
- Clinical Research Pilot
- Topics
- Health Sciences › Medicine › Clinical Neurology › Amyotrophic Lateral Sclerosis Research
- Life Sciences › Biochemistry, Genetics and Molecular Biology › Molecular Biology › Prion Diseases and Protein Misfolding
- Life Sciences › Neuroscience › Cellular and Molecular Neuroscience › Alzheimer's disease research and treatments
- Keywords
- TDP-43, amyotrophic lateral sclerosis, frontotemporal lobar degeneration, cerebrospinal fluid biomarkers, seeding activity, prion-like proteins, protein misfolding, disease diagnosis, sensitivity and specificity, brain homogenate
About these checks
Registry, retraction, Cites and statistics results are computed, not judged, with one exception: a printed reference that no index lists is read once by a model before it counts as a citation error. Claims are extracted by a model and kept only when their quote appears verbatim in the text; each cited source is then checked, with a model’s help, for whether it says what the claim relies on. Those verdicts can be wrong — read the claim’s quote and the cited source before relying on one.
Statistics and arithmetic are recomputed, not judged.
Confidence bands are shown only for fields calibrated on our annotated test set. None is calibrated yet, so no band is shown.
What counts as a claim ›How we measure confidence ›How we check this ›
Are you an author, or do you see a problem with this page? Request a review
How to cite
Cite CoChat for the checks on this page, and the paper for its own findings.
- This page
- CoChat. (2026). Citation check: TDP-43 real-time quaking induced conversion reaction optimization and detection of seeding activity in CSF of amyotrophic lateral sclerosis and frontotemporal dementia patients. https://app.cochat.ai/papers/10.1093/braincomms/fcaa142
- The paper
- Scialò, C., Tran, T. H., Salzano, G., Novi, G., Caponnetto, C., Chiò, A., Calvo, A., Canosa, A., Moda, F., Caroppo, P., Silani, V., Ticozzi, N., Ratti, A., Borroni, B., Benussi, L., Ghidoni, R., Furlanis, G., Manganotti, P., Senigagliesi, B., . . . Legname, G. (2020). TDP-43 real-time quaking induced conversion reaction optimization and detection of seeding activity in CSF of amyotrophic lateral sclerosis and frontotemporal dementia patients. Brain Communications. https://doi.org/10.1093/braincomms/fcaa142
Data sources
Bibliographic data: Semantic Scholar, OpenAlex, Crossref.
Contains information from the Semantic Scholar Academic Graph Datasets, made available under the ODC Attribution License (ODC-BY 1.0).
Semantic Scholar’s data is described in: Kinney, R., et al. (2023). The Semantic Scholar Open Data Platform. arXiv:2301.10140.
