CoChat

Objective Morphological Classification of Neocortical Pyramidal Cells

Open access

Published version of a preprint

The DOI matches its Crossref record; 88 of the 88 references it cites were found in a registry or an index.

Abstract

A consensus on the number of morphologically different types of pyramidal cells (PCs) in the neocortex has not yet been reached, despite over a century of anatomical studies, due to the lack of agreement on the subjective classifications of neuron types, which is based on expert analyses of neuronal morphologies. Even for neurons that are visually distinguishable, there is no common ground to consistently define morphological types. The objective classification of PCs can be achieved with methods from algebraic topology, and the dendritic arborization is sufficient for the reliable identification of distinct types of cortical PCs. Therefore, we objectively identify 17 types of PCs in the rat somatosensory cortex. In addition, we provide a solution to the challenging problem of whether 2 similar neurons belong to different types or to a continuum of the same type. Our topological classification does not require expert input, is stable, and helps settle the long-standing debate on whether cell-types are discrete or continuous morphological variations of each other.

Overview

The claims and statistics of this paper haven’t been checked yet.

Free: it reads the open-access text and checks the first 5 claims that cite a source we can check. Create a free account to check every claim.

A few free checks a day · papers already verified open instantly · results are public

Integrity signals

Registry

Crossref · 10.1093/cercor/bhy339

Cites

88 of 88 references verified0 citation errors · 0 not checkable

Statistics

Figures

Figure 1. Schematic representation of all PC types/subtypes in Layers 2–6. Layer 2 consists of 2 main types of PCs, the L2_IPC (inverted PCs) and the L2_TPC (tufted PCs) which can be divided into 2 subtypes (_A: large tufted PCs, and _B: early bifurcating PCs). Layer 3 has one major type L3_TPC and 2 subtypes of PCs (_A – large tufted PCs, and _C – small tufted PCs). Layer 4 PCs are grouped into 3 types (L4_TPC; tufted PCs, L4_UPC; untufted PCs and L4_SSC; spiny stellate cells). Layer 5 PCs consist of 2 major types (L5_TPC; tufted PCs and L5_UPC; untufted PCs) and 2 subtypes of L5_TPC (_A – large tufted PCs, also known as thick tufted PCs and _C – small tufted PCs, also known as slender tufted). Layer 6 consists of 5 major PC types: L6_BPC (bitufted PCs), L6_IPC (inverted PCs), L6_TPC (tufted PCs), L6_UPC (untufted PCs) and L6_HPC (horizontal PCs). Also, 2 subtypes of L6_TPC are identified (_A: large tufted PCs, and _C: small tufted PCs, also known as narrow tufted).
Figure 1. Schematic representation of all PC types/subtypes in Layers 2–6. Layer 2 consists of 2 main types of PCs, the L2_IPC (inverted PCs) and the L2_TPC (tufted PCs) which can be divided into 2 subtypes (_A: large tufted PCs, and _B: early bifurcating PCs). Layer 3 has one major type L3_TPC and 2 subtypes of PCs (_A – large tufted PCs, and _C – small tufted PCs). Layer 4 PCs are grouped into 3 types (L4_TPC; tufted PCs, L4_UPC; untufted PCs and L4_SSC; spiny stellate cells). Layer 5 PCs consist of 2 major types (L5_TPC; tufted PCs and L5_UPC; untufted PCs) and 2 subtypes of L5_TPC (_A – large tufted PCs, also known as thick tufted PCs and _C – small tufted PCs, also known as slender tufted). Layer 6 consists of 5 major PC types: L6_BPC (bitufted PCs), L6_IPC (inverted PCs), L6_TPC (tufted PCs), L6_UPC (untufted PCs) and L6_HPC (horizontal PCs). Also, 2 subtypes of L6_TPC are identified (_A: large tufted PCs, and _C: small tufted PCs, also known as narrow tufted).CC BY-NC · PubMed Central
Figure 2. Three PC types/subtypes in Layer 2. (A) Exemplar reconstructed morphologies of PC dendrites: the apical dendrite is presented in purple and the basal dendrites in red. (B) Polar plot analysis of dendritic branches (apical in purple, basal in red). Tufted PCs are oriented towards the pia and the inverted PCs in the opposite direction as they project towards the white matter. (C) The Topological Morphology Descriptor (TMD) of apical dendrites characterizes the spatial distribution of branches with respect to the radial distance from the neuronal soma. The average persistence images (per type of PC) illustrate the average dendritic arbor density around the soma. The spatial distribution of L2_IPC apical branches follow the direction opposite to the pia, while L2_TPC_A, which head towards the pia, present a larger density of branches for larger radial distances compared with L2_TPC_B.
Figure 2. Three PC types/subtypes in Layer 2. (A) Exemplar reconstructed morphologies of PC dendrites: the apical dendrite is presented in purple and the basal dendrites in red. (B) Polar plot analysis of dendritic branches (apical in purple, basal in red). Tufted PCs are oriented towards the pia and the inverted PCs in the opposite direction as they project towards the white matter. (C) The Topological Morphology Descriptor (TMD) of apical dendrites characterizes the spatial distribution of branches with respect to the radial distance from the neuronal soma. The average persistence images (per type of PC) illustrate the average dendritic arbor density around the soma. The spatial distribution of L2_IPC apical branches follow the direction opposite to the pia, while L2_TPC_A, which head towards the pia, present a larger density of branches for larger radial distances compared with L2_TPC_B.CC BY-NC · PubMed Central
Figure 3. Two PC types/subtypes in Layer 3. (A) Exemplar reconstructed morphologies. (B) Polar plot analysis of dendritic branches (apical in purple, basal in red). (C) The Topological Morphology Descriptor (TMD) of apical dendrites characterizes the spatial distribution of branches with respect to the radial distance from the neuronal soma. The average persistence images (per type of PC) illustrate the average dendritic arbor density around the soma. L3_TPC_C apical dendrites present a lower density of branches both close to the soma and at larger radial distances. L3_TPC_A are denser and extend to larger radial distances.
Figure 3. Two PC types/subtypes in Layer 3. (A) Exemplar reconstructed morphologies. (B) Polar plot analysis of dendritic branches (apical in purple, basal in red). (C) The Topological Morphology Descriptor (TMD) of apical dendrites characterizes the spatial distribution of branches with respect to the radial distance from the neuronal soma. The average persistence images (per type of PC) illustrate the average dendritic arbor density around the soma. L3_TPC_C apical dendrites present a lower density of branches both close to the soma and at larger radial distances. L3_TPC_A are denser and extend to larger radial distances.CC BY-NC · PubMed Central
Figure 4. Reclassification of Layer 3 PCs. (A) Curated renderings of L3_TPC_A and L3_TPC_B selected morphologies as proposed by expert classification. (B) Curated renderings of L3_TPC_A and L3_TPC_B selected morphologies, after TMD-based reclassification. (C) The confusion matrix illustrates the large percentage of misclassified cells between the expert proposed subtypes, yielding a total accuracy of 86%. (D) The 2 subtypes are usually misclassified, as half of the L3_TPC_B are confused as L3_TPC_A. (E) The confusion matrix illustrates the clear separation of the 2 subtypes after the TMD-based reclassification and the improved accuracy of the classifier (97%). (F) The 2 subtypes are rarely misclassified, as almost all (~98%) of cells are unambiguously assigned into the 2 subtypes.
Figure 4. Reclassification of Layer 3 PCs. (A) Curated renderings of L3_TPC_A and L3_TPC_B selected morphologies as proposed by expert classification. (B) Curated renderings of L3_TPC_A and L3_TPC_B selected morphologies, after TMD-based reclassification. (C) The confusion matrix illustrates the large percentage of misclassified cells between the expert proposed subtypes, yielding a total accuracy of 86%. (D) The 2 subtypes are usually misclassified, as half of the L3_TPC_B are confused as L3_TPC_A. (E) The confusion matrix illustrates the clear separation of the 2 subtypes after the TMD-based reclassification and the improved accuracy of the classifier (97%). (F) The 2 subtypes are rarely misclassified, as almost all (~98%) of cells are unambiguously assigned into the 2 subtypes.CC BY-NC · PubMed Central
Figure 5. Three PC types/subtypes in Layer 4. (A) Exemplar reconstructed morphologies. (B) Polar plot analysis of dendritic branches (apical in purple, basal in red). The polar plots of all types are similar as they all project towards the pia, with the exception of L4_SSC which remain local. (C) The Topological Morphology Descriptor (TMD) of apical dendrites characterizes the spatial distribution of branches with respect to the radial distance from the neuronal soma. The average persistence images (per type of PC) illustrate the average dendritic arbor density around the soma. The apical dendrites of L4_TPC are the only ones that have a clearly defined tuft and are larger than both other types. L4_SSC are smaller than L4_UPC and their apical trees are similar to basal dendrites as they only extend to small radial distances.
Figure 5. Three PC types/subtypes in Layer 4. (A) Exemplar reconstructed morphologies. (B) Polar plot analysis of dendritic branches (apical in purple, basal in red). The polar plots of all types are similar as they all project towards the pia, with the exception of L4_SSC which remain local. (C) The Topological Morphology Descriptor (TMD) of apical dendrites characterizes the spatial distribution of branches with respect to the radial distance from the neuronal soma. The average persistence images (per type of PC) illustrate the average dendritic arbor density around the soma. The apical dendrites of L4_TPC are the only ones that have a clearly defined tuft and are larger than both other types. L4_SSC are smaller than L4_UPC and their apical trees are similar to basal dendrites as they only extend to small radial distances.CC BY-NC · PubMed Central
Figure 6. Three PC types/subtypes in Layer 5. (A) Exemplar reconstructed morphologies. (B) Polar plot analysis of dendritic branches (apical in purple, basal in red). The polar plots of all types are similar as they all project towards the pia. (C) The Topological Morphology Descriptor (TMD) of apical dendrites characterizes the spatial distribution of branches with respect to the radial distance from the neuronal soma. The average persistence images (per type of PC) illustrate the average dendritic arbor density around the soma. The apical dendrites of L5_TPC_A&B have a large tuft that extends to larger radial distances from the soma. L5_TPC_C similarly, present a tuft formation that is however smaller in size and extends to smaller radial distances. L5_UPC do not present a clear tuft but can also reach larger radial distances.
Figure 6. Three PC types/subtypes in Layer 5. (A) Exemplar reconstructed morphologies. (B) Polar plot analysis of dendritic branches (apical in purple, basal in red). The polar plots of all types are similar as they all project towards the pia. (C) The Topological Morphology Descriptor (TMD) of apical dendrites characterizes the spatial distribution of branches with respect to the radial distance from the neuronal soma. The average persistence images (per type of PC) illustrate the average dendritic arbor density around the soma. The apical dendrites of L5_TPC_A&B have a large tuft that extends to larger radial distances from the soma. L5_TPC_C similarly, present a tuft formation that is however smaller in size and extends to smaller radial distances. L5_UPC do not present a clear tuft but can also reach larger radial distances.CC BY-NC · PubMed Central
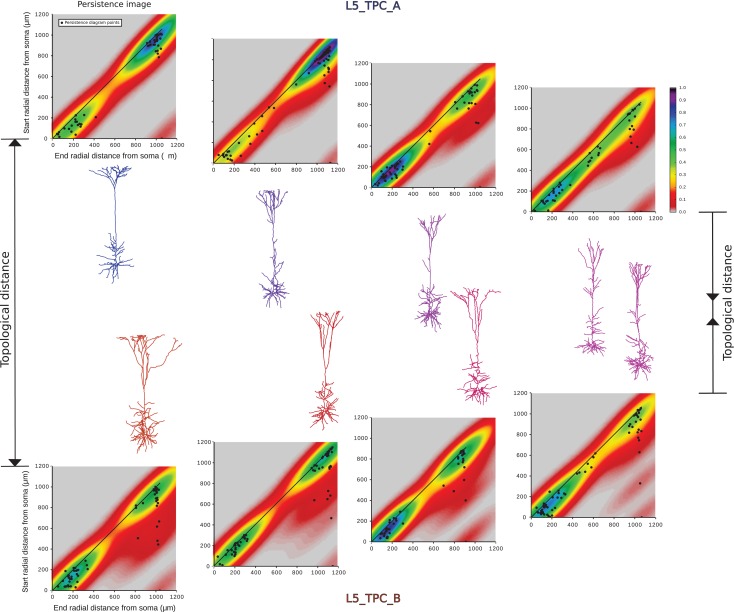
Figure 7. Convergence of subtypes L5TPC_A and B. Illustration of selected dendritic morphologies of L5_TPC_A (in blue) and L5_TPC_B (in red) of decreasing topological distance (from left to right). For border cases the 2 subtypes are very well separated (extreme left). The persistence images of all the presented apical trees are shown, and the points of the persistence diagrams for each apical tree are superimposed on the respective persistence images. However, as the topological distance decreases as the persistence images converge (left to right), and morphologies exhibit similar topological shapes (extreme right).
Figure 7. Convergence of subtypes L5TPC_A and B. Illustration of selected dendritic morphologies of L5_TPC_A (in blue) and L5_TPC_B (in red) of decreasing topological distance (from left to right). For border cases the 2 subtypes are very well separated (extreme left). The persistence images of all the presented apical trees are shown, and the points of the persistence diagrams for each apical tree are superimposed on the respective persistence images. However, as the topological distance decreases as the persistence images converge (left to right), and morphologies exhibit similar topological shapes (extreme right).CC BY-NC · PubMed Central
Figure 8. Six PC types/subtypes in Layer 6. (A) Exemplar reconstructed morphologies of (B). Polar plot analysis of dendritic branches (apical in purple, basal in red). The polar plots of L6_BPC and L6_IPC differ from other types that project towards the pia. Similarly, L6_HPC is the only type which presents almost symmetric polar plots due to their horizontal orientation. (C) The Topological Morphology Descriptor (TMD) of apical dendrites characterizes the spatial distribution of branches with respect to the radial distance from the soma. The average persistence images (per type of PC) illustrate the average dendritic arbor density around the soma. L6_BPC have 2 distinct apical trees, that extend to opposite directions. Apical dendrites of L6_IPCs project away from the pia, towards the white matter. L6_TPC_As form a large tuft at large radial distances from the soma, while L6_TPC_Cs form a narrow tuft usually in smaller radial distances. Apical dendrites of L6_UPCs do not form a clear tuft but extend to large radial distances. L6_HPC is unique to layer 6 and projects vertically within the layer.
Figure 8. Six PC types/subtypes in Layer 6. (A) Exemplar reconstructed morphologies of (B). Polar plot analysis of dendritic branches (apical in purple, basal in red). The polar plots of L6_BPC and L6_IPC differ from other types that project towards the pia. Similarly, L6_HPC is the only type which presents almost symmetric polar plots due to their horizontal orientation. (C) The Topological Morphology Descriptor (TMD) of apical dendrites characterizes the spatial distribution of branches with respect to the radial distance from the soma. The average persistence images (per type of PC) illustrate the average dendritic arbor density around the soma. L6_BPC have 2 distinct apical trees, that extend to opposite directions. Apical dendrites of L6_IPCs project away from the pia, towards the white matter. L6_TPC_As form a large tuft at large radial distances from the soma, while L6_TPC_Cs form a narrow tuft usually in smaller radial distances. Apical dendrites of L6_UPCs do not form a clear tuft but extend to large radial distances. L6_HPC is unique to layer 6 and projects vertically within the layer.CC BY-NC · PubMed Central
Figure 9. Summary of TMD-based classification of all cortical PCs. (A) The pie-chart shows the percentage of cells per type/subtypes of cortical PCs, in different colors. The color-code is arbitrarily chosen. (B) The confusion matrix illustrates the accuracy of the classification for the TMD-defined classes. The values on the diagonal show the percentage of cells for which the automatic and input labels agree and illustrate the accuracy of the classification (black – high accuracy; white – low accuracy). The perfect classification would have only black on the diagonal and white everywhere else.
Figure 9. Summary of TMD-based classification of all cortical PCs. (A) The pie-chart shows the percentage of cells per type/subtypes of cortical PCs, in different colors. The color-code is arbitrarily chosen. (B) The confusion matrix illustrates the accuracy of the classification for the TMD-defined classes. The values on the diagonal show the percentage of cells for which the automatic and input labels agree and illustrate the accuracy of the classification (black – high accuracy; white – low accuracy). The perfect classification would have only black on the diagonal and white everywhere else.CC BY-NC · PubMed Central
Figure 10. Overview of all cortical PCs types/subtypes. Renderings of dendrites and somata of all types/subtypes in order of appearance in the text. The color-code is arbitrarily chosen for consistency with Figure 8. Deeper layers express a larger diversity of PC types as the complexity of branching types increases from Layer 2 to Layer 6. The dendritic diameters have been scaled (×2) for better resolution of the dendritic morphologies.
Figure 10. Overview of all cortical PCs types/subtypes. Renderings of dendrites and somata of all types/subtypes in order of appearance in the text. The color-code is arbitrarily chosen for consistency with Figure 8. Deeper layers express a larger diversity of PC types as the complexity of branching types increases from Layer 2 to Layer 6. The dendritic diameters have been scaled (×2) for better resolution of the dendritic morphologies.CC BY-NC · PubMed Central

Verification

Claims the paper makes

The claims and statistics of this paper haven’t been checked yet.

Free: it reads the open-access text and checks the first 5 claims that cite a source we can check. Create a free account to check every claim.

A few free checks a day · papers already verified open instantly · results are public

Claims other papers make about this one

Each is checked against this paper’s own text: does it say what the citing paper says it does?

Self-check

Percentages, sums and reported differences re-computed from the paper’s own numbers.

The self-check needs the paper’s full text.

Citations

Cites

Show all 88 references

Cited by

See all 116

Metadata

Authors
Kanari, L., Ramaswamy, S., Shi, Y., Morand, S., Meystre, J., Perin, R., Abdellah, M., Wang, Y., Hess, K., & Markram, H.
Affiliations
  • École Polytechnique Fédérale de Lausanne (CH)
  • Allen Institute for Brain Science (US)
Corresponding author
  • Kanari, Lida
  • Markram, Henry
Venue
Cerebral Cortex
Published
2019-01-31
Volume
29
Issue
4
Pages
1719-1735
ISSN
  • 1047-3211 (ISSN-L)
  • 1460-2199
OpenAlex
W2911934184
Cited by
94
References
88
Citations by year
2026: 9 · 2025: 12 · 2024: 18 · 2023: 11 · 2022: 14 · 2021: 9 · 2020: 16 · 2019: 5
FWCI
5.33
Type
journal article
Language
en
Open access
Locations
  • Cerebral Cortex (publishedVersion, cc-by-nc)
  • bioRxiv (Cold Spring Harbor Laboratory) (acceptedVersion)
  • Europe PMC (PubMed Central) (publishedVersion, cc-by-nc)
  • PubMed Central (publishedVersion, cc-by-nc)
  • PubMed (publishedVersion)
  • Infoscience (Ecole Polytechnique Fédérale de Lausanne) (submittedVersion, cc-by-nc-nd)
Funders
  • European Union Seventh (604102)
  • HBP (720270)
  • HBP SGA1
  • National Natural Science Foundation (No. 31070951)
Topics
  • Life Sciences › Biochemistry, Genetics and Molecular Biology › Biophysics › Cell Image Analysis Techniques
  • Physical Sciences › Computer Science › Computational Theory and Mathematics › Topological and Geometric Data Analysis
  • Life Sciences › Neuroscience › Cognitive Neuroscience › Neural dynamics and brain function
Keywords
neocortical pyramidal cells, dendritic branching, algebraic topology, topological classification, somatosensory cortex, rats
MeSH terms
Supervised Machine Learning, Animals, Lysine, Pattern Recognition, Automated, Somatosensory Cortex, Pyramidal Cells, Neocortex, Imaging, Three-Dimensional, Rats

About these checks

Registry, retraction, Cites and statistics results are computed, not judged, with one exception: a printed reference that no index lists is read once by a model before it counts as a citation error. Claims are extracted by a model and kept only when their quote appears verbatim in the text; each cited source is then checked, with a model’s help, for whether it says what the claim relies on. Those verdicts can be wrong — read the claim’s quote and the cited source before relying on one.

Statistics and arithmetic are recomputed, not judged.

Confidence bands are shown only for fields calibrated on our annotated test set. None is calibrated yet, so no band is shown.

What counts as a claim ›How we measure confidence ›How we check this ›

Are you an author, or do you see a problem with this page? Request a review

How to cite

Cite CoChat for the checks on this page, and the paper for its own findings.

This page
CoChat. (2026). Citation check: Objective Morphological Classification of Neocortical Pyramidal Cells. https://app.cochat.ai/papers/10.1093/cercor/bhy339
The paper
Kanari, L., Ramaswamy, S., Shi, Y., Morand, S., Meystre, J., Perin, R., Abdellah, M., Wang, Y., Hess, K., & Markram, H. (2019). Objective Morphological Classification of Neocortical Pyramidal Cells. Cerebral Cortex. https://doi.org/10.1093/cercor/bhy339

Data sources

Bibliographic data: Semantic Scholar, OpenAlex, Crossref.

Contains information from the Semantic Scholar Academic Graph Datasets, made available under the ODC Attribution License (ODC-BY 1.0).

Semantic Scholar’s data is described in: Kinney, R., et al. (2023). The Semantic Scholar Open Data Platform. arXiv:2301.10140.