

Development and Validation of a Deep Learning–based Automatic Detection Algorithm for Active Pulmonary Tuberculosis on Chest Radiographs
Open accessThe DOI matches its Crossref record; 31 of the 31 references it cites were found in a registry or an index.
Abstract
Background: Detection of active pulmonary tuberculosis on chest radiographs (CRs) is critical for the diagnosis and screening of tuberculosis. An automated system may help streamline the tuberculosis screening process and improve diagnostic performance. Methods: We developed a deep learning–based automatic detection (DLAD) algorithm using 54c221 normal CRs and 6768 CRs with active pulmonary tuberculosis that were labeled and annotated by 13 board-certified radiologists. The performance of DLAD was validated using 6 external multicenter, multinational datasets. To compare the performances of DLAD with physicians, an observer performance test was conducted by 15 physicians including nonradiology physicians, board-certified radiologists, and thoracic radiologists. Image-wise classification and lesion-wise localization performances were measured using area under the receiver operating characteristic (ROC) curves and area under the alternative free-response ROC curves, respectively. Sensitivities and specificities of DLAD were calculated using 2 cutoffs (high sensitivity [98%] and high specificity [98%]) obtained through in-house validation. Results: DLAD demonstrated classification performance of 0.977–1.000 and localization performance of 0.973–1.000. Sensitivities and specificities for classification were 94.3%–100% and 91.1%–100% using the high-sensitivity cutoff and 84.1%–99.0% and 99.1%–100% using the high-specificity cutoff. DLAD showed significantly higher performance in both classification (0.993 vs 0.746–0.971) and localization (0.993 vs 0.664–0.925) compared to all groups of physicians. Conclusions: Our DLAD demonstrated excellent and consistent performance in the detection of active pulmonary tuberculosis on CR, outperforming physicians, including thoracic radiologists.
Overview
The claims and statistics of this paper haven’t been checked yet.
Free: it reads the open-access text and checks the first 5 claims that cite a source we can check. Create a free account to check every claim.
Integrity signals
Registry
Cites
Statistics
Figures
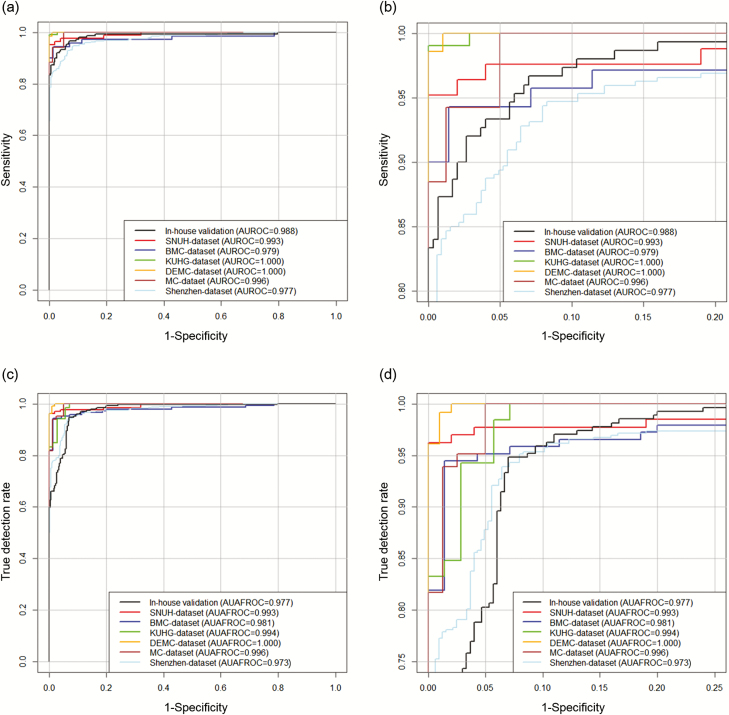
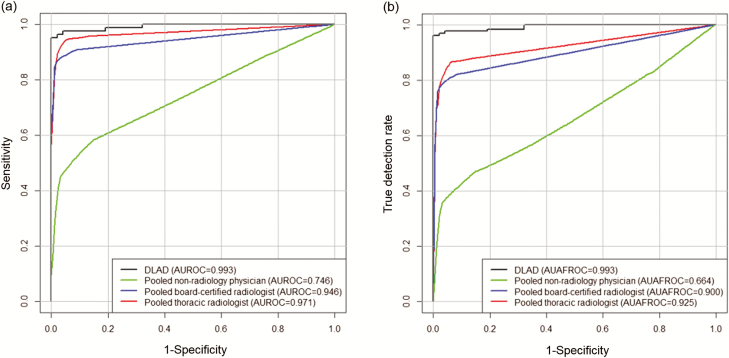
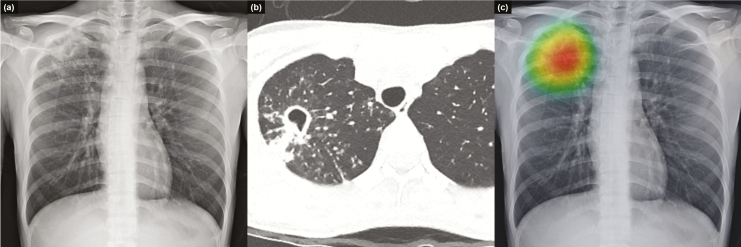
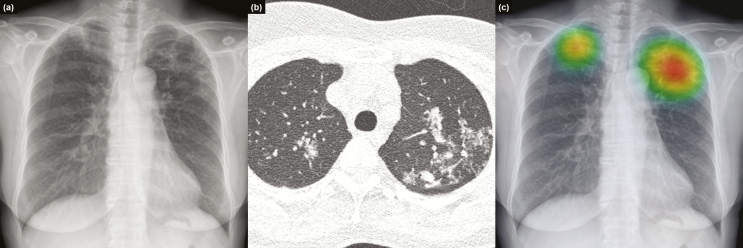
Verification
Claims the paper makes
The claims and statistics of this paper haven’t been checked yet.
Free: it reads the open-access text and checks the first 5 claims that cite a source we can check. Create a free account to check every claim.
Claims other papers make about this one
Each is checked against this paper’s own text: does it say what the citing paper says it does?
The cited source says what the claim attributes to it.
In the citing paper
“13 (refs. 63–75) studies validated algorithms on external data”
From Diagnostic accuracy of deep learning in medical imaging: a systematic review and meta-analysis (2021) · cites this paper as [67]
The cited source says what the claim attributes to it.
In the citing paper
“Twenty-one54,63–67,70,72,76–88 studies compared algorithm performance against healthcare professionals.”
From Diagnostic accuracy of deep learning in medical imaging: a systematic review and meta-analysis (2021) · cites this paper as [67]
Self-check
Percentages, sums and reported differences re-computed from the paper’s own numbers.
The self-check needs the paper’s full text.
Citations
Cites
R: A Language and Environment for Statistical Computing
R Core Team (2025) · doi:10.32614/r.manuals · Cited by 352,181
ImageNet classification with deep convolutional neural networks
Krizhevsky, A., Sutskever, I., & Hinton, G. E. (2017) · Communications of the ACM · doi:10.1145/3065386 · Cited by 112,155
A Simple Sequentially Rejective Multiple Test Procedure
(1979) · Scandinavian Journal of Statistics · doi:10.2307/4615733 · Cited by 21,526 · cited 1×
“Holm–Bonferroni methods were used to correct multiple comparisons [24].”
MethodDermatologist-level classification of skin cancer with deep neural networks
Esteva, A., Kuprel, B., Novoa, R. A., Ko, J., Swetter, S. M., Blau, H. M., & Thrun, S. (2017) · Nature · doi:10.1038/nature21056 · Cited by 14,362
Advances in Neural Information Processing Systems 25
Zhang, Y., Sutton, C. A., Storkey, A., & Zoubin Ghahramani, A. (2012) · Cited by 12,653
Gulshan, V., Peng, L., Coram, M., Stumpe, M. C., Wu, D., Narayanaswamy, A., Venugopalan, S., Widner, K., Madams, T., Cuadros, J., et al. (2016) · JAMA · doi:10.1001/jama.2016.17216 · Cited by 7,697
Lakhani, P., & Sundaram, B. (2017) · Radiology · doi:10.1148/radiol.2017162326 · Cited by 1,775
Samek, W., Wiegand, T., & Müller, K.-R. (2017) · arXiv · doi:10.48550/arxiv.1708.08296 · Cited by 1,080
Two public chest X-ray datasets for computer-aided screening of pulmonary diseases.
(2014) · PubMed Central · doi:10.3978/j.issn.2223-4292.2014.11.20 · Cited by 918
Dorfman, D. D., Berbaum, K. S., & Metz, C. E. (1992) · PubMed · Cited by 724
Automatic Tuberculosis Screening Using Chest Radiographs
Jaeger, S., Karargyris, A., Candemir, S., Folio, L., Siegelman, J., Callaghan, F., Xue, Z., Palaniappan, K., Singh, R. K., Antani, S., et al. (2014) · IEEE Transactions on Medical Imaging · doi:10.1109/tmi.2013.2284099 · Cited by 678
DORFMAN, D. D., BERBAUM, K. S., & METZ, C. E. (1992) · Investigative Radiology · doi:10.1097/00004424-199209000-00015 · Cited by 661
Nam, J. G., Park, S., Hwang, E. J., Lee, J. H., Jin, K.-N., Lim, K. Y., Vu, T. H., Sohn, J. H., Hwang, S., Goo, J. M., et al. (2019) · Radiology · doi:10.1148/radiol.2018180237 · Cited by 539
Self-citationSingle Reading with Computer-Aided Detection for Screening Mammography
Gilbert, F. J., Astley, S. M., Gillan, M. G. C., Agbaje, O. F., Wallis, M. G., James, J., Boggis, C. R. M., & Duffy, S. W. (2008) · New England Journal of Medicine · doi:10.1056/nejmoa0803545 · Cited by 296
Automatic Tuberculosis Screening using Chest Radiographs
Department of Electronics and Communication Engineering, V. T. M. T. D. R. D. S. E. C., Leopauline, S., Kalpana, R., Department of Electronics and Communication Engineering, V. T. M. T. D. R. D. S. E. C., Sharmila, P., & Department of Electronics and Communication Engineering, V. T. M. T. D. R. D. S. E. C. (2019) · International Journal of Engineering and Advanced Technology · doi:10.35940/ijeat.a1507.129219 · Cited by 273
Melendez, J., Sánchez, C. I., Philipsen, R. H. H. M., Maduskar, P., Dawson, R., Theron, G., Dheda, K., & van Ginneken, B. (2016) · Scientific Reports · doi:10.1038/srep25265 · Cited by 152
CT Colonography with Computer-aided Detection as a Second Reader: Observer Performance Study
Petrick, N., Haider, M., Summers, R. M., Yeshwant, S. C., Brown, L., Iuliano, E. M., Louie, A., Choi, J.-Y., & Pickhardt, P. J. (2008) · Radiology · doi:10.1148/radiol.2453062161 · Cited by 134
van’t Hoog, A. H., Meme, H. K., Laserson, K. F., Agaya, J. A., Muchiri, B. G., Githui, W. A., Odeny, L. O., Marston, B. J., & Borgdorff, M. W. (2012) · PLoS ONE · doi:10.1371/journal.pone.0038691 · Cited by 131
Automatic screening for tuberculosis in chest radiographs: a survey.
Jaeger, S., Karargyris, A., Candemir, S., Siegelman, J., Folio, L. R., Antani, S., & Thoma, G. R. (2013) · Europe PMC (PubMed Central) · doi:10.3978/j.issn.2223-4292.2013.04.03 · Cited by 123
Computer-aided detection of pulmonary tuberculosis on digital chest radiographs: a systematic review
Pande, T., Cohen, C., Pai, M., & Khan, F. A. (2016) · The International Journal of Tuberculosis and Lung Disease · doi:10.5588/ijtld.15.0926 · Cited by 115
An evaluation of symptom and chest radiographic screening in tuberculosis prevalence surveys.
den Boon, S., White, N. W., van Lill, S. W. P., Borgdorff, M. W., Verver, S., Lombard, C. J., Bateman, E. D., Irusen, E. M., Enarson, D. A., & Beyers, N. (2006) · PubMed · Cited by 103
Breuninger, M., van Ginneken, B., Philipsen, R. H. H. M., Mhimbira, F., Hella, J. J., Lwilla, F., van den Hombergh, J., Ross, A., Jugheli, L., Wagner, D., et al. (2014) · PLoS ONE · doi:10.1371/journal.pone.0106381 · Cited by 101
Goo, J. M. (2011) · Korean Journal of Radiology · doi:10.3348/kjr.2011.12.2.145 · Cited by 86
Self-citationSchalekamp, S., van Ginneken, B., Koedam, E., Snoeren, M. M., Tiehuis, A. M., Wittenberg, R., Karssemeijer, N., & Schaefer‐Prokop, C. M. (2014) · Radiology · doi:10.1148/radiol.14131315 · Cited by 85
Maduskar, P., Muyoyeta, M., Ayles, H., Hogeweg, L., Peters-Bax, L., & van Ginneken, B. (2013) · The International Journal of Tuberculosis and Lung Disease · doi:10.5588/ijtld.13.0325 · Cited by 77
Hoog, A. H. V., Meme, H. K., van Deutekom, H., Mithika, A. M., Olunga, C., Onyino, F., & Borgdorff, M. W. (2011) · The International Journal of Tuberculosis and Lung Disease · doi:10.5588/ijtld.11.0004 · Cited by 74
Fusion of Local and Global Detection Systems to Detect Tuberculosis in Chest Radiographs
Hogeweg, L., Mol, C. P., de Jong, P. A., Dawson, R., Ayles, H., & van Ginneken, B. (2010) · Lecture notes in computer science · doi:10.1007/978-3-642-15711-0_81 · Cited by 72
Rahman, M. T., Codlin, A. J., Rahman, M. M., Nahar, A., Reja, M., Islam, T., Qin, Z. Z., Khan, M. A. S., Banu, S., & Creswell, J. (2017) · European Respiratory Journal · doi:10.1183/13993003.02159-2016 · Cited by 66
Fletcher, J. G., Yu, L., Li, Z., Manduca, A., Blezek, D. J., Hough, D. M., Venkatesh, S. K., Brickner, G. C., Cernigliaro, J. G., Hara, A. K., et al. (2015) · Radiology · doi:10.1148/radiol.2015141991 · Cited by 64
Regge, D., Monica, P. D., GALATOLA, G., Laudi, C., Zambon, A., Correale, L., Asnaghi, R., Barbaro, B., Borghi, C., Campanella, D., et al. (2012) · Radiology · doi:10.1148/radiol.12120376 · Cited by 47
Steiner, A., Mangu, C., van den Hombergh, J., van Deutekom, H., van Ginneken, B., Clowes, P., Mhimbira, F., Mfinanga, S., Rachow, A., Reither, K., et al. (2015) · Public Health Action · doi:10.5588/pha.15.0037 · Cited by 20
Research works printed but not linked: 3
- 2017., Global tuberculosis report 2017
- 2013., Systematic screening for active tuberculosis: principles and recommendations
- Zhai, RJafroc: analysis of data acquired using the receiver operating characteristic paradigm and its extensions
Cited by
Liu, X., Faes, L., Kale, A. U., Wagner, S. K., Fu, D. J., Bruynseels, A., Mahendiran, T., Moraes, G., Shamdas, M., Kern, C., et al. (2019) · The Lancet Digital Health · doi:10.1016/s2589-7500(19)30123-2 · Cited by 1,883
Diagnostic accuracy of deep learning in medical imaging: a systematic review and meta-analysis
Aggarwal, R., Sounderajah, V., Martin, G., Ting, D. S. W., Karthikesalingam, A., King, D., Ashrafian, H., & Darzi, A. (2021) · npj Digital Medicine · doi:10.1038/s41746-021-00438-z · Cited by 946
Deep learning in ophthalmology: The technical and clinical considerations
Ting, D. S. W., Peng, L., Varadarajan, A. V., Keane, P. A., Burlina, P. M., Chiang, M. F., Schmetterer, L., Pasquale, L. R., Bressler, N. M., Webster, D. R., et al. (2019) · Progress in Retinal and Eye Research · doi:10.1016/j.preteyeres.2019.04.003 · Cited by 534
Deep learning for chest X-ray analysis: A survey
Çallı, E., Sogancioglu, E., van Ginneken, B., van Leeuwen, K. G., & Murphy, K. (2021) · Medical Image Analysis · doi:10.1016/j.media.2021.102125 · Cited by 506
Hwang, E. J., Park, S., Jin, K.-N., Kim, J. I., Choi, S. Y., Lee, J. H., Goo, J. M., Aum, J., Yim, J.-J., Cohen, J. G., et al. (2019) · JAMA Network Open · doi:10.1001/jamanetworkopen.2019.1095 · Cited by 447
Self-citation
Metadata
- Authors
- Hwang, E. J., Park, S., Jin, K.-N., Kim, J. I., Choi, S. Y., Lee, J. H., Goo, J. M., Aum, J., Yim, J.-J., Park, C. M., Deep Learning-Based Automatic Detection Algorithm Development and Evaluation Group, Kim, D. H., Woo, W., Choi, C., Hwang, I. P., Song, Y. S., Lim, L., Kim, K., Wi, J. Y., Oh, S. S., & Kang, M.-J.
- Affiliations
- Seoul National University (KR)
- Kyung Hee University Hospital at Gangdong (KR)
- Daejeon Eulji Medical Center, Eulji University (KR)
- Corresponding author
- Park, Chang Min
- ORCID
- Venue
- Clinical Infectious Diseases
- Publisher
- Oxford University Press (OUP)
- Published
- 2018-11-08
- Volume
- 69
- Issue
- 5
- Pages
- 739-747
- ISSN
- 1058-4838 (ISSN-L)
- 1537-6591
- PMC
- PMC6695514
- OpenAlex
- W2900683726
- Cited by
- 241
- References
- 31
- Citations by year
- 2026: 23 · 2025: 26 · 2024: 28 · 2023: 38 · 2022: 45 · 2021: 40 · 2020: 27 · 2019: 14
- FWCI
- 13.97
- Type
- journal article
- Language
- en
- Open access
- hybrid
- doi.org
- Licence
- Locations
- Clinical Infectious Diseases (publishedVersion, cc-by)
- Europe PMC (PubMed Central) (publishedVersion, cc-by)
- PubMed Central (publishedVersion, cc-by)
- PubMed (publishedVersion)
- Seoul National University Open Repository (Seoul National University) (submittedVersion)
- Funders
- Seoul National University Hospital Research (04-2016-3000)
- Seoul Research & Business Development Program (FI170002)
- Topics
- Health Sciences › Medicine › Radiology, Nuclear Medicine and Imaging › COVID-19 diagnosis using AI
- Physical Sciences › Computer Science › Artificial Intelligence › AI in cancer detection
- Health Sciences › Medicine › Radiology, Nuclear Medicine and Imaging › Radiomics and Machine Learning in Medical Imaging
- Keywords
- active pulmonary tuberculosis, chest radiograph, deep learning, lesion localization, observer performance comparison, tuberculosis screening, diagnostic accuracy
- MeSH terms
- Deep Learning, Adult, Aged, Algorithms, Automation, Female, Humans, Male, Middle Aged, Radiography, ROC Curve, Sensitivity and Specificity, Thorax, Tuberculosis, Pulmonary
About these checks
Registry, retraction, Cites and statistics results are computed, not judged, with one exception: a printed reference that no index lists is read once by a model before it counts as a citation error. Claims are extracted by a model and kept only when their quote appears verbatim in the text; each cited source is then checked, with a model’s help, for whether it says what the claim relies on. Those verdicts can be wrong — read the claim’s quote and the cited source before relying on one.
Statistics and arithmetic are recomputed, not judged.
Confidence bands are shown only for fields calibrated on our annotated test set. None is calibrated yet, so no band is shown.
What counts as a claim ›How we measure confidence ›How we check this ›
Are you an author, or do you see a problem with this page? Request a review
Data sources
Bibliographic data: Semantic Scholar, OpenAlex, Crossref.
Contains information from the Semantic Scholar Academic Graph Datasets, made available under the ODC Attribution License (ODC-BY 1.0).
Semantic Scholar’s data is described in: Kinney, R., et al. (2023). The Semantic Scholar Open Data Platform. arXiv:2301.10140.
