

The DOI matches its Crossref record; 10 of the 10 references it cites were found in a registry or an index.
Epigenetic and Metabolomic Biomarkers for Biological Age: A Comparative Analysis of Mortality and Frailty Risk
Published version of a preprint
Abstract
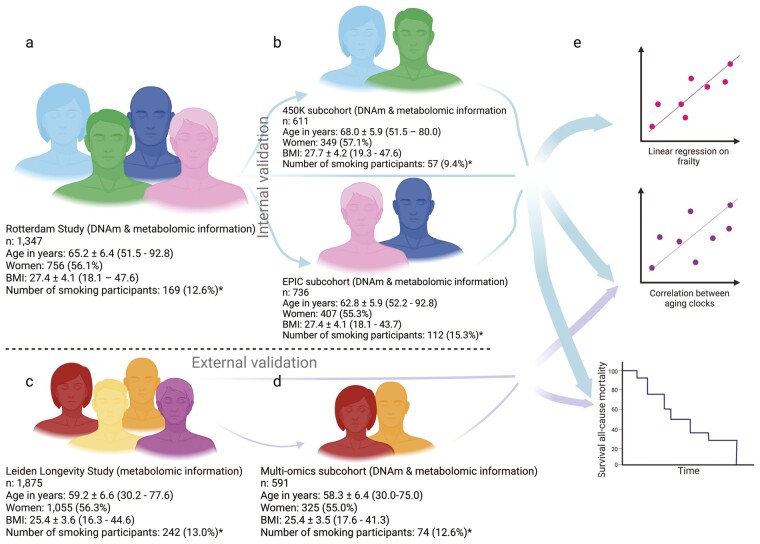
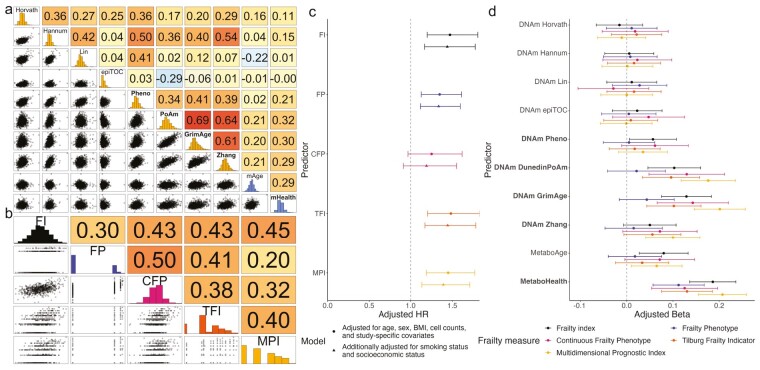
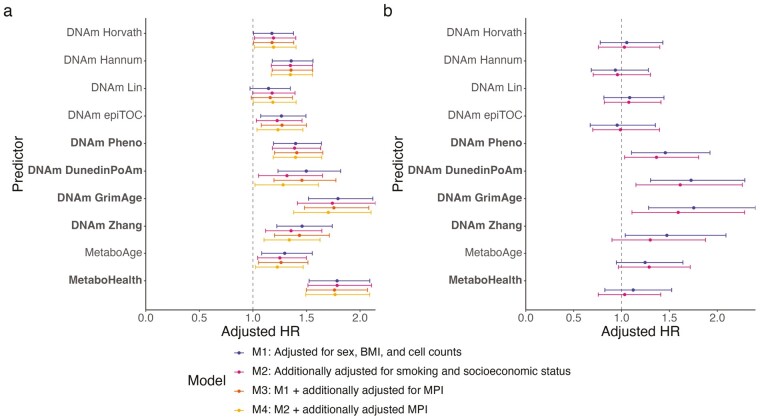
Biological age captures a person’s age-related risk of unfavorable outcomes using biophysiological information. Multivariate biological age measures include frailty scores and molecular biomarkers. These measures are often studied in isolation, but here we present a large-scale study comparing them. In 2 prospective cohorts (n = 3 222), we compared epigenetic (DNAm Horvath, DNAm Hannum, DNAm Lin, DNAm epiTOC, DNAm PhenoAge, DNAm DunedinPoAm, DNAm GrimAge, and DNAm Zhang) and metabolomic-based (MetaboAge and MetaboHealth) biomarkers in reflection of biological age, as represented by 5 frailty measures and overall mortality. Biomarkers trained on outcomes with biophysiological and/or mortality information outperformed age-trained biomarkers in frailty reflection and mortality prediction. DNAm GrimAge and MetaboHealth, trained on mortality, showed the strongest association with these outcomes. The associations of DNAm GrimAge and MetaboHealth with frailty and mortality were independent of each other and of the frailty score mimicking clinical geriatric assessment. Epigenetic, metabolomic, and clinical biological age markers seem to capture different aspects of aging. These findings suggest that mortality-trained molecular markers may provide novel phenotype reflecting biological age and strengthen current clinical geriatric health and well-being assessment.
Overview
The claims and statistics of this paper haven’t been checked yet.
Run the check — free, no account needed. It reads the open-access text and checks the sources it cites.
Integrity signals
Registry
Cites
Statistics
Figures
Verification
Claims the paper makes
The claims and statistics of this paper haven’t been checked yet.
Run the check — free, no account needed. It reads the open-access text and checks the sources it cites.
Claims other papers make about this one
Each is checked against this paper’s own text: does it say what the citing paper says it does?
The source backs part of the claim, not all of it — or backs it for a different population, condition or comparison.
In the citing paper
“So far, relatively few studies have compared individual (composite) biomarkers across multiple cohorts, or multiple biomarkers across the same cohort using standardized and equivalent measurement units that make them fully comparable 32,35,36.”
From Validation of biomarkers of aging (2024) · cites this paper as [36]
Experimental — accuracy not yet measured
Self-check
Percentages, sums and reported differences re-computed from the paper’s own numbers.
The self-check needs the paper’s full text.
Citations
Cites
DNA methylation age of human tissues and cell types
Horvath, S. (2013) · Genome Biology · doi:10.1186/gb-2013-14-10-r115 · Cited by 7,075
Accumulation of Deficits as a Proxy Measure of Aging
Mitnitski, A. B., Mogilner, A. J., & Rockwood, K. (2001) · The Scientific World JOURNAL · doi:10.1100/tsw.2001.58 · Cited by 2,893 · cited 2×
“Frailty measures, like the biological aging biomarkers, were developed to capture the individual aging process (11,12,46); they represent measures of biological age.”
BackgroundDNA methylation GrimAge strongly predicts lifespan and healthspan
Lu, A. T., Quach, A., Wilson, J. G., Reiner, A. P., Aviv, A., Raj, K., Hou, L., Baccarelli, A. A., Li, Y., Stewart, J. D., et al. (2019) · Aging · doi:10.18632/aging.101684 · Cited by 2,540
Ageing as a Risk Factor for Disease
Niccoli, T., & Partridge, L. (2012) · Current Biology · doi:10.1016/j.cub.2012.07.024 · Cited by 1,831
High density DNA methylation array with single CpG site resolution
Bibikova, M., Barnes, B., Tsan, C., Ho, V., Klotzle, B., Le, J. M., Delano, D., Zhang, L., Schroth, G. P., Gunderson, K. L., et al. (2011) · Genomics · doi:10.1016/j.ygeno.2011.07.007 · Cited by 1,727 · cited 1×
“In 687 RS participants and the LLS, we analyzed the samples using Illumina Infinium Human Methylation 450 K (450K) array (31,32).”
MethodValidation of a DNA methylation microarray for 450,000 CpG sites in the human genome
Sandoval, J., Heyn, H., Moran, S., Serra-Musach, J., Pujana, M. A., Bibikova, M., & Esteller, M. (2011) · Epigenetics · doi:10.4161/epi.6.6.16196 · Cited by 990 · cited 1×
“In 687 RS participants and the LLS, we analyzed the samples using Illumina Infinium Human Methylation 450 K (450K) array (31,32).”
MethodGWAS of 126,559 Individuals Identifies Genetic Variants Associated with Educational Attainment
Rietveld, C. A., Medland, S. E., Derringer, J., Yang, J., Esko, T., Martin, N. W., Westra, H.-J., Shakhbazov, K., Abdellaoui, A., Agrawal, A., et al. (2013) · Science · doi:10.1126/science.1235488 · Cited by 827
DNA methylation signatures in peripheral blood strongly predict all-cause mortality
Zhang, Y., Wilson, R., Heiss, J., Breitling, L. P., Saum, K.-U., Schöttker, B., Holleczek, B., Waldenberger, M., Peters, A., & Brenner, H. (2017) · Nature Communications · doi:10.1038/ncomms14617 · Cited by 382
Correlation of an epigenetic mitotic clock with cancer risk
Yang, Z., Wong, A., Kuh, D., Paul, D. S., Rakyan, V. K., Leslie, R. D., Zheng, S. C., Widschwendter, M., Beck, S., & Teschendorff, A. E. (2016) · Genome Biology · doi:10.1186/s13059-016-1064-3 · Cited by 325
van den Akker, E. B., Trompet, S., Barkey Wolf, J. J. H., Beekman, M., Suchiman, H. E. D., Deelen, J., Asselbergs, F. W., Boersma, E., Cats, D., Elders, P. M., et al. (2020) · Circulation: Genomic and Precision Medicine · doi:10.1161/circgen.119.002610 · Cited by 109
Self-citation
Research works printed but not linked: 52
- Rando, 2012, Aging, rejuvenation, and epigenetic reprogramming: resetting the aging clock, Cell., 148, 46, 10.1016/j.cell.2012.01.003 · DOI · Paper page
- Fried, 2001, Frailty in older adults: evidence for a phenotype, J Gerontol A Biol Sci Med Sci, 56, M146, 10.1093/gerona/56.3.M146 · DOI · Paper page
- Parker, 2018, What is Comprehensive Geriatric Assessment (CGA)? An umbrella review, Age Ageing., 47, 149, 10.1093/ageing/afx166 · DOI
- Sourdet, 2020, Impact of the comprehensive geriatric assessment on treatment decision in geriatric oncology, BMC Cancer, 20, 384, 10.1186/s12885-020-06878-2 · DOI
- Schoufour, 2017, Design of a frailty index among community living middle-aged and older people: the Rotterdam study, Maturitas., 97, 14, 10.1016/j.maturitas.2016.12.002 · DOI
- Wu, 2018, Development, construct validity, and predictive validity of a continuous frailty scale: results from 2 large US cohorts, Am J Epidemiol., 187, 1752, 10.1093/aje/kwy041 · DOI · Paper page
- Gobbens, 2020, The Tilburg frailty indicator (TFI): new evidence for its validity, Clin Interv Aging., 15, 265, 10.2147/CIA.S243233 · DOI
- Pilotto, 2008, Development and validation of a multidimensional prognostic index for one-year mortality from comprehensive geriatric assessment in hospitalized older patients, Rejuvenation Res., 11, 151, 10.1089/rej.2007.0569 · DOI
- Dent, 2016, Frailty measurement in research and clinical practice: a review, Eur J Intern Med, 31, 3, 10.1016/j.ejim.2016.03.007 · DOI
- Jylhävä, 2017, Biological Age Predictors, EBioMedicine, 21, 29, 10.1016/j.ebiom.2017.03.046 · DOI · Paper page
- Hannum, 2013, Genome-wide methylation profiles reveal quantitative views of human aging rates, Mol Cell., 49, 359, 10.1016/j.molcel.2012.10.016 · DOI · Paper page
- Lin, 2016, DNA methylation levels at individual age-associated CpG sites can be indicative for life expectancy, Aging (Milano)., 8, 394, 10.18632/aging.100908 · DOI
- Belsky, 2020, Quantification of the pace of biological aging in humans through a blood test, the DunedinPoAm DNA methylation algorithm, Elife, 9, 1, 10.7554/eLife.54870 · DOI · Paper page
- Belsky, 2015, Quantification of biological aging in young adults, Proc Natl Acad Sci U S A., 112, E4104, 10.1073/pnas.1506264112 · DOI · Paper page
- Levine, 2018, An epigenetic biomarker of aging for lifespan and healthspan, Aging (Albany NY), 10, 573, 10.18632/aging.101414 · DOI · Paper page
- Soininen, 2015, Quantitative serum nuclear magnetic resonance metabolomics in cardiovascular epidemiology and genetics, Circ Cardiovasc Genet, 8, 192, 10.1161/CIRCGENETICS.114.000216 · DOI
- Würtz, 2017, Quantitative serum nuclear magnetic resonance metabolomics in large-scale epidemiology: a primer on -Omic technologies, Am J Epidemiol., 186, 1084, 10.1093/aje/kwx016 · DOI
- Deelen, 2019, A metabolic profile of all-cause mortality risk identified in an observational study of 44,168 individuals, Nat Commun., 10, 1, 10.1038/s41467-019-11311-9 · DOI · Paper page
- McCrory, 2021, GrimAge outperforms other epigenetic clocks in the prediction of age-related clinical phenotypes and all-cause mortality, J Gerontol A Biol Sci Med Sci, 76, 741, 10.1093/gerona/glaa286 · DOI · Paper page
- Maddock, 2020, DNA methylation age and physical and cognitive aging, J Gerontol A Biol Sci Med Sci, 75, 504
- Verschoor, 2021, Epigenetic age is associated with baseline and 3-year change in frailty in the Canadian Longitudinal Study on Aging, Clin Epigenetics, 13, 163, 10.1186/s13148-021-01150-1 · DOI · Paper page
- Ikram, 2020, Objectives, Design and Main Findings until 2020 from the Rotterdam Study, 10.1007/s10654-020-00640-5 · DOI
- Schoenmaker, 2006, Evidence of genetic enrichment for exceptional survival using a family approach: the Leiden Longevity Study, Eur J Hum Genet., 14, 79, 10.1038/sj.ejhg.5201508 · DOI
- Pidsley, 2016, Critical evaluation of the Illumina MethylationEPIC BeadChip microarray for whole-genome DNA methylation profiling, Genome Biol., 17, 208, 10.1186/s13059-016-1066-1 · DOI · Paper page
- Pelegí-Sisó, 2021, Methylclock: a bioconductor package to estimate DNA methylation age, Bioinformatics., 37, 1759, 10.1093/bioinformatics/btaa825 · DOI
- Mukherjee, 2021, Genomes OnLine Database (GOLD) v.8: overview and updates, Nucleic Acids Res., 49, D723, 10.1093/nar/gkaa983 · DOI
- Bizzarri, 2022, MiMIR: R-shiny application to infer risk factors and endpoints from Nightingale Health’s 1H-NMR metabolomics data, Bioinformatics., 38, 3847, 10.1093/bioinformatics/btac388 · DOI
- Leening, 2012, Methods of data collection and definitions of cardiac outcomes in the Rotterdam Study, Eur J Epidemiol., 27, 173, 10.1007/s10654-012-9668-8 · DOI
- Gobbens, 2010, The Tilburg frailty indicator: psychometric properties, J Am Med Dir Assoc., 11, 344, 10.1016/j.jamda.2009.11.003 · DOI
- Yeo, 2000, A new family of power transformations to improve normality or symmetry, Biometrika, 87, 954, 10.1093/biomet/87.4.954 · DOI
- Therneau, 2021, Survival: A Package for Survival Analysis in R
- Tingley, 2014, mediation: R package for causal mediation analysis, J Stat Softw, 59, 1, 10.18637/jss.v059.i05 · DOI
- Benjamini, 1995, Controlling the false discovery rate: a practical and powerful approach to multiple testing, J R Stat Soc Series B Stat Methodol, 57, 289, 10.1111/j.2517-6161.1995.tb02031.x · DOI · Paper page
- Houwing-Duistermaat, 2009, Weighted statistics for aggregation and linkage analysis of human longevity in selected families: the Leiden Longevity Study, Stat Med., 28, 140, 10.1002/sim.3421 · DOI
- Horvath, 2018, DNA methylation-based biomarkers and the epigenetic clock theory of ageing, Nat Rev Genet., 19, 371, 10.1038/s41576-018-0004-3 · DOI · Paper page
- Lundgren, 2022, BMI is positively associated with accelerated epigenetic aging in twin pairs discordant for body mass index, J Intern Med., 292, 627, 10.1111/joim.13528 · DOI
- Kane, 2012, The association between geriatric syndromes and survival, J Am Geriatr Soc., 60, 896, 10.1111/j.1532-5415.2012.03942.x · DOI
- Chang, 2015, Frail phenotype and mortality prediction: a systematic review and meta-analysis of prospective cohort studies, Int J Nurs Stud., 52, 1362, 10.1016/j.ijnurstu.2015.04.005 · DOI
- Clegg, 2013, Frailty in elderly people, 752
- Gobbens, 2021, Prediction of mortality by the Tilburg Frailty Indicator (TFI), J Am Med Dir Assoc., 22, 607.e1, 10.1016/j.jamda.2020.07.033 · DOI
- Pilotto, 2012, Comparing the prognostic accuracy for all-cause mortality of frailty instruments: a multicentre 1-year follow-up in hospitalized older patients, PLoS One., 7, e29090, 10.1371/journal.pone.0029090 · DOI
- Pilotto, 2012, A multidimensional prognostic index in common conditions leading to death in older patients, Arch Intern Med., 172, 594, 10.1001/archinternmed.2011.1891 · DOI
- Ravindrarajah, 2013, The ability of three different models of frailty to predict all-cause mortality: results from the European Male Aging Study (EMAS), Arch Gerontol Geriatr., 57, 360, 10.1016/j.archger.2013.06.010 · DOI
- Mitnitski, 2015, Age-related frailty and its association with biological markers of ageing, BMC Med., 13, 10.1186/s12916-015-0400-x · DOI
- Shamliyan, 2013, Association of frailty with survival: a systematic literature review, Ageing Res Rev., 12, 719, 10.1016/j.arr.2012.03.001 · DOI
- Rockwood, 2007, A comparison of two approaches to measuring frailty in elderly people, J Gerontol., 62A, 738, 10.1093/gerona/62.7.738 · DOI · Paper page
- Seligman, 2022, Epigenetic age acceleration and change in frailty in MOBILIZE Boston, J Gerontol A Biol Sci Med Sci., 77, 1760, 10.1093/gerona/glac019 · DOI
- Crimmins, 2021, Associations of age, sex, race/ethnicity, and education with 13 epigenetic clocks in a nationally representative U.S. sample: the Health and Retirement Study, J Gerontol A Biol Sci Med Sci., 76, 1117, 10.1093/gerona/glab016 · DOI · Paper page
- Li, 2021, Comparative validation of three DNA methylation algorithms of ageing and a frailty index in relation to mortality: results from the ESTHER cohort study, EBioMedicine, 74, 103686, 10.1016/j.ebiom.2021.103686 · DOI
- Li, 2020, Longitudinal trajectories, correlations and mortality associations of nine biological ages across 20-years follow-up. Harper DM, Franco E, Moskalev A, eds, Elife, 9, e51507, 10.7554/eLife.51507 · DOI · Paper page
- Kim, 2017, The frailty index outperforms DNA methylation age and its derivatives as an indicator of biological age, Geroscience, 39, 83, 10.1007/s11357-017-9960-3 · DOI
- Nelson, 2020, Biomarkers for aging identified in cross-sectional studies tend to be non-causative, J Gerontol A Biol Sci Med Sci, 75, 466, 10.1093/gerona/glz174 · DOI · Paper page
Cited by
Sorted by citations
Validation of biomarkers of aging
Moqri, M., Herzog, C., Poganik, J. R., Ying, K., Justice, J. N., Belsky, D. W., Higgins-Chen, A. T., Chen, B. H., Cohen, A. A., Fuellen, G., et al. (2024) · Nature Medicine · doi:10.1038/s41591-023-02784-9 · Cited by 361
Self-citation
Metadata
- Authors
- Kuiper, L. M., Polinder-Bos, H. A., Bizzarri, D., Vojinovic, D., Vallerga, C. L., Beekman, M., Dollé, M. E. T., Ghanbari, M., Voortman, T., Reinders, M. J. T., Verschuren, W. M. M., Slagboom, P. E., van den Akker, E. B., & van Meurs, J. B. J.
- Venue
- The Journals of Gerontology: Series A
- Publisher
- Oxford University Press (OUP)
- Published
- 2023-06-12
- Volume
- 78
- Issue
- 10
- Pages
- 1753-1762
- ISSN
- 1079-5006
- 1758-535X
- PMC
- PMC10562890
- Cited by
- 92
- References
- 10
- Language
- en
- Funders
- Erasmus Medical Center
- Erasmus University Rotterdam
- Netherlands Organization for the Health Research and Development
- Research Institute for Disease in the Elderly
- Ministry of Education, Culture, and Science
- Ministry of Health, Welfare, and Sports
- European Commission
- Municipality of Rotterdam
- European Union (FP7/2007–2011, 259679)
- Innovation-Oriented Research Program on Genomics (IGE05007)
- Centre for Medical Systems Biology
- Netherlands Consortium for Healthy Ageing (050-060-810)
- Netherlands Organization for Scientific Research
- BBMRI-NL (NWO 184.021.007, 184.033.111)
- VOILA (ZonMW 457001001)
- Medical Delta
- Dutch Research Council (09150161810095)
- Ministry of Health, Welfare, and Sport (S/010003)
About these checks
Registry, retraction, Cites and statistics results are computed, not judged, with one exception: a printed reference that no index lists is read once by a model before it counts as a citation error. Claims are extracted by a model and kept only when their quote appears verbatim in the text; each cited source is then checked, with a model’s help, for whether it says what the claim relies on. Those verdicts can be wrong — read the claim’s quote and the cited source before relying on one.
Statistics and arithmetic are recomputed, not judged.
Confidence bands are shown only for fields calibrated on our annotated test set. None is calibrated yet, so no band is shown.
What counts as a claim ›How we measure confidence ›How we check this ›
Are you an author, or do you see a problem with this page? Request a review
