

PSMC5 insufficiency and P320R mutation impair proteasome function
Open accessThe DOI matches its Crossref record; 41 of the 42 references it cites were found in a registry or an index; 21 of the 30 sources its claims cite were checked for support.
Abstract
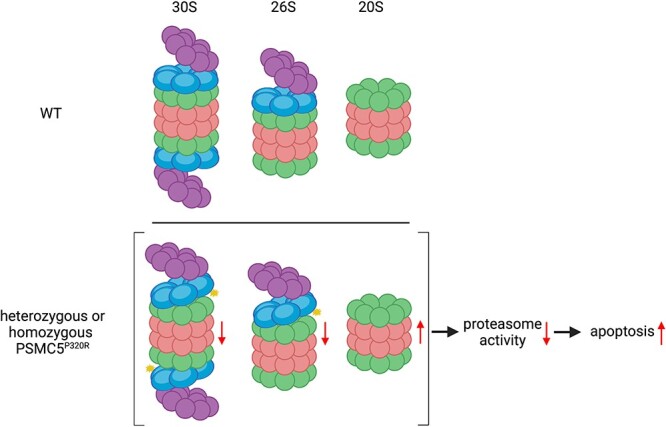
The ubiquitin-proteasome system mediates the degradation of a wide variety of proteins. Proteasome dysfunction is associated with neurodegenerative diseases and neurodevelopmental disorders in humans. Here we identified mutations in PSMC5, an AAA ATPase subunit of the proteasome 19S regulatory particle, in individuals with neurodevelopmental disorders, which were initially considered as variants of unknown significance. We have now found heterozygotes with the following mutations: P320R (6 individuals), R325W, Q160A, and one nonsense mutation at Q69. We focused on understanding the functional consequence of PSMC5 insufficiency and the P320R mutation in cells and found that both impair proteasome function and activate apoptosis. Interestingly, the P320R mutation impairs proteasome function by weakening the association between the 19S regulatory particle and the 20S core particle. Our study supports that proteasome dysfunction is the pathogenic cause of neurodevelopmental disorders in individuals carrying PSMC5 variants.
Overview
CoChat Summary
TL;DR
This study links heterozygous PSMC5 variants to neurodevelopmental disorders and shows that PSMC5 insufficiency or the P320R mutation impairs proteasome function and activates apoptosis. The P320R mutation specifically weakens the association between the 19S regulatory particle and the 20S core particle, reducing 26S/30S proteasomes.
Key findings
- Heterozygous PSMC5 variants were identified in individuals with neurodevelopmental delay and intellectual disability: P320R in 6 individuals, plus R325W, Q160A, and a nonsense Q69Ter variant; all were de novo except Case 6, where inheritance was uncertain.
- PSMC5 knockdown in HeLa and SH-SY5Y cells increased K48-ubiquitinated proteins, cleaved caspase-3, and cell death; cell death was rescued by the apoptosis inhibitor Z-VAD (50 μM) but not by ferroptosis, necroptosis, or pyroptosis inhibitors.
- Knockdown of 19S subunits PSMC5, PSMC3, PSMD2, or PSMD12 diminished chymotrypsin-like activity of 30S and 26S proteasomes but enhanced 20S proteasome activity, with decreased 30S/26S pools and increased 20S pools.
- In engineered BE(2)-M17 cells, heterozygous and homozygous PSMC5 P320R increased cell death, K48-ubiquitinated proteins, and caspase-3 cleavage, impaired Ub-G76V-GFP degradation, and reduced co-immunoprecipitation of 20S core subunits with the 19S particle while leaving 19S subunits associated.
Methods
- Clinical cases were patients referred for global developmental delay and intellectual disability; PSMC5 variants were identified by trio whole-genome sequencing, with 7 cases described and additional cases noted in DECIPHER.
- Cell models included HeLa, SH-SY5Y, and engineered BE(2)-M17 cells carrying heterozygous or homozygous PSMC5 P320R; PSMC5 and other 19S subunits were depleted by siRNA.
- Assays included LDH and CellTox Green cytotoxicity, Western blotting, immunoprecipitation, in-gel proteasome chymotrypsin-like activity using Suc-LLVY-AMC, and FACS-based Ub-G76V-GFP degradation; statistics used mean ± SD with two-tailed paired t-tests or one-way ANOVA with Dunnett’s test.
Limitations
- Stated: the authors note that animal models would likely be necessary to understand the exact mechanism by which PSMC5 variants cause clinical features, and that future work should examine developmental pathways and possible proteotoxicity.
- Stated: because P320R sits near the PSMD10/gankyrin binding region, the authors cannot rule out an assembly defect in addition to destabilizing effects; they also suggest compensatory programmes such as autophagy, integrated stress response, and Nrf1 targets may contribute.
- Evident: the functional work relies on cancer and neuroblastoma cell lines rather than patient neurons or tissues, the clinical series is small and clinically heterogeneous, and Case 6 lacks evidence of de novo versus inherited origin.
Model-written summary. Check it against the paper before relying on it.
Integrity signals
Registry
Cites
Statistics
Figures


Verification
Claims the paper makes
8 Valid · 1 Not valid · 2 Not checked · 62 Own results and interpretations
A result the paper reports from its own data — it cites no other source for it, so there is none to check. The quote shows it is in the paper.
In the paper
“All the siRNA-mediated knockdown of PSMC5 increased cell death over 48 h (Fig. 1B).”
§ PSMC5 insufficiency and P320R mutation impair proteasome function > Results > PSMC5 depletion increases the accumulation of K48-ubiquitinated proteins and activates apoptosis
plainstates a cause- Asserted: passes — The authors put it forward as true.
- Checkable: passes — It can be checked against evidence.
- Load-bearing: passes — The paper’s conclusions depend on it.
- Based: passes — The paper gives a reason why it holds.
A result the paper reports from its own data — it cites no other source for it, so there is none to check. The quote shows it is in the paper.
In the paper
“PSMC5 knockdown in HeLa and SH-SY5Y cells induced the cleavage of caspase-3 (Fig. 1C and Fig. S1C)”
§ PSMC5 insufficiency and P320R mutation impair proteasome function > Results > PSMC5 depletion increases the accumulation of K48-ubiquitinated proteins and activates apoptosis
plainstates a cause- Asserted: passes — The authors put it forward as true.
- Checkable: passes — It can be checked against evidence.
- Load-bearing: passes — The paper’s conclusions depend on it.
- Based: passes — The paper gives a reason why it holds.
A result the paper reports from its own data — it cites no other source for it, so there is none to check. The quote shows it is in the paper.
In the paper
“HeLa and SH-SY5Y cells with PSMC5 knockdown exhibited enhanced accumulation of K48-ubiquitinated proteins (Fig. 1C and Fig. S1C)”
§ PSMC5 insufficiency and P320R mutation impair proteasome function > Results > PSMC5 depletion increases the accumulation of K48-ubiquitinated proteins and activates apoptosis
plainstates a cause- Asserted: passes — The authors put it forward as true.
- Checkable: passes — It can be checked against evidence.
- Load-bearing: passes — The paper’s conclusions depend on it.
- Based: passes — The paper gives a reason why it holds.
A result the paper reports from its own data — it cites no other source for it, so there is none to check. The quote shows it is in the paper.
In the paper
“We have now found heterozygotes with the following mutations: P320R (6 individuals), R325W, Q160A, and one nonsense mutation at Q69.”
- Also stated in: § Identification of de novo PSMC5 variants—Case reports · plain
“Parallel clinical work identified three other individuals with similar phenotypes carrying distinct PSMC5 variants, including Case 5 carrying a nonsense mutation at Q69, Case 6 harbouring a missense mutation of Q160A, and Case 7 with a missense mutation of R325W.”
§ PSMC5 insufficiency and P320R mutation impair proteasome function > Abstract
plainstates an associationn = 6- Asserted: passes — The authors put it forward as true.
- Checkable: passes — It can be checked against evidence.
- Load-bearing: passes — The paper’s conclusions depend on it.
- Based: passes — The paper gives a reason why it holds.
- Also stated in: § Identification of de novo PSMC5 variants—Case reports · plain
A result the paper reports from its own data — it cites no other source for it, so there is none to check. The quote shows it is in the paper.
In the paper
“and more K48 ubiquitin-linked proteins (Fig. 4B)”
§ PSMC5 insufficiency and P320R mutation impair proteasome function > Discussion
plainstates an association- Asserted: passes — The authors put it forward as true.
- Checkable: passes — It can be checked against evidence.
- Load-bearing: passes — The paper’s conclusions depend on it.
- Based: passes — The paper gives a reason why it holds.
43 more claims
Create a free account to see all 73 claims and to verify the 1 reference still open.
- It may state two separate claims as one. 15
- Probably not a substantial claim. 9
- The quote only partly states this claim. 1
Claims other papers make about this one
Each is checked against this paper’s own text: does it say what the citing paper says it does?
The cited source says what the claim attributes to it.
In the citing paper
“Notably, the same p.Pro320Arg variant reported in this study was also identified in six individuals with neurodevelopmental disorders [12].”
From Strengthening the Role of PSMC5 as a Potential Gene Associated with Neurodevelopmental Disorders (2025) · cites this paper as [12]
The cited source says what the claim attributes to it.
In the citing paper
“We propose this variant as a potential mutational hotspot, as it has previously been identified in six individuals with clinical features similar to those observed in our patient.”
From Strengthening the Role of PSMC5 as a Potential Gene Associated with Neurodevelopmental Disorders (2025) · cites this paper as [12]
The cited source says what the claim attributes to it.
In the citing paper
“Specifically, the Pro320Arg mutation disrupts proteasome function by altering the interaction between the 19S regulatory particle and the 20S core particle, as demonstrated by in vitro assays [12].”
From Strengthening the Role of PSMC5 as a Potential Gene Associated with Neurodevelopmental Disorders (2025) · cites this paper as [12]
The cited source says what the claim attributes to it.
In the citing paper
“Functional in vitro studies investigating both PSMC5 insufficiency and the Pro320Arg mutation revealed that they impair proteasome activity and trigger apoptosis.”
From Strengthening the Role of PSMC5 as a Potential Gene Associated with Neurodevelopmental Disorders (2025) · cites this paper as [12]
Self-check
Percentages, sums and reported differences re-computed from the paper’s own numbers.
Each contradiction between two passages listed here was confirmed by an independent check.
Rated major: it would touch a result — a value a result rests on, reported and recomputed p-values on opposite sides of the significance level, two passages that conflict with no sign which is right, or a cited work retracted before this paper was published.
In the paper
§ PSMC5 insufficiency and P320R mutation impair proteasome function > Results > Identification of de novo PSMC5 variants—Case reports
“| Regression | NO | YES | NO | NO | NO | NO | NO |”
§ PSMC5 insufficiency and P320R mutation impair proteasome function > Results > Identification of de novo PSMC5 variants—Case reports
“There is no history of regression or epilepsy.”
Citations
Cites
Hershko, A., & Ciechanover, A. (1998) · Annual Review of Biochemistry · doi:10.1146/annurev.biochem.67.1.425 · Cited by 8,840
The integrated stress response
Pakos‐Zebrucka, K., Koryga, I., Mnich, K., Ljujic, M., Samali, A., & Gorman, A. M. (2016) · The EMBO Reports · doi:10.15252/embr.201642195 · Cited by 2,659 · cited 1×
“As proteasome defects lead to compensatory responses like activation of autophagy, the integrated stress response, and Nrf1 transcriptional programmes [31, 39, 40], it is possible that some of the consequences of these proteasome mutations may be driven by hyperactive compensatory programmes.”
DECIPHER: Database of Chromosomal Imbalance and Phenotype in Humans Using Ensembl Resources
Firth, H. V., Richards, S. M., Bevan, A. P., Clayton, S., Corpas, M., Rajan, D., Vooren, S. V., Moreau, Y., Pettett, R. M., & Carter, N. P. (2009) · The American Journal of Human Genetics · doi:10.1016/j.ajhg.2009.03.010 · Cited by 1,990 · cited 1×
“Additionally, 2 further cases with very similar clinical profile of neurodevelopmental delay and speech and language delay with the PSMC5 P320R mutation are visible in DECIPHER [24].”
Self-citationA multiubiquitin chain is confined to specific lysine in a targeted short-lived protein
Chau, V., Tobias, J. W., Bachmair, A., Marriott, D., Ecker, D. J., Gonda, D. K., & Varshavsky, A. (1989) · Science · doi:10.1126/science.2538923 · Cited by 1,535 · cited 1×
“Lysine-48 (K48) ubiquitinated proteins chains are well established as substrates for proteasomal degradation, therefore we next examined whether depleting PSMC5 affects the accumulation of K48-ubiquitinated proteins [25].”
Protein ubiquitination involving an E1–E2–E3 enzyme ubiquitin thioester cascade
Scheffner, M., Nuber, U., & Huibregtse, J. M. (1995) · Nature · doi:10.1038/373081a0 · Cited by 1,016 · cited 1×
“The ubiquitination serves as a recognition signal enabling the substrate to be degraded by the 26S proteasome [1, 2].”
The logic of the 26S proteasome.
Collins, G. A., & Goldberg, A. L. (2017) · Cell · doi:10.1016/j.cell.2017.04.023 · Cited by 933 · cited 2×
“Typically, the 19S RP binds to one or both ends of the 20S CP to form proteasome holoenzymes, which are accordingly termed single-capped 26S proteasomes and double-capped 30S proteasomes [4, 7].”
Self-citationThe proteasome: overview of structure and functions
TANAKA, K. (2009) · Proceedings of the Japan Academy, Series B · doi:10.2183/pjab.85.12 · Cited by 862 · cited 2×
“Typically, the 19S RP binds to one or both ends of the 20S CP to form proteasome holoenzymes, which are accordingly termed single-capped 26S proteasomes and double-capped 30S proteasomes [4, 7].”
Altered proteasomal function in sporadic Parkinson’s disease
St. P. McNaught, K., Belizaire, R., Isacson, O., Jenner, P., & Olanow, C. W. (2003) · Experimental Neurology · doi:10.1006/exnr.2002.8050 · Cited by 573 · cited 1×
“Proteasome dysfunction has been implicated in the pathogenesis of neurodegenerative diseases including Alzheimer’s disease [14], Parkinson’s disease [15], Huntington’s disease [16], and amyotrophic lateral sclerosis [17].”
Dantuma, N. P., Lindsten, K., Glas, R., Jellne, M., & Masucci, M. G. (2000) · Nature Biotechnology · doi:10.1038/75406 · Cited by 553 · cited 1×
“The pUb-G76V-GFP-IRES-DsRed was constructed by subcloning Ub-G76V-GFP from Ub-G76V-GFP plasmid (gift from Nico Dantuma, Addgene, plasmid #11941) [41] into pIRES2 DsRed-Express2 vector between EcoRI and BamHI restriction sites using Gibson assembly method (NEB, E2611S).”
Ubiquitin, the proteasome and protein degradation in neuronal function and dysfunction
Tai, H.-C., & Schuman, E. M. (2008) · Nature Reviews Neuroscience · doi:10.1038/nrn2499 · Cited by 532 · cited 1×
“The UPS plays indispensable roles in neuronal function and development [10–13].”
Cited by
Strengthening the Role of PSMC5 as a Potential Gene Associated with Neurodevelopmental Disorders
Vinci, M., Musumeci, A., Papa, C., Ragalmuto, A., Saccone, S., Federico, C., Greco, D., Greco, V., Calì, F., & Treccarichi, S. (2025) · International Journal of Molecular Sciences · doi:10.3390/ijms26136386 · Cited by 2
“Specifically, the Pro320Arg mutation disrupts proteasome function by altering the interaction between the 19S regulatory particle and the 20S core particle, as demonstrated by in vitro assays [12].”
InfluentialMitra, A., Chaudhury, D., Rai, A. B., Das, U. N., Prasad, T. S. K., Bose, B., & Sudheer Shenoy, P. (2025) · The FASEB Journal · doi:10.1096/fj.202502321rr · Cited by 2
Mallick, S., Qamar, Q., Mishra, B., & Nayak, A. (2025) · Mutation research. Fundamental and molecular mechanisms of mutagenesis · doi:10.1016/j.mrfmmm.2025.111901 · Cited by 1
Yanagi, K. S., Chen, B. J., Kunjo, S. O., et al. (2025) · bioRxiv (Cold Spring Harbor Laboratory) · doi:10.64898/2025.12.29.696916
Metadata
- Authors
- Yu, Z.-Q., Carmichael, J., Collins, G. A., D'Agostino, M. D., Lessard, M., Firth, H. V., Harijan, P., Fry, A. E., Dean, J., Zhang, J., Kini, U., Goldberg, A. L., & Rubinsztein, D. C.
- Affiliations
- University of Cambridge (GB)
- Cambridge University Hospitals NHS Foundation Trust (GB)
- Harvard University (US)
- Division of Medical Genetics , Department of Specialised Medicine, , 1001 Decarie Boulevard, Montreal, Quebec, H4A 3J1 , Canada
- Children's Hospital of Eastern Ontario (CA)
- Addenbrooke's Hospital (GB)
- University Hospital of Wales (GB)
- University of Aberdeen (GB)
- University of Oxford (GB)
- Corresponding author
- Rubinsztein, David C
- ORCID
- Venue
- Human Molecular Genetics
- Publisher
- Oxford University Press (OUP)
- Published
- 2024-05-22
- Volume
- 33
- Issue
- 17
- Pages
- 1506-1523
- ISSN
- 0964-6906 (ISSN-L)
- 1460-2083
- PMC
- PMC11336065
- OpenAlex
- W4398193136
- Cited by
- 4
- References
- 42
- Citations by year
- 2026: 1 · 2025: 3
- FWCI
- 0.54
- Type
- journal article
- Language
- en
- Open access
- hybrid
- doi.org
- Licence
- Locations
- Human Molecular Genetics (publishedVersion, cc-by)
- PubMed Central (publishedVersion, cc-by)
- PubMed (publishedVersion)
- ORCA Online Research @Cardiff (Cardiff University) (submittedVersion)
- Apollo (University of Cambridge) (submittedVersion, cc-by)
- Apollo (cc-by)
- Funders
- Cure Alzheimer's Fund
- Wellcome Trust (WT 098051, 098051)
- Alzheimer's Society
- National Institute for Health and Care Research ((NIHR203312, HICF-1009-003)
- Department of Health and Social Care
- Rosetrees Trust
- UK Dementia Research Institute
- National Institutes of Health
- Medical Research Council (NIHR203312)
- NIHR Cambridge Biomedical Research Centre (NIHR 203312)
- National Institute of General Medical Sciences (R01GM051923)
- Topics
- Life Sciences › Biochemistry, Genetics and Molecular Biology › Molecular Biology › Ubiquitin and proteasome pathways
- Life Sciences › Biochemistry, Genetics and Molecular Biology › Genetics › Genetics and Neurodevelopmental Disorders
- Life Sciences › Neuroscience › Cellular and Molecular Neuroscience › Genetic Neurodegenerative Diseases
- Keywords
- proteasome dysfunction, 19S regulatory particle, AAA+ ATPase, neurodevelopmental disorders, variants of uncertain significance, ubiquitin-proteasome system, apoptosis, 20S core particle, proteasome assembly, neurodegenerative diseases
- MeSH terms
- Female, Humans, Male, Mutation, Apoptosis, Ubiquitin, Proteasome Endopeptidase Complex, HEK293 Cells, Neurodevelopmental Disorders
About these checks
Registry, retraction, Cites and statistics results are computed, not judged, with one exception: a printed reference that no index lists is read once by a model before it counts as a citation error. Claims are extracted by a model and kept only when their quote appears verbatim in the text; each cited source is then checked, with a model’s help, for whether it says what the claim relies on. Those verdicts can be wrong — read the claim’s quote and the cited source before relying on one.
The claim verdicts this report counts are experimental: their accuracy is not yet measured.
A language model drew the claims from the paper on 2026-09-30, under version 3 of the claim definition (model deepseek-v4.1-flash, prompt extract-v3).
A second model labelled each claim on 2026-09-30 (model jev-1.13-20260917, definition revision gold-guideline-v0.2).
Statistics and arithmetic are recomputed, not judged.
Confidence bands are shown only for fields calibrated on our annotated test set. None is calibrated yet, so no band is shown.
What counts as a claim ›How we measure confidence ›How we check this ›
Are you an author, or do you see a problem with this page? Request a review
How to cite
Cite CoChat for the checks on this page, and the paper for its own findings.
- This page
- CoChat. (2026). Citation check: PSMC5 insufficiency and P320R mutation impair proteasome function. https://app.cochat.ai/papers/10.1093/hmg/ddae085
- The paper
- Yu, Z.-Q., Carmichael, J., Collins, G. A., D'Agostino, M. D., Lessard, M., Firth, H. V., Harijan, P., Fry, A. E., Dean, J., Zhang, J., Kini, U., Goldberg, A. L., & Rubinsztein, D. C. (2024). PSMC5 insufficiency and P320R mutation impair proteasome function. Human Molecular Genetics. https://doi.org/10.1093/hmg/ddae085
Data sources
Bibliographic data: Semantic Scholar, OpenAlex, Crossref.
Contains information from the Semantic Scholar Academic Graph Datasets, made available under the ODC Attribution License (ODC-BY 1.0).
Semantic Scholar’s data is described in: Kinney, R., et al. (2023). The Semantic Scholar Open Data Platform. arXiv:2301.10140.
