

The DOI matches its Crossref record; 64 of the 64 references it cites were found in a registry or an index.
Validity of polygenic risk scores: are we measuring what we think we are?
Open accessAbstract
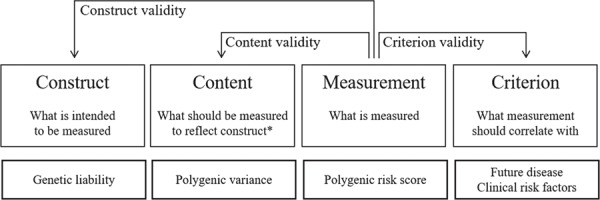
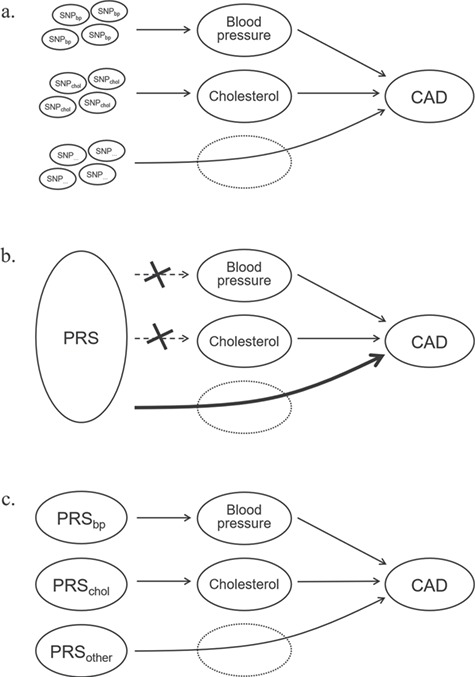
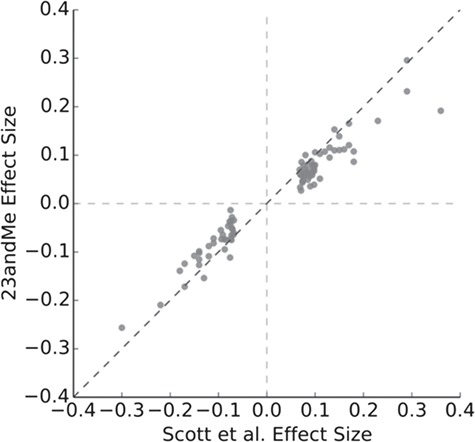
Polygenic risk scores (PRSs) have become the standard for quantifying genetic liability in the prediction of disease risks. PRSs are generally constructed as weighted sum scores of risk alleles using effect sizes from genome-wide association studies as their weights. The construction of PRSs is being improved with more appropriate selection of independent single-nucleotide polymorphisms (SNPs) and optimized estimation of their weights but is rarely reflected upon from a theoretical perspective, focusing on the validity of the risk score. Borrowing from psychometrics, this paper discusses the validity of PRSs and introduces the three main types of validity that are considered in the evaluation of tests and measurements: construct, content, and criterion validity. This introduction is followed by a discussion of three topics that challenge the validity of PRS, namely, their claimed independence of clinical risk factors, the consequences of relaxing SNP inclusion thresholds and the selection of SNP weights. This discussion of the validity of PRS reminds us that we need to keep questioning if weighted sums of risk alleles are measuring what we think they are in the various scenarios in which PRSs are used and that we need to keep exploring alternative modeling strategies that might better reflect the underlying biological pathways.
Overview
The claims and statistics of this paper haven’t been checked yet.
Run the check — free, no account needed. It reads the open-access text and checks the sources it cites.
Integrity signals
Registry
Cites
Statistics
Figures
Verification
Claims the paper makes
The claims and statistics of this paper haven’t been checked yet.
Run the check — free, no account needed. It reads the open-access text and checks the sources it cites.
Claims other papers make about this one
Each is checked against this paper’s own text: does it say what the citing paper says it does?
The source backs part of the claim, not all of it — or backs it for a different population, condition or comparison.
In the citing paper
“Genetic data are increasingly cost effective, requiring only a one-in-a-lifetime ascertainment, but they also have limited predictive ability on their own 27 .”
From Multimodal biomedical AI (2022) · cites this paper as [27]
Experimental — accuracy not yet measured
Self-check
Percentages, sums and reported differences re-computed from the paper’s own numbers.
The self-check needs the paper’s full text.
Citations
Cites
Construct validity in psychological tests.
Cronbach, L. J., & Meehl, P. E. (1955) · Psychological Bulletin · doi:10.1037/h0040957 · Cited by 11,195 · cited 2×
“This paper aimed to reflect on the validity of PRSs by introducing the types of validity that are deemed important in the design of measurements, tests or questionnaires (20).”
BackgroundQuality criteria were proposed for measurement properties of health status questionnaires
Terwee, C. B., Bot, S. D. M., de Boer, M. R., van der Windt, D. A. W. M., Knol, D. L., Dekker, J., Bouter, L. M., & de Vet, H. C. W. (2007) · Journal of Clinical Epidemiology · doi:10.1016/j.jclinepi.2006.03.012 · Cited by 10,764 · cited 1×
“The validity of a test or measurement indicates whether it measures what it intends to measure (20,21).”
BackgroundMoons, K. G. M., Altman, D. G., Reitsma, J. B., Ioannidis, J. P. A., Macaskill, P., Steyerberg, E. W., Vickers, A. J., Ransohoff, D. F., & Collins, G. S. (2015) · Annals of Internal Medicine · doi:10.7326/m14-0698 · Cited by 5,147 · cited 1×
“The validity of clinical risk models needs to be demonstrated, and the choices in the model development need to be justified (64).”
BackgroundCommon polygenic variation contributes to risk of schizophrenia and bipolar disorder
The International Schizophrenia Consortium (2009) · Nature · doi:10.1038/nature08185 · Cited by 4,821 · cited 2×
“These PRSs go beyond only including genome-wide significant SNPs from GWASs and beyond setting lower thresholds (higher P-values) than genome-wide significance for the selection of SNPs (7).”
BackgroundXV.—The Correlation between Relatives on the Supposition of Mendelian Inheritance.
Fisher, R. A. (1919) · Transactions of the Royal Society of Edinburgh · doi:10.1017/s0080456800012163 · Cited by 4,387 · cited 1×
“weak effects (11,12), (2) there seems to be no evidence for strong gene–gene interaction (12) and (3) these PRSs generally hold their discriminative ability in external validation samples”
BackgroundKhera, A. V., Chaffin, M., Aragam, K. G., Haas, M. E., Roselli, C., Choi, S. H., Natarajan, P., Lander, E. S., Lubitz, S. A., Ellinor, P. T., et al. (2018) · Nature Genetics · doi:10.1038/s41588-018-0183-z · Cited by 2,953 · cited 4×
“A recent trend in the construction of PRSs is to use millions of SNPs in the prediction of risks (27,57,58).”
BackgroundMethodInfluential23andMe Research Team, Lee, J. J., COGENT (Cognitive Genomics Consortium), Social Science Genetic Association Consortium, Wedow, R., Okbay, A., Kong, E., Maghzian, O., Zacher, M., Nguyen-Viet, T. A., et al. (2018) · Nature Genetics · doi:10.1038/s41588-018-0147-3 · Cited by 2,470 · cited 1×
“disease risk, and should they be included in the PRS? When a PRS is constructed based on 2 million of SNPs of which, say, 100 are able to change predicted risks before the decimal, will we tell a patient that their risk is calculated using 2 million or 100 SNPs? When researchers relax the SNP inclusion thresholds to i…”
BackgroundCausal diagrams for empirical research
PEARL, J. (1995) · Biometrika · doi:10.1093/biomet/82.4.669 · Cited by 2,355
The personal and clinical utility of polygenic risk scores
Torkamani, A., Wineinger, N. E., & Topol, E. J. (2018) · Nature Reviews Genetics · doi:10.1038/s41576-018-0018-x · Cited by 1,655 · cited 4×
“It may be that researchers are aware and accept that the validity is imperfect as many more genetic associations remain to be identified (2), all models have limitations, and they can be useful even when imperfect.”
BackgroundInfluentialGenetic Risk, Adherence to a Healthy Lifestyle, and Coronary Disease
Khera, A. V., Emdin, C. A., Drake, I., Natarajan, P., Bick, A. G., Cook, N. R., Chasman, D. I., Baber, U., Mehran, R., Rader, D. J., et al. (2016) · New England Journal of Medicine · doi:10.1056/nejmoa1605086 · Cited by 1,460 · cited 1×
“These independent effects have been observed for lifestyle in stroke (32), coronary heart disease (33,34), adiposity (35,36), diabetes (37) and breast cancer (38), and for stressful life events in depression (39).”
Background
Research works printed but not linked: 1
- Multhaup, 2019, White Paper: the Science Behind 23andMe’s Type 2 Diabetes Report
Cited by
Sorted by citations
Tutorial: a guide to performing polygenic risk score analyses
Choi, S. W., Mak, T. S. H., & O’Reilly, P. F. (2020) · Nature Protocols · doi:10.1038/s41596-020-0353-1 · Cited by 2,058
Acosta, J. N., Falcone, G. J., Rajpurkar, P., & Topol, E. J. (2022) · Nature Medicine · doi:10.1038/s41591-022-01981-2 · Cited by 1,365
Polygenic risk scores: from research tools to clinical instruments
Lewis, C. M., & Vassos, E. (2020) · Genome Medicine · doi:10.1186/s13073-020-00742-5 · Cited by 1,360
“Despite methodological concerns about construct, content, and criterion validity of PRS [1], many studies have shown that PRSs can predict disease status in researchbased case-control studies [2–4].”
BackgroundImproving reporting standards for polygenic scores in risk prediction studies
Wand, H., Lambert, S. A., Tamburro, C. P., Iacocca, M. A., O’Sullivan, J. W., Sillari, C. H., Kullo, I. J., Rowley, R. K., Dron, J. S., Brockman, D., et al. (2021) · Nature · doi:10.1038/s41586-021-03243-6 · Cited by 484
Self-citationAdult Hippocampal Neurogenesis in Major Depressive Disorder and Alzheimer’s Disease
Berger, T., Lee, H. A., Young, A. H., Aarsland, D., & Thuret, S. (2020) · Trends in Molecular Medicine · doi:10.1016/j.molmed.2020.03.010 · Cited by 206
Metadata
- Authors
- Janssens, A. C. J. W.
- Affiliations
- Emory University (US)
- Corresponding author
- Janssens, A Cecile J W
- Venue
- Human Molecular Genetics
- Publisher
- Oxford University Press (OUP)
- Published
- 2019-08-28
- Volume
- 28
- Issue
- R2
- Pages
- R143-R150
- ISSN
- 0964-6906 (ISSN-L)
- 1460-2083
- PMC
- PMC7013150
- OpenAlex
- W2970478489
- Cited by
- 129
- References
- 64
- Citations by year
- 2026: 13 · 2025: 14 · 2024: 24 · 2023: 16 · 2022: 31 · 2021: 22 · 2020: 7 · 2019: 1
- FWCI
- 2.04
- Type
- journal article
- Language
- en
- Open access
- hybrid
- doi.org
- Licence
- Locations
- Human Molecular Genetics (publishedVersion, cc-by-nc)
- PubMed Central (publishedVersion, cc-by-nc)
- PubMed (publishedVersion)
- Topics
- Life Sciences › Biochemistry, Genetics and Molecular Biology › Genetics › Genetic Associations and Epidemiology
- Life Sciences › Biochemistry, Genetics and Molecular Biology › Genetics › Genomics and Rare Diseases
- Life Sciences › Biochemistry, Genetics and Molecular Biology › Genetics › Genetic and phenotypic traits in livestock
- Keywords
- polygenic risk score, validity, construct validity, content validity, criterion validity, psychometrics, single nucleotide polymorphisms, SNP selection, genetic susceptibility, disease risk prediction, clinical risk factors
- MeSH terms
- Alleles, Diabetes Mellitus, Type 2, Genotype, Humans, Models, Genetic, Psychometrics, Risk Factors, Reproducibility of Results, Genetic Predisposition to Disease, Multifactorial Inheritance, Polymorphism, Single Nucleotide, Genome-Wide Association Study
About these checks
Registry, retraction, Cites and statistics results are computed, not judged, with one exception: a printed reference that no index lists is read once by a model before it counts as a citation error. Claims are extracted by a model and kept only when their quote appears verbatim in the text; each cited source is then checked, with a model’s help, for whether it says what the claim relies on. Those verdicts can be wrong — read the claim’s quote and the cited source before relying on one.
Statistics and arithmetic are recomputed, not judged.
Confidence bands are shown only for fields calibrated on our annotated test set. None is calibrated yet, so no band is shown.
What counts as a claim ›How we measure confidence ›How we check this ›
Are you an author, or do you see a problem with this page? Request a review
