

Collider scope: when selection bias can substantially influence observed associations
Open accessPublished version of a preprint
The DOI matches its Crossref record; 39 of the 39 references it cites were found in a registry or an index.
Abstract
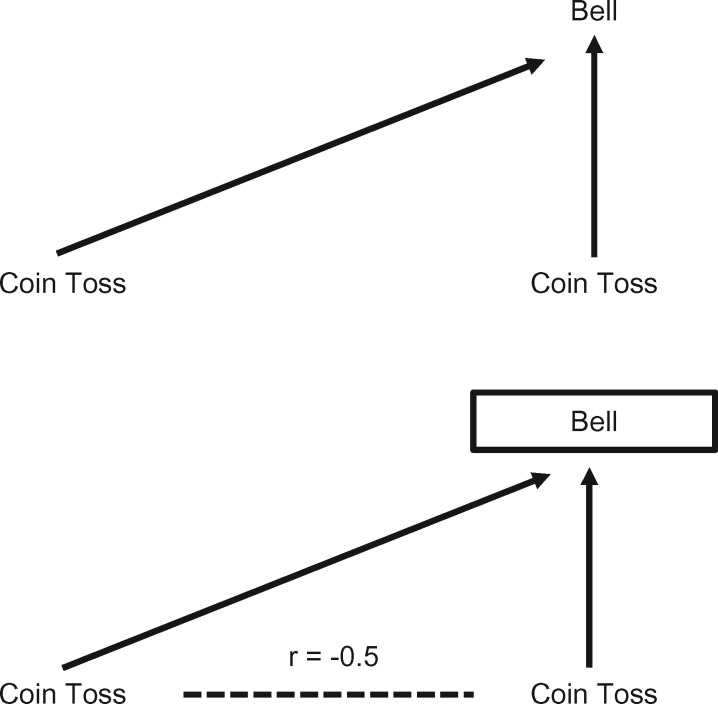
Large-scale cross-sectional and cohort studies have transformed our understanding of the genetic and environmental determinants of health outcomes. However, the representativeness of these samples may be limited-either through selection into studies, or by attrition from studies over time. Here we explore the potential impact of this selection bias on results obtained from these studies, from the perspective that this amounts to conditioning on a collider (i.e. a form of collider bias). Whereas it is acknowledged that selection bias will have a strong effect on representativeness and prevalence estimates, it is often assumed that it should not have a strong impact on estimates of associations. We argue that because selection can induce collider bias (which occurs when two variables independently influence a third variable, and that third variable is conditioned upon), selection can lead to substantially biased estimates of associations. In particular, selection related to phenotypes can bias associations with genetic variants associated with those phenotypes. In simulations, we show that even modest influences on selection into, or attrition from, a study can generate biased and potentially misleading estimates of both phenotypic and genotypic associations. Our results highlight the value of knowing which population your study sample is representative of. If the factors influencing selection and attrition are known, they can be adjusted for. For example, having DNA available on most participants in a birth cohort study offers the possibility of investigating the extent to which polygenic scores predict subsequent participation, which in turn would enable sensitivity analyses of the extent to which bias might distort estimates.
Overview
The claims and statistics of this paper haven’t been checked yet.
Free: it reads the open-access text and checks the first 5 claims that cite a source we can check. Create a free account to check every claim.
Integrity signals
Registry
Cites
Statistics
Figures


Verification
Claims the paper makes
The claims and statistics of this paper haven’t been checked yet.
Free: it reads the open-access text and checks the first 5 claims that cite a source we can check. Create a free account to check every claim.
Claims other papers make about this one
Each is checked against this paper’s own text: does it say what the citing paper says it does?
The source backs part of the claim, not all of it — or backs it for a different population, condition or comparison.
In the citing paper
“The latter is supported by the observation that the proportion of smokers and the proportion with no qualifications-reflecting social position-were considerably lower than in the background population, and that the 5-year mortality rate was several-fold lower than in the UK population as a whole.38,39”
From A common variant in CCDC93 protects against myocardial infarction and cardiovascular mortality by regulating endosomal trafficking of low-density lipoprotein receptor (2020) · cites this paper as [38]
Experimental — accuracy not yet measuredIn the citing paper
“Importantly, initial UK Biobank data inclusion of a subset of participants recruited for a study of smoking and lung function in the first analysis17, which may have resulted in collider bias31 and contributed to the initial lower genetic correlation.”
From Transancestral GWAS of alcohol dependence reveals common genetic underpinnings with psychiatric disorders (2018) · cites this paper as [31]
In the citing paper
“In either of these situations, controlling for such a covariate could bias the MR effect estimate.55–57”
From Mendelian randomization (2022) · cites this paper as [55]
Self-check
Percentages, sums and reported differences re-computed from the paper’s own numbers.
The self-check needs the paper’s full text.
Citations
Cites
Statistical Analysis With Missing Data
Lahiff, M., Little, R. J. A., & Rubin, D. B. (1989) · Journal of the American Statistical Association · doi:10.2307/2289883 · Cited by 17,265
Statistical Analysis with Missing Data
Little, R. J. A., & Rubin, D. B. (2002) · Wiley Series in Probability and Statistics · doi:10.1002/9781119013563 · Cited by 8,473
An atlas of genetic correlations across human diseases and traits
ReproGen Consortium, Bulik-Sullivan, B., Psychiatric Genomics Consortium, Genetic Consortium for Anorexia Nervosa of the Wellcome Trust Case Control Consortium 3, Finucane, H. K., Anttila, V., Gusev, A., Day, F. R., Loh, P.-R., Duncan, L., et al. (2015) · Nature Genetics · doi:10.1038/ng.3406 · Cited by 4,255 · cited 1×
“For this reason, studies using polygenic scores, genome-wide allelic scores (20), and/or whole-genome genetic correlations (21, 22) are most at risk of producing biased and potentially misleading results where there is reason to believe the study sample is not representative of the study population but the mechanism o…”
BackgroundBoyd, A., Golding, J., Macleod, J., Lawlor, D. A., Fraser, A., Henderson, J., Molloy, L., Ness, A., Ring, S., & Davey Smith, G. (2013) · International Journal of Epidemiology · doi:10.1093/ije/dys064 · Cited by 2,996
Self-citationA structural approach to selection bias
Hernán, M. A., Hernández-Díaz, S., & Robins, J. M. (2004) · Epidemiology · doi:10.1097/01.ede.0000135174.63482.43 · Cited by 2,844 · cited 1×
“Statistical adjustment of the XY association for a variable Z is equivalent to observing this association in a sub-population where all individuals share the same value of Z (1, 13).”
BackgroundCohort Profile: The Avon Longitudinal Study of Parents and Children: ALSPAC mothers cohort
Fraser, A., Macdonald-Wallis, C., Tilling, K., Boyd, A., Golding, J., Davey Smith, G., Henderson, J., Macleod, J., Molloy, L., Ness, A., et al. (2013) · International Journal of Epidemiology · doi:10.1093/ije/dys066 · Cited by 2,494 · cited 1×
“Initially, 14 541 pregnant women who were expected to give birth between 1 April 1991 and 31 December 1992 were recruited into the study in the South West region of England.(19) The study website contains details of all data available through a fully searchable data dictionary: [http://www.”
MethodSelf-citationEndogenous Selection Bias: The Problem of Conditioning on a Collider Variable
Elwert, F., & Winship, C. (2014) · Annual Review of Sociology · doi:10.1146/annurev-soc-071913-043455 · Cited by 1,168 · cited 1×
“There are other ways in which ascertainment can generate biases.(31) For example, Figure 3 (panel B) shows a situation in which entry into a study is conditional upon the value of the phenotype (but not the outcome of interest) and where the phenotype does not cause the outcome, but the phenotype and outcome are corre…”
BackgroundWhy Representativeness Should Be Avoided
Rothman, K. J., Gallacher, J. E., & Hatch, E. E. (2013) · International Journal of Epidemiology · doi:10.1093/ije/dys223 · Cited by 861
Lee, S. H., Yang, J., Goddard, M. E., Visscher, P. M., & Wray, N. R. (2012) · Bioinformatics · doi:10.1093/bioinformatics/bts474 · Cited by 635
Smith, G. D., Lawlor, D. A., Harbord, R., Timpson, N., Day, I., & Ebrahim, S. (2007) · PLoS Medicine · doi:10.1371/journal.pmed.0040352 · Cited by 569 · cited 1×
“In particular, for genetic variants, where conventional confounding is low (11), it has been argued, even by those concerned about selection bias, that any problems associated with a lack of representativeness may be modest (10, 12).”
BackgroundSelf-citationGanna, A., & Ingelsson, E. (2015) · The Lancet · doi:10.1016/s0140-6736(15)60175-1 · Cited by 411 · cited 1×
“Unsurprisingly, therefore, participants in UK Biobank have far lower rates of 5-year mortality than the UK population as a whole.(40) Clearly, agreeing to take part”
BackgroundWain, L. V., Shrine, N., Miller, S., Jackson, V. E., Ntalla, I., Artigas, M. S., Billington, C. K., Kheirallah, A. K., Allen, R., Cook, J. P., et al. (2015) · The Lancet Respiratory Medicine · doi:10.1016/s2213-2600(15)00283-0 · Cited by 400
METASTROKE Consortium, I. C. F. B. P. G., Hagenaars, S. P., SpiroMeta Consortium, CHARGE Consortium Pulmonary Group, C. C. A. A. L. G., Harris, S. E., Davies, G., Hill, W. D., Liewald, D. C. M., Ritchie, S. J., Marioni, R. E., et al. (2016) · Molecular Psychiatry · doi:10.1038/mp.2015.225 · Cited by 350
Loss to Follow-up in Cohort Studies: Bias in Estimates of Socioeconomic Inequalities
Howe, L. D., Tilling, K., Galobardes, B., & Lawlor, D. A. (2013) · Epidemiology · doi:10.1097/ede.0b013e31827623b1 · Cited by 315
Self-citationLane, J. M., Vlasac, I., Anderson, S. G., Kyle, S. D., Dixon, W. G., Bechtold, D. A., Gill, S., Little, M. A., Luik, A., Loudon, A., et al. (2016) · Nature Communications · doi:10.1038/ncomms10889 · Cited by 312
Evans, D. M., Visscher, P. M., & Wray, N. R. (2009) · Human Molecular Genetics · doi:10.1093/hmg/ddp295 · Cited by 297
Self-citationData Resource Profile: Accessible Resource for Integrated Epigenomic Studies (ARIES)
Relton, C. L., Gaunt, T., McArdle, W., Ho, K., Duggirala, A., Shihab, H., Woodward, G., Lyttleton, O., Evans, D. M., Reik, W., et al. (2015) · International Journal of Epidemiology · doi:10.1093/ije/dyv072 · Cited by 286
Self-citationJones, H. J., Stergiakouli, E., Tansey, K. E., Hubbard, L., Heron, J., Cannon, M., Holmans, P., Lewis, G., Linden, D. E. J., Jones, P. B., et al. (2016) · JAMA Psychiatry · doi:10.1001/jamapsychiatry.2015.3058 · Cited by 237
Self-citationCommentary: Representativeness is usually not necessary and often should be avoided
Richiardi, L., Pizzi, C., & Pearce, N. (2013) · International Journal of Epidemiology · doi:10.1093/ije/dyt103 · Cited by 213
Asymptotically Unbiased Estimation of Exposure Odds Ratios in Complete Records Logistic Regression
Bartlett, J. W., Harel, O., & Carpenter, J. R. (2015) · American Journal of Epidemiology · doi:10.1093/aje/kwv114 · Cited by 161
Using causal diagrams to guide analysis in missing data problems
Daniel, R. M., Kenward, M. G., Cousens, S. N., & De Stavola, B. L. (2012) · Statistical Methods in Medical Research · doi:10.1177/0962280210394469 · Cited by 155 · cited 1×
“The simulation scenario was based loosely on the UK Biobank, and we simulated selection into the study, so all the data on nonselected individuals are missing and therefore imputation is not a potential solution (see below), because this requires some data on which to base the imputation.(16) All variables were Normal…”
MethodGale, C. R., Hagenaars, S. P., Davies, G., Hill, W. D., Liewald, D. C. M., Cullen, B., Penninx, B. W., International Consortium for Blood Pressure GWAS, C. C. A. A. L. G., Boomsma, D. I., Pell, J., et al. (2016) · Translational Psychiatry · doi:10.1038/tp.2016.56 · Cited by 154
Height and Breast Cancer Risk: Evidence From Prospective Studies and Mendelian Randomization
Zhang, B., Shu, X.-O., Delahanty, R. J., Zeng, C., Michailidou, K., Bolla, M. K., Wang, Q., Dennis, J., Wen, W., Long, J., et al. (2015) · Journal of the National Cancer Institute · doi:10.1093/jnci/djv219 · Cited by 141
Association of the CHRNA5-A3-B4 Gene Cluster With Heaviness of Smoking: A Meta-Analysis
Ware, J. J., van den Bree, M. B. M., & Munafò, M. R. (2011) · Nicotine & Tobacco Research · doi:10.1093/ntr/ntr118 · Cited by 118
Self-citationCorrelation and Causation in the Study of Personality
Lee, J. J. (2012) · European Journal of Personality · doi:10.1002/per.1863 · Cited by 117
Martin, J., Tilling, K., Hubbard, L., Stergiakouli, E., Thapar, A., Davey Smith, G., O'Donovan, M. C., & Zammit, S. (2016) · American Journal of Epidemiology · doi:10.1093/aje/kww009 · Cited by 117
Self-citationCommentary: Should we always deliberately be non-representative?
Ebrahim, S., & Davey Smith, G. (2013) · International Journal of Epidemiology · doi:10.1093/ije/dyt105 · Cited by 102
Self-citationMortality selection in a genetic sample and implications for association studies
Domingue, B. W., Belsky, D. W., Harrati, A., Conley, D., Weir, D. R., & Boardman, J. D. (2017) · International Journal of Epidemiology · doi:10.1093/ije/dyx041 · Cited by 98
Age-Dependent Pleiotropy Between General Cognitive Function and Major Psychiatric Disorders
Hill, W. D., Davies, G., Liewald, D. C., McIntosh, A. M., & Deary, I. J. (2016) · Biological Psychiatry · doi:10.1016/j.biopsych.2015.08.033 · Cited by 83
Mayeda, E. R., Tchetgen Tchetgen, E. J., Power, M. C., Weuve, J., Jacqmin-Gadda, H., Marden, J. R., Vittinghoff, E., Keiding, N., & Glymour, M. M. (2016) · American Journal of Epidemiology · doi:10.1093/aje/kwv451 · Cited by 82
Nohr, E. A., & Olsen, J. (2013) · International Journal of Epidemiology · doi:10.1093/ije/dyt102 · Cited by 74
Measures of socioeconomic status and self-reported glaucoma in the UK Biobank cohort
Shweikh, Y., Ko, F., Chan, M. P. Y., et al. (2015) · Eye · doi:10.1038/eye.2015.157 · Cited by 74
Commentary: On representativeness
Elwood, J. M. (2013) · International Journal of Epidemiology · doi:10.1093/ije/dyt101 · Cited by 71
The Obesity Paradox in Survival after Cancer Diagnosis: Tools for Evaluation of Potential Bias
Mayeda, E. R., & Glymour, M. M. (2017) · Cancer Epidemiology Biomarkers & Prevention · doi:10.1158/1055-9965.epi-16-0559 · Cited by 35
Rebuttal: When it comes to scientific inference, sometimes a cigar is just a cigar
Rothman, K. J., Gallacher, J., & Hatch, E. E. (2013) · International Journal of Epidemiology · doi:10.1093/ije/dyt124 · Cited by 32
A General and Robust Framework for Secondary Traits Analysis
Song, X., Ionita‐Laza, I., Liu, M., Reibman, J., & Wei, Y. (2016) · Genetics · doi:10.1534/genetics.115.181073 · Cited by 21
Role of survivor bias in pancreatic cancer case-control studies
Hu, Z., Connett, J. E., Yuan, J., & Anderson, K. E. (2015) · Annals of Epidemiology · doi:10.1016/j.annepidem.2015.11.001 · Cited by 17
Robust analysis of secondary phenotypes in case‐control genetic association studies
Xing, C., McCarthy, J., Dupuis, J., Cupples, L. A., Meigs, J. B., Lin, X., & Allen, A. S. (2016) · Statistics in Medicine · doi:10.1002/sim.6976 · Cited by 12
The Wright stuff: genes in the interrogation of correlation and causation
Smith, G. D. (2012) · Bristol Research (University of Bristol) · Cited by 9
Research works printed but not linked: 3
- Asendorpf, 2012, Bias due to controlling a collider: A potentially important issue for personality research, Eur J Pers, 26, 391
- Office for National Statistics, 2014, Adult Smoking Habits in Great Britain: 2014
- Office for National Statistics, 2011, Census: 2011
Cited by
Sanderson, E., Glymour, M. M., Holmes, M. V., Kang, H., Morrison, J., Munafò, M. R., Palmer, T., Schooling, C. M., Wallace, C., Zhao, Q., et al. (2022) · Nature Reviews Methods Primers · doi:10.1038/s43586-021-00092-5 · Cited by 2,229
Guidelines for performing Mendelian randomization investigations
Burgess, S., Davey Smith, G., Davies, N. M., Dudbridge, F., Gill, D., Glymour, M. M., Hartwig, F. P., Holmes, M. V., Minelli, C., Relton, C. L., et al. (2019) · Wellcome Open Research · doi:10.12688/wellcomeopenres.15555.1 · Cited by 1,834
Self-citationProgram, T. M. V., Evangelou, E., Warren, H. R., Mosen-Ansorena, D., Mifsud, B., Pazoki, R., Gao, H., Ntritsos, G., Dimou, N., Cabrera, C. P., et al. (2018) · Nature Genetics · doi:10.1038/s41588-018-0205-x · Cited by 1,381
Guidelines for performing Mendelian randomization investigations
Burgess, S., Davey Smith, G., Davies, N. M., Dudbridge, F., Gill, D., Glymour, M. M., Hartwig, F. P., Holmes, M. V., Minelli, C., Relton, C. L., et al. (2020) · Wellcome Open Research · doi:10.12688/wellcomeopenres.15555.2 · Cited by 1,273
Pulit, S. L., Stoneman, C., Morris, A. P., Wood, A. R., Glastonbury, C. A., Tyrrell, J., Yengo, L., Ferreira, T., Marouli, E., Ji, Y., et al. (2019) · Human Molecular Genetics · doi:10.1093/hmg/ddy327 · Cited by 1,163
Metadata
- Authors
- Munafò, M. R., Tilling, K., Taylor, A. E., Evans, D. M., & Davey Smith, G.
- Affiliations
- MRC Integrative Epidemiology Unit
- University of Bristol (GB)
- UK Centre for Tobacco & Alcohol Studies (GB)
- Translational Research Institute (AU)
- Venue
- International Journal of Epidemiology
- Publisher
- Oxford University Press (OUP)
- Published
- 2017-09-27
- Volume
- 47
- Issue
- 1
- Pages
- 226-235
- ISSN
- 0300-5771 (ISSN-L)
- 1464-3685
- PMC
- PMC5837306
- OpenAlex
- W2528374605
- Cited by
- 813
- References
- 39
- Citations by year
- 2026: 59 · 2025: 58 · 2024: 106 · 2023: 96 · 2022: 130 · 2021: 121 · 2020: 97 · 2019: 84 · 2018: 45 · 2017: 17
- FWCI
- 45.84
- Type
- journal article
- Language
- en
- Open access
- hybrid
- doi.org
- Licence
- Locations
- International Journal of Epidemiology (publishedVersion, cc-by)
- PubMed Central (publishedVersion, cc-by)
- PubMed (publishedVersion)
- Explore Bristol Research (submittedVersion, cc-by)
- Bristol Research (University of Bristol) (submittedVersion, cc-by)
- Funders
- Wellcome Trust (102215/2/13/2)
- University of Bristol (MC_UU_12013/2, MC_UU_12013/8, MC_UU_12013/1, MC_UU_12013/4, MC_UU_12013/6, MC_UU_12013/9)
- BBSRC (BBI025751/1, BB/I025263/1)
- MRC
- ESRC
- NIH
- Medical Research Council
- British Heart Foundation
- Cancer Research UK
- Economic and Social Research Council
- National Institute for Health Research
- Topics
- Physical Sciences › Mathematics › Statistics and Probability › Statistical Methods in Epidemiology
- Life Sciences › Biochemistry, Genetics and Molecular Biology › Genetics › Genetic Associations and Epidemiology
- Physical Sciences › Mathematics › Statistics and Probability › Advanced Causal Inference Techniques
- Keywords
- selection bias, collider bias, study attrition, sample representativeness, polygenic risk score, bias correction
- MeSH terms
- Cross-Sectional Studies, Humans, Cohort Studies, Selection Bias, Patient Selection
About these checks
Registry, retraction, Cites and statistics results are computed, not judged, with one exception: a printed reference that no index lists is read once by a model before it counts as a citation error. Claims are extracted by a model and kept only when their quote appears verbatim in the text; each cited source is then checked, with a model’s help, for whether it says what the claim relies on. Those verdicts can be wrong — read the claim’s quote and the cited source before relying on one.
Statistics and arithmetic are recomputed, not judged.
Confidence bands are shown only for fields calibrated on our annotated test set. None is calibrated yet, so no band is shown.
What counts as a claim ›How we measure confidence ›How we check this ›
Are you an author, or do you see a problem with this page? Request a review
Data sources
Bibliographic data: Semantic Scholar, OpenAlex, Crossref.
Contains information from the Semantic Scholar Academic Graph Datasets, made available under the ODC Attribution License (ODC-BY 1.0).
Semantic Scholar’s data is described in: Kinney, R., et al. (2023). The Semantic Scholar Open Data Platform. arXiv:2301.10140.
