

The DOI matches its Crossref record; 1 of the 1 references it cites were found in a registry or an index.
Predicting the distribution of a rare chipmunk (Neotamias quadrivittatus oscuraensis): comparing MaxEnt and occupancy models
Abstract
Species distribution models (SDMs) use presence records to determine the relationship between species occurrence and various environmental variables to create predictive maps describing the species’ distribution. The Oscura Mountains Colorado chipmunk (Neotamias quadrivittatus oscuraensis) occurs in central New Mexico and is of conservation concern due to its relict distribution and threats to habitat. We previously created an occupancy model for this taxon, but were concerned that the model may not have adequately captured the ecological factors influencing the chipmunk’s distribution because of the data hungry nature of occupancy modeling. MaxEnt is another SDM method that is particularly effective at testing large numbers of variables and handling small sample sizes. Our goal was to create a MaxEnt model for the Oscura Mountains Colorado chipmunk and to compare it with our previous occupancy model for this taxon, either to strengthen our original assessment of the relevant ecological factors or identify additional factors that were not captured by our occupancy model. We created MaxEnt models using occurrence records from baited camera traps and opportunistic surveys. We adjusted model complexity using a novel method for tuning both the regularization multiplier and feature class parameters while also performing variable selection. We compared the distribution maps and variables selected by MaxEnt to the results of our occupancy model for this taxon. The MaxEnt and occupancy models selected similar environmental variables and the overall spatial pattern of occurrence was similar for each model. Likelihood of occurrence was positively related to elevation, piñon woodland vegetation type, and topographic variables associated with escarpments. The overall similarities between the MaxEnt and occupancy models increased our confidence of the ecological factors influencing the distribution of the chipmunk. We conclude that MaxEnt offers advantages for predicting the distribution of rare species, which can help inform conservation actions.
Overview
The claims and statistics of this paper haven’t been checked yet.
Run the check — free, no account needed. It reads the open-access text and checks the sources it cites.
Integrity signals
Registry
Cites
Statistics
Figures
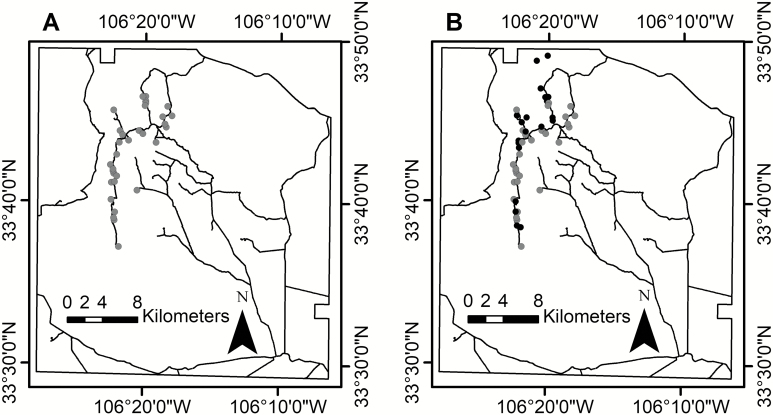
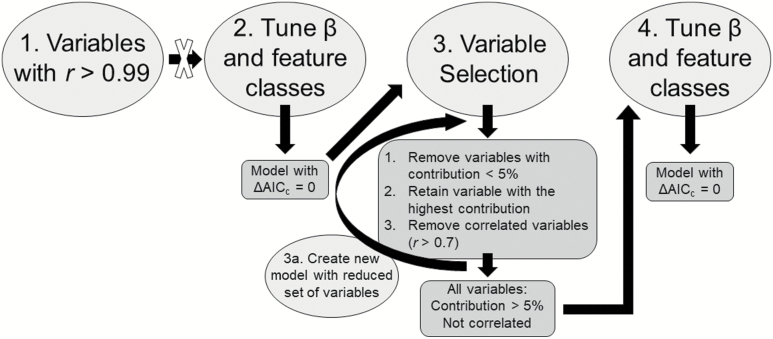
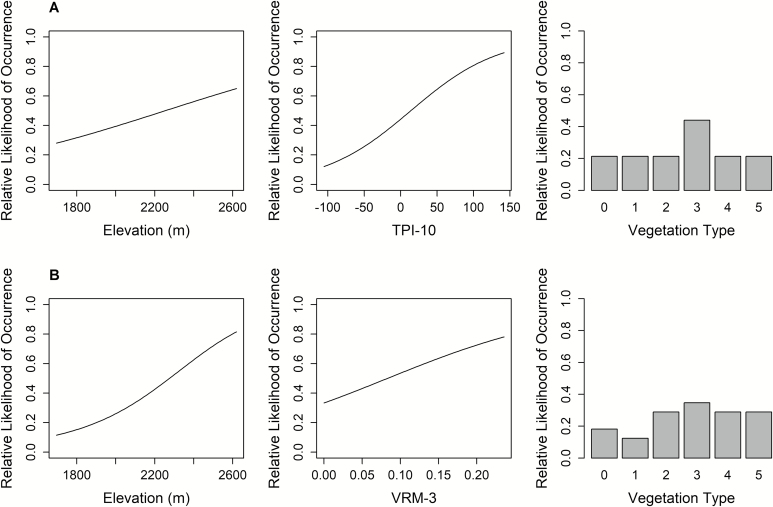
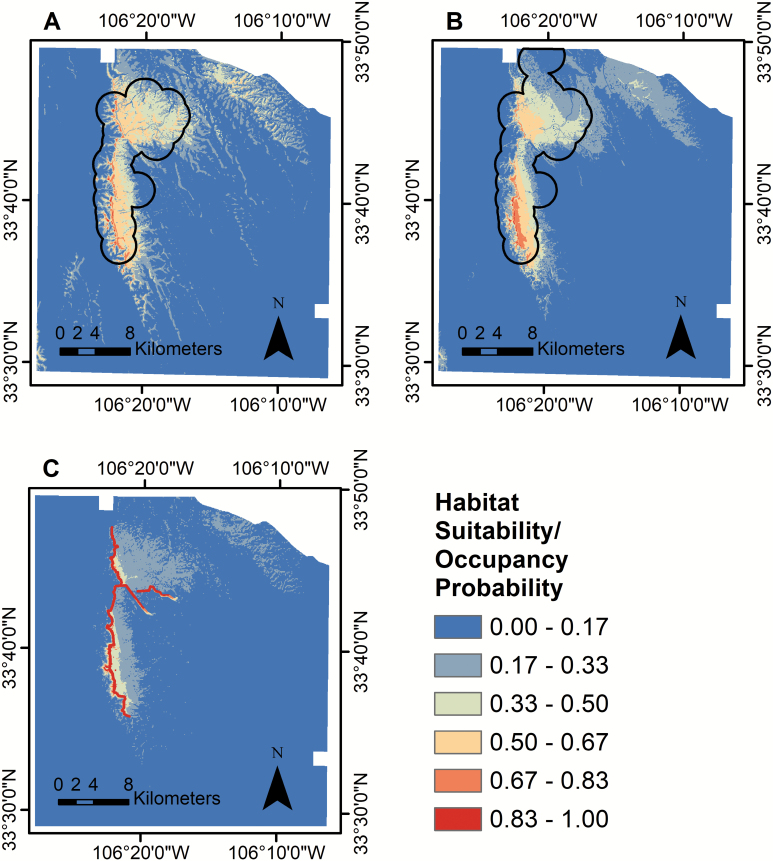
Verification
Claims the paper makes
The claims and statistics of this paper haven’t been checked yet.
Run the check — free, no account needed. It reads the open-access text and checks the sources it cites.
Claims other papers make about this one
Each is checked against this paper’s own text: does it say what the citing paper says it does?
The cited source says what the claim attributes to it.
In the citing paper
“Environmental layers with collinearity will affect the interpretation of the results.”
From A maxent predictive model for hunter-gatherer sites in the southern pampas, argentina (2021) · cites this paper as Perkins-Taylor & Frey 2020
In the citing paper
“To correct this parameter, some authors suggest eliminating highly correlated variables (see Perkins-Taylor & Frey 2020).”
From A maxent predictive model for hunter-gatherer sites in the southern pampas, argentina (2021) · cites this paper as Perkins-Taylor & Frey 2020
Self-check
Percentages, sums and reported differences re-computed from the paper’s own numbers.
The self-check needs the paper’s full text.
Citations
Cites
Temperature as a potent driver of regional forest drought stress and tree mortality
Park Williams, A., Allen, C. D., Macalady, A. K., Griffin, D., Woodhouse, C. A., Meko, D. M., Swetnam, T. W., Rauscher, S. A., Seager, R., Grissino-Mayer, H. D., et al. (2013) · Nature Climate Change · doi:10.1038/nclimate1693 · Cited by 1,991
Research works printed but not linked: 60
- Anderson, 2010, The effect of the extent of the study region on GIS models of species geographic distributions and estimates of niche evolution: preliminary tests with montane rodents (genus Nephelomys) in Venezuela, Journal of Biogeography, 37, 1378, 10.1111/j.1365-2699.2010.02290.x · DOI
- Barve, 2011, The crucial role of the accessible area in ecological niche modeling and species distribution modeling, Ecological Modeling, 222, 1810, 10.1016/j.ecolmodel.2011.02.011 · DOI
- Bergstrom, 1986, Ecological and behavioral relationships among three species of chipmunks (Tamias) in the Front Range of Colorado
- Best, 1994, Tamias quadrivittatus, Mammalian Species, 466, 1
- Burnham, 2002, Model selection and multimodel inference: a practical information-theoretical approach
- Chen, 2015, Animal occurrence and space use change in the landscape of anthropogenic noise, Biological Conservation, 192, 315, 10.1016/j.biocon.2015.10.003 · DOI
- D’Elia, 2015, Activity-specific ecological niche models for planning reintroductions of California condors (Gymnogyps californianus), Biological Conservation, 184, 90, 10.1016/j.biocon.2015.01.002 · DOI
- Ditto, 2007, Effects of ecogeographic variables on genetic variation in montane mammals: implications for conservation in a global warming scenario, Journal of Biogeography, 34, 1136, 10.1111/j.1365-2699.2007.01700.x · DOI
- Elith, 2006, Novel methods improve prediction of species’ distributions from occurrence data, Ecography, 29, 129, 10.1111/j.2006.0906-7590.04596.x · DOI · Paper page
- Elith, 2011, A statistical explanation of MaxEnt for ecologists, Diversity and Distributions, 17, 43, 10.1111/j.1472-4642.2010.00725.x · DOI · Paper page
- Fithian, 2013, Finite-sample equivalence in several statistical models for presence-only data, Annals of Applied Statistics, 7, 1917, 10.1214/13-AOAS667 · DOI
- Fourcade, 2014, Mapping species distributions with MaxEnt using a geographically biased sample of presence data: a performance assessment of methods for correcting sampling bias, PLoS ONE, 9, e97122, 10.1371/journal.pone.0097122 · DOI · Paper page
- Galante, 2018, The challenge of modeling niches and distributions for data-poor species: a comprehensive approach to model complexity, Ecography, 41, 726, 10.1111/ecog.02909 · DOI
- Gormely, 2011, Using presence-only and presence-absence data to estimate the current and potential distributions of established invasive species, Journal of Applied Ecology, 48, 25, 10.1111/j.1365-2664.2010.01911.x · DOI
- Guillera-Arroita, 2015, Is my species distribution model fit for purpose? Matching data and models to applications, Global Ecology and Biogeography, 24, 276, 10.1111/geb.12268 · DOI
- Johnson, 2014, Habitat use at multiple scales by pinyon-juniper birds on Department of Defense lands III: landscape, territory/colony, and nest scale. Final project report to Department of Defense Legacy Resource Management Program
- Johnson, 2006, Interdependence of pinyon pines and pinyon jays: 2004–2005 final report
- Jueterbock, 2016, The fate of the Arctic seaweed Fucus distichus under climate change: an ecological niche modeling approach, Ecology and Evolution, 6, 1712, 10.1002/ece3.2001 · DOI
- Kramer-Schadt, 2013, The importance of correcting for sampling bias in MaxEnt species distribution models, Diversity and Distributions, 19, 1366, 10.1111/ddi.12096 · DOI · Paper page
- Lahoz-Monfort, 2014, Imperfect detection impacts the performance of species distribution models, Global Ecology and Biogeography, 23, 504, 10.1111/geb.12138 · DOI
- Lechleitner, 1969, Wild mammals of Colorado: their appearance, habitats, distribution, and abundance
- Loew, 1999, Sex-biased dispersal in eastern chipmunks, Tamias striatus, Evolutionary Ecology, 13, 557, 10.1023/A:1006701909737 · DOI
- MacKenzie, 2006, Occupancy estimation and modeling
- McCune, 2002, Equations for potential annual direct incident radiation and heat load, Journal of Vegetation Science, 13, 603, 10.1111/j.1654-1103.2002.tb02087.x · DOI
- McDonald, 2018, Applying the niche reduction hypothesis to modelling distributions: a case study of a critically endangered rodent, Biological Conservation, 217, 207, 10.1016/j.biocon.2017.10.002 · DOI
- Meddens, 2015, Patterns and causes of observed piñon pine mortality in the southwestern United States, The New Phytologist, 206, 91, 10.1111/nph.13193 · DOI
- Meredith, 1974, Long distance movements by two species of chipmunks (Eutamias) in Southern Alberta, Journal of Mammalogy, 55, 466, 10.2307/1379022 · DOI
- Merow, 2013, A practical guide to MaxEnt for modeling species’ distributions: what it does, and why inputs and settings matter, Ecography, 36, 1058, 10.1111/j.1600-0587.2013.07872.x · DOI · Paper page
- Meyer, 2006, Accuracy of resource selection functions across spatial scales, Diversity and Distribution, 12, 288, 10.1111/j.1366-9516.2006.00241.x · DOI
- Morales, 2017, MaxEnt’s parameter configuration and small samples: are we paying attention to recommendations? A systematic review, PeerJ, 5, e3093, 10.7717/peerj.3093 · DOI · Paper page
- Muldavin, 2000, The vegetation of White Sands Missile Range volume I: handbook of vegetation communities. Final report to Environmental Directorate, White Sands Missile Range
- Muldavin, 2000, The vegetation of White Sands Missile Range volume II: vegetation map. Final report to Environmental Directorate, White Sands Missile Range
- Murray, 2015, Relative performance of ecological niche and occupancy models for predicting invasions by patchily-distributed species, Biological Invasions, 17, 2691, 10.1007/s10530-015-0906-3 · DOI
- Muscarella, 2014, ENMEval: an R package for conducting spatially independent evaluations and estimating optimal model complexity for MaxEnt ecological niche models, Methods in Ecology and Evolution, 5, 1198, 10.1111/2041-210X.12261 · DOI · Paper page
- New Mexico Department of Game and Fish, 2016, Threatened and endangered species of New Mexico, 2016 Biennial Review
- Patterson, 1980, A new subspecies of Eutamias quadrivittatus (Rodentia: Sciuridae) from the Organ Mountains, New Mexico, Journal of Mammalogy, 61, 455, 10.2307/1379839 · DOI
- Perkins-Taylor, 2017, Using occupancy and species distribution models to identify the distribution and key habitat features of the Oscura Mountains chipmunk and guiding monitoring efforts
- Perkins-Taylor, 2018, Ecological factors associated with site occupancy of an endemic chipmunk, Journal of Wildlife Management, 82, 1466, 10.1002/jwmg.21506 · DOI
- Peterman, 2013, Using species distribution and occupancy modeling to guide survey efforts and assess species status, Journal for Nature Conservation, 21, 114, 10.1016/j.jnc.2012.11.005 · DOI
- Phillips, 2009, Sample selection bias and presence-only distribution models: implications for background and pseudoabsence data, Ecological Applications, 19, 181, 10.1890/07-2153.1 · DOI · Paper page
- Phillips, 2008, Modeling of species distributions with MaxEnt: new extensions and a comprehensive evaluation, Ecography, 31, 161, 10.1111/j.0906-7590.2008.5203.x · DOI · Paper page
- Phillips, 2006, Maximum entropy modeling of species geographic distributions, Ecological Modeling, 190, 231, 10.1016/j.ecolmodel.2005.03.026 · DOI · Paper page
- Radosavljevic, 2014, Making better MaxEnt models of species distributions: complexity, overfitting, and evaluations, Journal of Biogeography, 41, 629, 10.1111/jbi.12227 · DOI · Paper page
- Rivieccio, 2003, Habitat features and predictive habitat modeling for the Colorado chipmunk in southern New Mexico, Western North American Naturalist, 63, 479
- Rota, 2011, Does accounting for imperfect detection improve species distribution models?, Ecography, 34, 659, 10.1111/j.1600-0587.2010.06433.x · DOI
- Sappington, 2007, Quantifying landscape ruggedness for animal habitat analysis: a case study using bighorn sheep in the Mojave Desert, Journal of Wildlife Management, 71, 1419, 10.2193/2005-723 · DOI
- Scheele, 2017, Niche contractions in declining species: mechanisms and consequences, Trends in Ecology & Evolution, 32, 346, 10.1016/j.tree.2017.02.013 · DOI
- Schoener, 1968, The Anolis lizards of Bimini: resource partitioning in a complex fauna, Ecology, 49, 704, 10.2307/1935534 · DOI
- Shcheglovitova, 2013, Estimating optimal complexity for ecological niche models: a jackknife approach for species with small sample sizes, Ecological Modeling, 269, 9, 10.1016/j.ecolmodel.2013.08.011 · DOI
- Shoemaker, 2018, A machine-learning approach for extending classical wildlife resource selection analyses, Ecology and Evolution, 8, 3556, 10.1002/ece3.3936 · DOI
- Sikes, 2016, 2016 Guidelines of the American Society of Mammalogists for the use of wild mammals in research and education, Journal of Mammalogy, 97, 663, 10.1093/jmammal/gyw078 · DOI · Paper page
- Sullivan, 1996, Genetics, ecology, and conservation of montane populations of Colorado chipmunks (Tamias quadrivittatus), Journal of Mammalogy, 77, 951, 10.2307/1382777 · DOI
- Sullivan, 2000, Conservation ecology of the Colorado chipmunk in the Organ-San Andres-Oscura Mountains, White Sands Missile Range, New Mexico. Report to Environmental Directorate, White Sands Missile Range
- Syfert, 2013, The effects of sampling bias and model complexity on the predictive performance of MaxEnt species distribution models, PLoS ONE, 8, e55158, 10.1371/journal.pone.0055158 · DOI
- Urbina-Cardona, 2010, Ecological-niche modeling and prioritization of conservation-area networks for Mexican herpetofauna, Conservation Biology, 24, 1031, 10.1111/j.1523-1739.2009.01432.x · DOI
- Veloz, 2009, Spatially autocorrelated sampling falsely inflates measures of accuracy for presence-only niche models, Journal of Biogeography, 36, 2290, 10.1111/j.1365-2699.2009.02174.x · DOI
- Warren, 2011, Ecological niche modeling in MaxEnt: the importance of model complexity and the performance of model selection criteria, Ecological Applications, 21, 335, 10.1890/10-1171.1 · DOI · Paper page
- Warren, 2014, Incorporating model complexity and spatial sampling bias into ecological niche models of climate change risks faced by 90 California vertebrate species of concern, Diversity and Distributions, 20, 334, 10.1111/ddi.12160 · DOI
- Warren, 2008, Environmental niche equivalency versus conservatism: quantitative approaches to niche evolution, Evolution, 62, 2868, 10.1111/j.1558-5646.2008.00482.x · DOI
- Williams, 2010, Forest responses to increasing aridity and warmth in the southwestern United States, Proceedings of the National Academy of Sciences of the United States of America, 107, 21289, 10.1073/pnas.0914211107 · DOI · Paper page
Cited by
Sorted by citations
A maxent predictive model for hunter-gatherer sites in the southern pampas, argentina
Rafuse, D. J. (2021) · Open Quaternary · doi:10.5334/oq.97 · Cited by 17
Metadata
- Authors
- Perkins-Taylor, I. E., & Frey, J. K.
- Affiliations
- Department of Fish, Wildlife and Conservation Ecology, New Mexico State University, Las Cruces, NM, USA
- Venue
- Journal of Mammalogy
- Publisher
- Oxford University Press (OUP)
- Published
- 2020-06-16
- Volume
- 101
- Issue
- 4
- Pages
- 1035-1048
- ISSN
- 0022-2372
- 1545-1542
- PMC
- PMC7528646
- Cited by
- 37
- References
- 1
- Language
- en
- Funders
- Conservation Branch, Garrison Environmental Division, White Sands Missile Range
About these checks
Registry, retraction, Cites and statistics results are computed, not judged, with one exception: a printed reference that no index lists is read once by a model before it counts as a citation error. Claims are extracted by a model and kept only when their quote appears verbatim in the text; each cited source is then checked, with a model’s help, for whether it says what the claim relies on. Those verdicts can be wrong — read the claim’s quote and the cited source before relying on one.
Statistics and arithmetic are recomputed, not judged.
Confidence bands are shown only for fields calibrated on our annotated test set. None is calibrated yet, so no band is shown.
What counts as a claim ›How we measure confidence ›How we check this ›
Are you an author, or do you see a problem with this page? Request a review
