

The DOI matches its Crossref record; 57 of the 57 references it cites were found in a registry or an index.
PDL1 Regulation by p53 via miR-34
Open accessAbstract
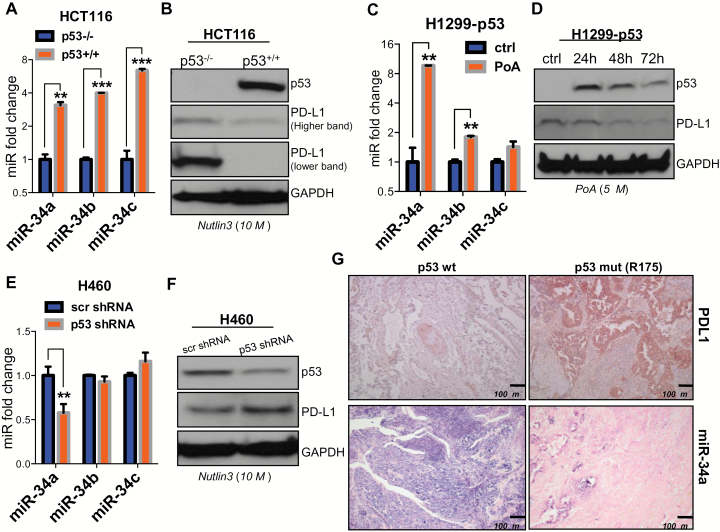
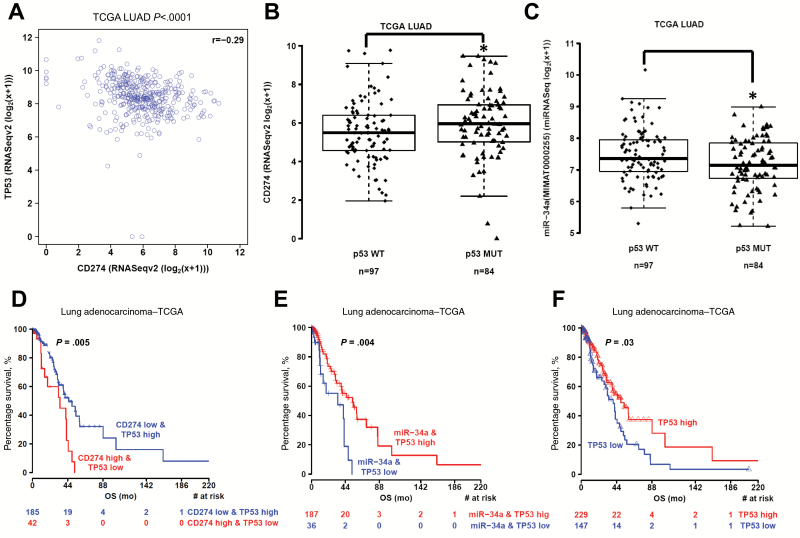
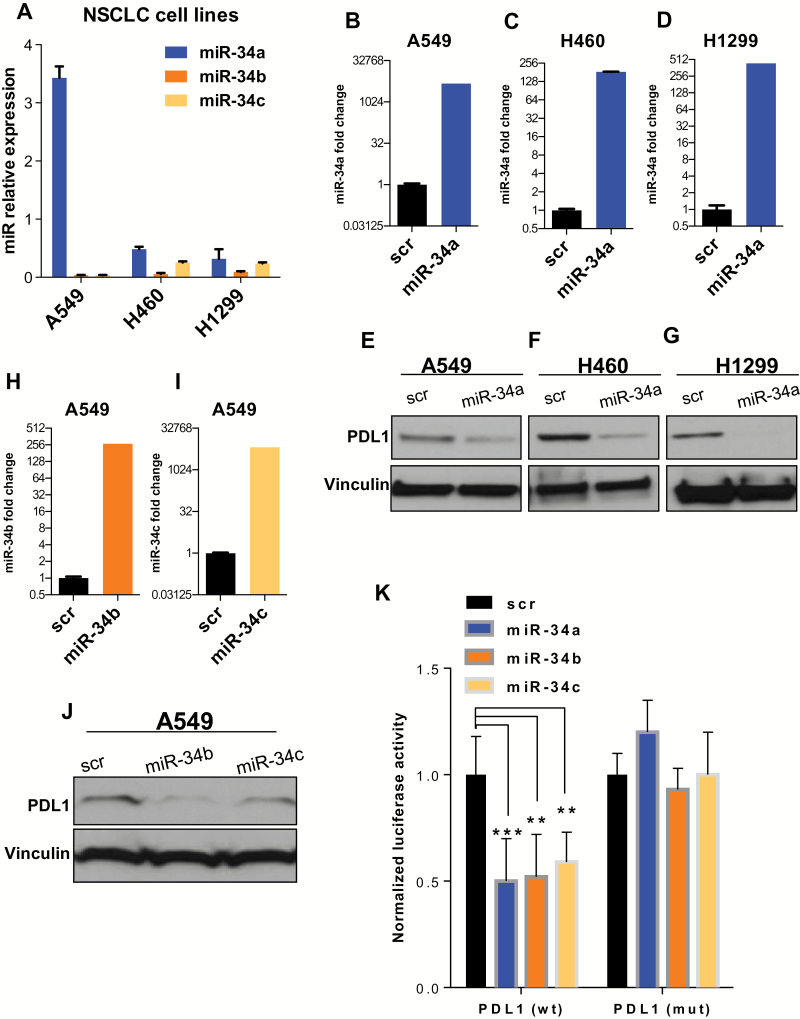
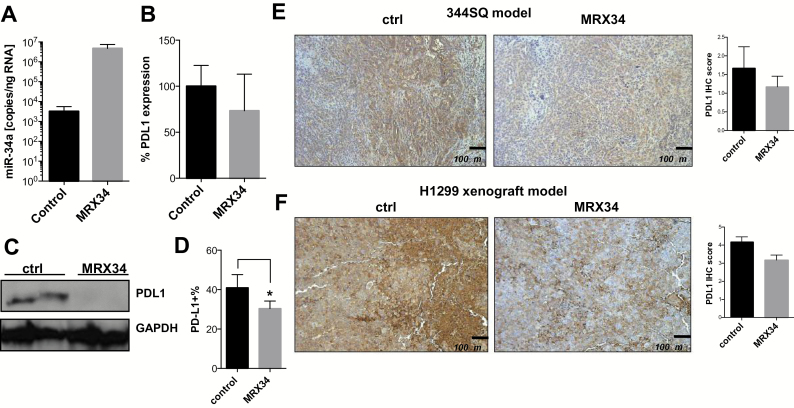
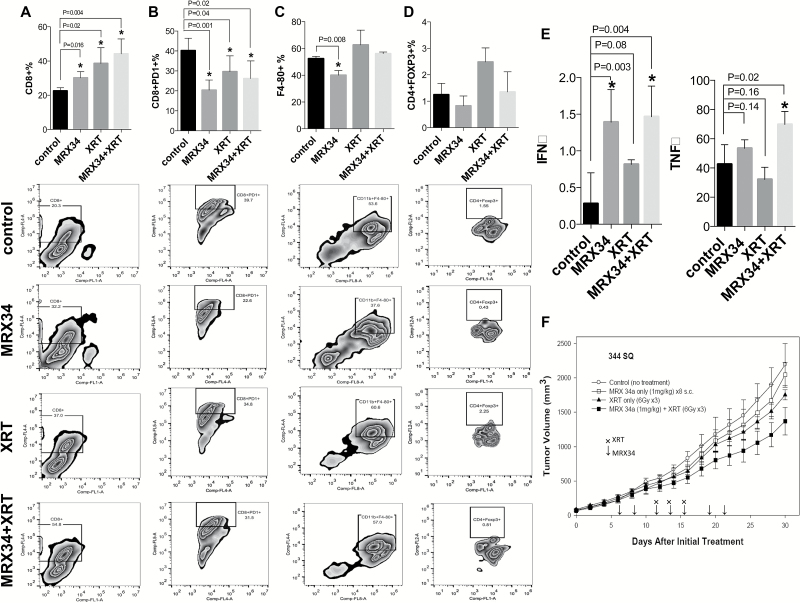
BACKGROUND: Although clinical studies have shown promise for targeting PD1/PDL1 signaling in non-small cell lung cancer (NSCLC), the regulation of PDL1 expression is poorly understood. Here, we show that PDL1 is regulated by p53 via miR-34. METHODS: p53 wild-type and p53-deficient cell lines (p53(-/-) and p53(+/+) HCT116, p53-inducible H1299, and p53-knockdown H460) were used to determine if p53 regulates PDL1 via miR-34. PDL1 and miR-34a expression were analyzed in samples from patients with NSCLC and mutated p53 vs wild-type p53 tumors from The Cancer Genome Atlas for Lung Adenocarcinoma (TCGA LUAD). We confirmed that PDL1 is a direct target of miR-34 with western blotting and luciferase assays and used a p53(R172HΔ)g/+K-ras(LA1/+) syngeneic mouse model (n = 12) to deliver miR-34a-loaded liposomes (MRX34) plus radiotherapy (XRT) and assessed PDL1 expression and tumor-infiltrating lymphocytes (TILs). A two-sided t test was applied to compare the mean between different treatments. RESULTS: We found that p53 regulates PDL1 via miR-34, which directly binds to the PDL1 3' untranslated region in models of NSCLC (fold-change luciferase activity to control group, mean for miR-34a = 0.50, SD = 0.2, P < .001; mean for miR-34b = 0.52, SD = 0.2, P = .006; and mean for miR-34c = 0.59, SD = 0.14, and P = .006). Therapeutic delivery of MRX34, currently the subject of a phase I clinical trial, promoted TILs (mean of CD8 expression percentage of control group = 22.5%, SD = 1.9%; mean of CD8 expression percentage of MRX34 = 30.1%, SD = 3.7%, P = .016, n = 4) and reduced CD8(+)PD1(+) cells in vivo (mean of CD8/PD1 expression percentage of control group = 40.2%, SD = 6.2%; mean of CD8/PD1 expression percentage of MRX34 = 20.3%, SD = 5.1%, P = .001, n = 4). Further, MRX34 plus XRT increased CD8(+) cell numbers more than either therapy alone (mean of CD8 expression percentage of MRX34 plus XRT to control group = 44.2%, SD = 8.7%, P = .004, n = 4). Finally, miR-34a delivery reduced the numbers of radiation-induced macrophages (mean of F4-80 expression percentage of control group = 52.4%, SD = 1.7%; mean of F4-80 expression percentage of MRX34 = 40.1%, SD = 3.5%, P = .008, n = 4) and T-regulatory cells. CONCLUSIONS: We identified a novel mechanism by which tumor immune evasion is regulated by p53/miR-34/PDL1 axis. Our results suggest that delivery of miRNAs with standard therapies, such as XRT, may represent a novel therapeutic approach for lung cancer.
Overview
The claims and statistics of this paper haven’t been checked yet.
Run the check — free, no account needed. It reads the open-access text and checks the sources it cites.
Integrity signals
Registry
Cites
Statistics
Figures
Verification
Claims the paper makes
The claims and statistics of this paper haven’t been checked yet.
Run the check — free, no account needed. It reads the open-access text and checks the sources it cites.
Claims other papers make about this one
Each is checked against this paper’s own text: does it say what the citing paper says it does?
The cited source says what the claim attributes to it.
In the citing paper
“In brief, the status of genes can influence tumor cells not only through the impact of wild-type gene loss but also through their effects on the TIME.”
From Recent advances in targeting the “undruggable” proteins: from drug discovery to clinical trials (2023) · cites this paper as [612]
In the citing paper
“On the other hand, activating wild-type proteins can increase IFNγ signaling and sensitize tumors to immune checkpoint inhibitors, whereas corresponding mutant proteins can reduce the efficacy of immune checkpoint inhibitors.612–614”
From Recent advances in targeting the “undruggable” proteins: from drug discovery to clinical trials (2023) · cites this paper as [612]
In the citing paper
“Some missense mutant proteins can lose the transcriptional effects of wild-type genes, such as keeping PDL1 expression levels low, thereby making cancer cells more susceptible to cytotoxic T cells and NK cells, limiting the immune system’s ability to attack cancer cells.”
From Recent advances in targeting the “undruggable” proteins: from drug discovery to clinical trials (2023) · cites this paper as [612]
Self-check
Percentages, sums and reported differences re-computed from the paper’s own numbers.
The self-check needs the paper’s full text.
Citations
Cites
PD-1 and PD-L1 Immune Checkpoint Blockade to Treat Breast Cancer
Hartkopf, A. D., Taran, F., Wallwiener, M., Walter, C. B., Krämer, B., Grischke, E., & Brucker, S. Y. (2016) · Breast Care · doi:10.1159/000453569 · Cited by 30,989
The blockade of immune checkpoints in cancer immunotherapy
Pardoll, D. M. (2012) · Nature Reviews Cancer · doi:10.1038/nrc3239 · Cited by 13,838
Safety, activity, and immune correlates of anti–PD-1 antibody in cancer
Topalian, S. L., Hodi, F. S., Brahmer, J. R., Gettinger, S. N., Smith, D. C., McDermott, D. F., Powderly, J. D., Carvajal, R. D., Sosman, J. A., Atkins, M. B., et al. (2012) · New England Journal of Medicine · doi:10.1056/nejmoa1200690 · Cited by 12,628
Safety and activity of anti-PD-L1 antibody in patients with advanced cancer
Brahmer, J. R., Tykodi, S. S., Chow, L. Q. M., Hwu, W.-J., Topalian, S. L., Hwu, P., Drake, C. G., Camacho, L. H., Kauh, J., Odunsi, K., et al. (2012) · New England Journal of Medicine · doi:10.1056/nejmoa1200694 · Cited by 7,945
Comprehensive molecular profiling of lung adenocarcinoma
The Cancer Genome Atlas Research Network (2014) · Nature · doi:10.1038/nature13385 · Cited by 5,732
Wherry, E. J. (2011) · Nature Immunology · doi:10.1038/ni.2035 · Cited by 4,062 · cited 2×
“Previous studies have suggested that PD1/PDL1 signaling induces T-cell exhaustion, a process described broadly as dysfunction and subsequent physical deletion of specific T-cells and more specifically as changed intratumoral levels of CD8+ T-cells, macrophages, MDSCs, and dendritic cells (47).”
BackgroundRestoring function in exhausted CD8 T cells during chronic viral infection
Barber, D. L., Wherry, E. J., Masopust, D., Zhu, B., Allison, J. P., Sharpe, A. H., Freeman, G. J., & Ahmed, R. (2005) · Nature · doi:10.1038/nature04444 · Cited by 4,057
Widespread changes in protein synthesis induced by microRNAs
Selbach, M., Schwanhäusser, B., Thierfelder, N., Fang, Z., Khanin, R., & Rajewsky, N. (2008) · Nature · doi:10.1038/nature07228 · Cited by 3,429
Iwai, Y., Ishida, M., Tanaka, Y., Okazaki, T., Honjo, T., & Minato, N. (2002) · Proceedings of the National Academy of Sciences · doi:10.1073/pnas.192461099 · Cited by 3,261
Requirement for p53 and p21 to Sustain G 2 Arrest After DNA Damage
Bunz, F., Dutriaux, A., Lengauer, C., Waldman, T., Zhou, S., Brown, J. P., Sedivy, J. M., Kinzler, K. W., & Vogelstein, B. (1998) · Science · doi:10.1126/science.282.5393.1497 · Cited by 2,803
Research works printed but not linked: 1
- 1998, Requirement for p53 and p21 to sustain G2 arrest after DNA damage, Science, 282, 1497
Cited by
Sorted by citations
Items 601–685 of 685
Mechanisms of impaired expression of p53-responsive microRNA genes in diffuse B-large cell lymphoma
Voropaeva, E. N., Pospelova, T. I., Churkina, M. I., Гуражева, А. А., Валерьевна, Б. О., & Maksimov, V. N. (2023) · Advances in molecular oncology · doi:10.17650/2313-805x-2023-10-3-72-81 · Cited by 1
Bednarska, K., Thillaiyampalam, G., Mujaj, S., Nourse, J., Gunawardana, J., Sabdia, M., Law, S., Pilaar, A., Cui, Q., de Long, L. M., et al. (2024) · Acta Haematologica · doi:10.1159/000536044 · Cited by 2
Identify Non-mutational p53 Functional Deficiency in Human Cancers
Li, Q., Zhang, Y., Luo, S., Zhang, Z., Oberg, A. L., Kozono, D., Lu, H., Sarkaria, J. N., Ma, L., & Wang, L. (2024) · Genomics Proteomics & Bioinformatics · doi:10.1093/gpbjnl/qzae064 · Cited by 2
Multifactorial regulators of tumor programmed death-ligand 1 (PD-L1) response
Dorand, R. D., Petrošiūtė, A., & Huang, A. Y.-C. (2017) · Translational Cancer Research · doi:10.21037/tcr.2017.11.08 · Cited by 1
P53 in Head and Neck Squamous Cell Carcinoma
Parameswaran, J., & Burtness, B. A. (2018) · Current cancer research · doi:10.1007/978-3-319-78762-6_9 · Cited by 1
Mustafa, D. A. M., Pedrosa, R. M. S. M., & Kros, J. M. (2019) · Springer eBooks · doi:10.1007/978-3-030-23417-1_2 · Cited by 1
Radiothérapie et immunothérapie : nouveau standard, nouvelles options
Giraud, N., & Giraud, P. (2019) · Revue des Maladies Respiratoires Actualités · doi:10.1016/s2096-5192(19)30156-9 · Cited by 1
Wang, B., Wang, L., Mao, J., Wen, H., Xu, L., Ren, Y., Du, H., & Yang, H. (2020) · Molecular Medicine Reports · doi:10.3892/mmr.2020.11025 · Cited by 1
Papel de los microARN en la patogénesis del cáncer de próstata
Fernández, M. J., Quintero, M. C. G., Lizcano, G. A. M., Cano, O. E., & García, Y. G. (2021) · CES Medicina · doi:10.21615/cesmedicina.35.1.3 · Cited by 1
Biomarkers for Cancer Immunotherapy
Ahsan, H., Islam, S. U., Ahmed, M. B., Lee, Y. S., Qayum, M., & Sonn, J. K. (2022) · Springer eBooks · doi:10.1007/978-981-16-5759-7_9 · Cited by 1
Mechanisms of PD-L1 Regulation in Tumor Immune Ecosystem
Bangash, F., Alia, S., & Gul, R. (2022) · Journal of Biomedical Research & Environmental Sciences · doi:10.37871/jbres1525 · Cited by 1
Current and Emerging Bone-Targeted Therapies for The Treatment of Bone Metastases From Solid Tumors
Clézardin, P., Sousa, S., Croset, M., Pantano, F., & Confavreux, C. B. (2019) · Elsevier eBooks · doi:10.1016/b978-0-12-801238-3.62257-2 · Cited by 1
Fu, X., Zhao, H., Chen, C.-Z., Wang, K., Gao, F., Tian, Y.-Z., Li, H., & Zhao, H. (2020) · bioRxiv (Cold Spring Harbor Laboratory) · doi:10.1101/2020.04.06.027326 · Cited by 1
IL-1β mediates miR-34a promotes bovine endometritis via LGR4-NF-κB axisPreprint
Ma, X., Yin, B., Guo, S., Umar, T., Liu, J., Wu, Z., Zhou, Q., Zahoor, A., & Deng, G. (2021) · Research Square · doi:10.21203/rs.3.rs-416971/v1 · Cited by 1
P53 is a direct regulator of the immune co-stimulatory molecule CD80Preprint
Alibo, E., Mollaoglu, G., Dhainaut, M., Zhao, R., Rose, S. A., Baccarini, A., Parsons, R. E., & Brown, B. D. (2021) · bioRxiv (Cold Spring Harbor Laboratory) · doi:10.1101/2021.05.24.445214 · Cited by 1
Munker, R., Shackelford, R. E., & Călin, G. A. (2016) · Encyclopedia of Life Sciences · doi:10.1002/9780470015902.a0023161.pub2 · Cited by 1
Sensitizing Immune-Refractory Ovarian Tumors via p53 Mutation-Tailored ImmunotherapyPreprint
Chatterjee, R., Nieves, A. S., Truong, A. N., Lindzen, M., Ozmen, F., Cherry, C., Zwicky, P., Mukherjee, S., Selvadurai, B.-R., Salame, T. M., et al. (2025) · bioRxiv (Cold Spring Harbor Laboratory) · doi:10.1101/2025.06.23.661120 · Cited by 1
Clinical Relevance, Prognostic Potential, and Therapeutic Strategies of Noncoding RNAs in Cancer
Bhome, R., House, L. M., Emo, K., Sayan, E., & Mirnezami, A. H. (2017) · Elsevier eBooks · doi:10.1016/b978-0-12-811022-5.00023-1
ENHANCING RADIATION SENSITIVITY IN NON-SMALL CELL LUNG CANCER
Wang, Y. (2018) · Digital Commons-TMC (Texas Medical Center)
Grenda, A., Kuźnar-Kamińska, B., Krzyżanowska, N., Krawczyk, P. A., Janiszewska, M., Batura‐Gabryel, H., & Milanowski, J. (2021) · Research Square · doi:10.21203/rs.3.rs-140418/v1
MDM2 inhibitors: Targeting p53-MDM2 interaction to anti-cancer
Zhang, X. (2021) · E3S Web of Conferences · doi:10.1051/e3sconf/202130802015
Francisco de Orellana: el hombre que vió a las amazonas
Esparza, J. J. (2012) · Epoca
MicroRNAs and their role in immunogenetic-dysregulation
Wani, J. A., Ali, S., Khan, I. S., Khan, M. S., Ali, S., Majid, S., & Rehman, M. U. (2021) · Elsevier eBooks · doi:10.1016/b978-0-323-90053-9.00005-1
Pathophysiology roles and translational opportunities of miRNAs in mesothelioma
Casalone, E., Allione, A., & Matullo, G. (2022) · Elsevier eBooks · doi:10.1016/b978-0-12-822287-4.00024-4
MicroRNAs as potential immunotherapeutic modulators in cancer
Wani, J. A., Majid, S., Rehman, M. U., Khan, M. S., & Qadir, J. (2022) · Elsevier eBooks · doi:10.1016/b978-0-323-90250-2.00008-x
Xu, W.-Q., Ye, J., & Chen, T. (2022) · Chinese Medical Sciences Journal · doi:10.24920/003966
Higashi, K., Ogawa, T., Saiki, Y., Ishikawa, T., Kobayashi, Y., Ohkoshi, A., Nakanome, A., Katori, Y., & Horii, A. (2020) · doi:10.21203/rs.3.rs-25255/v1
Salem, R. A., Nageeb, L. N. M., Abu-Zeid, R. M., Raboh, N. M. A., & Elrashedy, M. M. (2022) · Open Access Macedonian Journal of Medical Sciences · doi:10.3889/oamjms.2022.9195
TTC39C may be a new target for the treatment of lung adenocarcinomaPreprint
Rong, H., Jun, P., Ma, K., Zhu, J., & He, J. (2022) · Research Square · doi:10.21203/rs.3.rs-1839531/v1
Biomarkers predicting the effect of immunotherapy: what you need to know in practice?
Konstantinova, A. M. (2022) · Practical oncology · doi:10.31917/2302081
Mutation profile of diffuse large B-cell lymphoma with relapses in the central nervous system
Voropaeva, E. N., Pospelova, T. I., Karpova, V., Churkina, M. I., Vyatkin, Y. V., Ageeva, T. A., & Maksimov, V. N. (2022) · Advances in molecular oncology · doi:10.17650/2313-805x-2022-9-3-69-84
Liu, Y., Wang, Z., Tang, Z., Fu, Y. S., & Wang, L. (2022) · Research Square · doi:10.21203/rs.3.rs-2209482/v1
MicroRNAs in the Immunopathology and Treatment of Non-small Cell Lung Cancer
Klimenko, O. V., & Sidorov, A. (2022) · Interdisciplinary cancer research · doi:10.1007/16833_2022_53
Bednarska, K., Thillaiyampalam, G., Mujaj, S., Nourse, J., Gunawardana, J., Sabdia, M., Cui, Q.-Y., de Long, L. M., Vari, F., Gandhi, M., et al. (2023) · bioRxiv · doi:10.1101/2023.02.26.530063
Wei, M., Liu, Y., Zhi, J., Li, L., Zhang, S., & Wang, W. (2023) · Research Square · doi:10.21203/rs.3.rs-2552100/v1
Wang, H. Q., Mulford, I. J., Sharp, F. A., Liang, J., Kurtuluş, S., Trabucco, G. M., Quinn, D. S., Longmire, T. A., Patel, N., Patil, R. A., et al. (2023) · doi:10.1158/0008-5472.c.6513468.v1
Epigenetic therapy in lung cancer
Conroy, M. R., O’Connor, Á., Bailey‐Whyte, M., & Dowling, C. M. (2023) · Elsevier eBooks · doi:10.1016/b978-0-323-91367-6.00004-0
Luo, X., Zhang, Z., Wang, Y., Sun, M., Hu, D. X., Jiang, J., Wang, Y., Ji, X., Chen, X., Zhang, B., et al. (2023) · Research Square · doi:10.21203/rs.3.rs-3205248/v1
Jiang, S. X., Macaulay, R. J. B., Ahmed, K. A., Etame, A. B., & Yu, H.-H. M. (2023) · Cureus · doi:10.7759/cureus.43528
Ingelshed, K., Melssen, M. M., Chandramohan, A., Partridge, A. W., Jiang, L., Wermeling, F., Lane, D. P., Nestor, M., & Spiegelberg, D. (2023) · SSRN Electronic Journal · doi:10.2139/ssrn.4594901
Restoration of Tumor Suppression to Cancer Carrying p53 Mutations
Amin, M. N., & Liu, Y. (2023) · IntechOpen eBooks · doi:10.5772/intechopen.1003642
Li, H., Yang, L., Wang, Y., Wang, L., Chen, G., Zhang, L., & Wang, D. (2023) · Figshare · doi:10.6084/m9.figshare.22655388
Liu, S., Wu, Z., Yuan, Y., Lin, Z., Zuo, D., Niu, Y., Li, B., Yuan, Y., & Qiu, J. (2024) · Research Square · doi:10.21203/rs.3.rs-4485605/v1
Динаровна, А. Д., Gilyazova, I. R., Ivanova, E. A., Михайловна, И. С., Gilyazova, G. R., Павлов, В. Н., & Хуснутдинова, Э. К. (2024) · Генетика · doi:10.31857/s0016675824030107
Efficacy analysis of targeted P53 therapy in solid tumors
Wang, P., & Wang, F. (2025) · Medical Oncology · doi:10.1007/s12032-025-02930-y
p53 Correlation with Triple-negative Breast Cancer and Potential Treatments
Bi, Y. (2025) · Transactions on Materials Biotechnology and Life Sciences · doi:10.62051/q0djfh23
Epigenetic activation of CD274/PD-L1 by the MSL complex expands its role beyond dosage compensation
Wen, A., Feng, X., Li, Y., Cui, X.-L., Zou, Q., Cai, Y., Jin, J., & He, Y. (2025) · Frontiers in Immunology · doi:10.3389/fimmu.2025.1711451
Song, M., Cheng, H., Zou, H., Ma, K., Lu, L., Wei, Q., Xu, Z., Tang, Z., Zhang, Y., Wang, Y., et al. (2024) · Figshare · doi:10.6084/m9.figshare.25954962
Song, M., Cheng, H., Zou, H., Ma, K., Lu, L., Wei, Q., Xu, Z., Tang, Z., Zhang, Y., Wang, Y., et al. (2024) · Figshare · doi:10.6084/m9.figshare.25955010
Li, H., Yang, L., Wang, Y., Wang, L., Chen, G., Zhang, L., & Wang, D. (2023) · Figshare · doi:10.6084/m9.figshare.22655394
Li, H., Yang, L., Wang, Y., Wang, L., Chen, G., Zhang, L., & Wang, D. (2023) · Figshare · doi:10.6084/m9.figshare.22655391
Li, H., Yang, L., Wang, Y., Wang, L., Chen, G., Zhang, L., & Wang, D. (2023) · Figshare · doi:10.6084/m9.figshare.22655385
Martinkova, L., Zatloukalová, P., Kucerikova, M., Friedlová, N., Tylichová, Z., Zavadil-Kokas, F., Hupp, T. R., Coates, P. J., & Vojtesek, B. (2024) · Figshare · doi:10.6084/m9.figshare.26952316
The Role of miR-34a in Predicting the Efficacy of Immunotherapy in Clear Cell Renal Cell Carcinoma
Динаровна, А. Д., Измайлов, А. А., Popova, E. V., Ivanova, E. A., Михайловна, И. С., Павлов, В. Н., Khusnutdinova, E. K., & Gilyazova, I. R. (2025) · Russian Journal of Genetics · doi:10.1134/s1022795425701248
Therapeutic Approach with Tumor Suppressor miRNA
Joon, A., & Jalandra, R. (2026) · Springer eBooks · doi:10.1007/978-981-95-5989-3_5
Regulatory T cells in ovarian cancer: Insights into cancer immunotherapy
Chang, Y., Yu, J., Qiu, Z., Zhang, J., Yang, Z., He, J., Li, N., & Wang, H. B. (2026) · Critical Reviews in Oncology/Hematology · doi:10.1016/j.critrevonc.2026.105237
Fountzilas, C. K., Rosario, S. R., Witkiewicz, A. K., Withers, H. G., Bajor, D. L., Mukherjee, S., Saltzman, J. N., Maguire, O., Minderman, H., Chatley, S., et al. (2026) · International Journal of Cancer · doi:10.1002/ijc.70434
MicroRNA prognostic markers for immune checkpoint inhibitor success in urologic cancers
Vlachostergios, P. J., Evmorfopoulos, K., Marsitopoulos, K., Tamposis, I., Samara, M., Thodou, E., Sarantis, P., Matthaios, D., Karamouzis, M. V., Tzortzis, V., et al. (2026) · Immunotherapy · doi:10.1080/1750743x.2026.2640756
Aktar, S., Masoudi, M., Moti, D., Gopalan, V., Islam, F., & Lam, A. K.-Y. (2026) · Cancer Medicine · doi:10.1002/cam4.71683 · Cited by 1
Migault, M. (2017) · theses.fr (ABES) · doi:10.70675/55b7d871z6f9fz4039zaa17zaa0e82d57845
Role of NF90 in the miRNA pathway
Grasso, G. I. (2021) · theses.fr (ABES) · doi:10.70675/aa0f4660z0f16z414az9ea3z20b3d4fa53ab
Genetic and Epigenetic Regulation of Immune Checkpoints
Tayebi, L., & Abdolmaleki, M. (2026) · Springer eBooks · doi:10.1007/978-981-95-8026-2_3
The role of YY1 in promoting cancer immune evasion
Li, M., Zhang, J., Fan, R., Liu, M., Li, D., & Sui, G. (2026) · Biochimica et Biophysica Acta (BBA) - Reviews on Cancer · doi:10.1016/j.bbcan.2026.189595
Insight of immune checkpoint blockades in melanoma: mechanism and clinical translation
Zhang, Q., Yuan, C., Zhu, L., Zheng, S., Xu, Y., 车炫霖, Xiao, S., Liu, J., Hong, L., Li, H., et al. (2026) · Molecular Cancer · doi:10.1186/s12943-026-02694-7
The role of epigenetic alterations in lung cancer progression
Kaushik, S., Khanna, S., Ghorawat, P., Baboo, P., Sharma, S., Panwar, R., Tak, J., & Srivastava, T. (2026) · Elsevier eBooks · doi:10.1016/b978-0-443-45146-1.00018-7
Chen, Y.-L., Lin, B., (14149), X. C., Liu, X.-P., & Huang, J.-S. (2026) · World Journal of Gastroenterology · doi:10.3748/wjg.117677
Karami, R., Najafi, E., Babaei, A., Shahdoust, E., Shaghaghi, A., Dashatan, N. A., Motlagh, B., Koushki, M., & Khodabandehloo, H. (2026) · Cancer Biomarkers · doi:10.1177/18758592261429266
da Silva, S. P., Oliveira, J., Santos, L. L., Xavier, C. P. R., & Vasconcelos, M. H. (2026) · Biochimica et Biophysica Acta (BBA) - Reviews on Cancer · doi:10.1016/j.bbcan.2026.189664
D'Amato, M., Morritti, M., Morelli, F., Ciuffreda, L., Castelvetere, M., Mangiacotti, F., Pasculli, B., & Parrella, P. (2026) · Frontiers in Oncology · doi:10.3389/fonc.2026.1842762
Targeting Immune Checkpoint Proteins in Cancer Therapy and the Potential of RNAi-Based Immunotherapy
Wang, K. K., & Yu, A. (2026) · Pharmaceuticals · doi:10.3390/ph19081212
Zhou, X., Pang, T., & Ge, Z. (2026) · International Journal of Molecular Sciences · doi:10.3390/ijms27156918
Clonal LIMD1 loss drives PD-L1 immune evasion via ARIH1-dependent ubiquitination in lung cancer
Shah, K., Kennedy, P. T., Black, J. R., Pawlik, P., Litchfield, K., Thakkar, K., G., M. F. C., Brooksbank, K., Yuan, O., Grevitt, P., et al. (2026) · Life Science Alliance · doi:10.26508/lsa.202603812
Nath, P., Khandelwal, A. R., Li, C., Moore‐Medlin, T., Vasudevan, S. S., Alvarez, V. A., Franco, O. E., Gutkind, J. S., & Nathan, C. O. (2026) · Neoplasia · doi:10.1016/j.neo.2026.101350
Khan, I. A., Gupta, S., & Meena, J. P. (2026) · Journal of Human Genetics · doi:10.1038/s10038-026-01505-7
Chakraborty, S., Mukherjee, S., Ghosh, S., Basak, U., Mukherjee, S., Adhikary, A., Sa, G., & Das, T. (2026) · APOPTOSIS · doi:10.1007/s10495-026-02409-9
Biltekin, E., & Özpolat, B. (2026) · Non-Coding RNA · doi:10.3390/ncrna12050034
Omer, S., Ouifki, R., & Mambili‐Mamboundou, H. (2026) · Mathematical Biosciences · doi:10.1016/j.mbs.2026.109806
Augustin, I. G., Birceanu, A., Mazilu, L., Manolache, V., & Constantinescu, I. (2026) · The Journal of Liquid Biopsy · doi:10.1016/j.jlb.2026.100497
Kaymaz, T. (2026) · Turkish Journal of Science and Technology · doi:10.55525/tjst.1989356
Spagnolo, C. C., Campo, I., Fassi, E., Nucera, F., Ruggeri, P., Muscolino, P., Infurna, C., Ieni, A., Gregorc, V., Lazzari, C., et al. (2026) · Immunotherapy · doi:10.1080/1750743x.2026.2738337
Metadata
- Authors
- Cortez, M. A., Ivan, C., Valdecanas, D., Wang, X., Peltier, H. J., Ye, Y., Araujo, L., Carbone, D. P., Shilo, K., Giri, D. K., Kelnar, K., Martin, D., Komaki, R., Gomez, D. R., Krishnan, S., Calin, G. A., Bader, A. G., & Welsh, J. W.
- Affiliations
- The University of Texas MD Anderson Cancer Center (US)
- Corresponding author
- Welsh, James W.
- ORCID
- Venue
- JNCI: Journal of the National Cancer Institute
- Publisher
- Oxford University Press (OUP)
- Published
- 2015-11-17
- Volume
- 108
- Issue
- 1
- ISSN
- 0027-8874 (ISSN-L)
- 1460-2105
- PMC
- PMC4862407
- OpenAlex
- W2173135538
- Cited by
- 683
- References
- 57
- Citations by year
- 2026: 42 · 2025: 53 · 2024: 72 · 2023: 66 · 2022: 72 · 2021: 94 · 2020: 86 · 2019: 61 · 2018: 62 · 2017: 50 · 2016: 24
- FWCI
- 19.80
- Type
- journal article
- Language
- en
- Open access
- bronze
- doi.org
- Locations
- JNCI Journal of the National Cancer Institute (publishedVersion)
- PubMed Central (publishedVersion, cc-by)
- PubMed (publishedVersion)
- HighWire Press Open Archive (submittedVersion)
- Funders
- U.S. Department of Defense (W81XWH0610303, W81XWH, W81XWH-07-1-03060)
- Cancer Prevention and Research Institute of Texas (CA016672)
- Doctors Cancer Foundation
- Lung Cancer Research Foundation
- National Institutes of Health (UH2TR000943, W81XWH, CA- 016672, 1UH2TR00943-01)
- University of Texas MD Anderson Cancer Center ((CA016672), grant CA016672)
- National Cancer Institute (Grant CA016672, CA 016672, CA016672 to, 1UH2TR00943-01, R01CA182905, P30CA016672)
- National Center for Advancing Translational Sciences (1UH2TR00943-01)
- Topics
- Health Sciences › Medicine › Oncology › Cancer Immunotherapy and Biomarkers
- Life Sciences › Biochemistry, Genetics and Molecular Biology › Cancer Research › MicroRNA in disease regulation
- Health Sciences › Medicine › Oncology › Cancer-related Molecular Pathways
- Keywords
- PD-L1, p53, miR-34, non-small cell lung cancer, lung adenocarcinoma, miR-34a, miR-34b, miR-34c, 3' untranslated region, tumor-infiltrating lymphocytes, radiotherapy, immune checkpoint, TP53 mutation
- MeSH terms
- Adenocarcinoma of Lung, Adenocarcinoma, Animals, Carcinoma, Non-Small-Cell Lung, Liposomes, Lung Neoplasms, Neoplasms, Experimental, Gene Expression Regulation, Neoplastic, Tumor Suppressor Protein p53, CD8 Antigens, MicroRNAs, Cell Line, Tumor, Cell Proliferation, Mice, B7-H1 Antigen
About these checks
Registry, retraction, Cites and statistics results are computed, not judged, with one exception: a printed reference that no index lists is read once by a model before it counts as a citation error. Claims are extracted by a model and kept only when their quote appears verbatim in the text; each cited source is then checked, with a model’s help, for whether it says what the claim relies on. Those verdicts can be wrong — read the claim’s quote and the cited source before relying on one.
Statistics and arithmetic are recomputed, not judged.
Confidence bands are shown only for fields calibrated on our annotated test set. None is calibrated yet, so no band is shown.
What counts as a claim ›How we measure confidence ›How we check this ›
Are you an author, or do you see a problem with this page? Request a review
