

BRENDA, the ELIXIR core data resource in 2021: new developments and updates
Open accessThe DOI matches its Crossref record; 38 of the 40 references it cites were found in a registry or an index.
Abstract
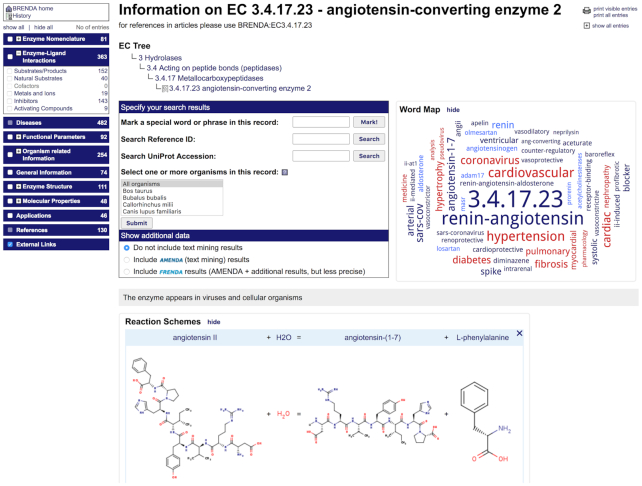
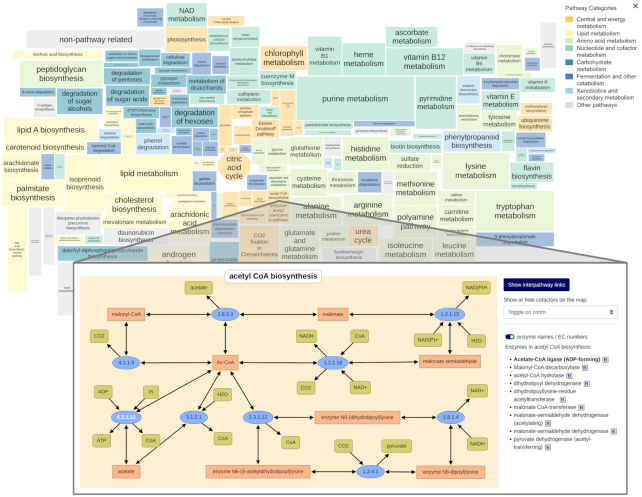
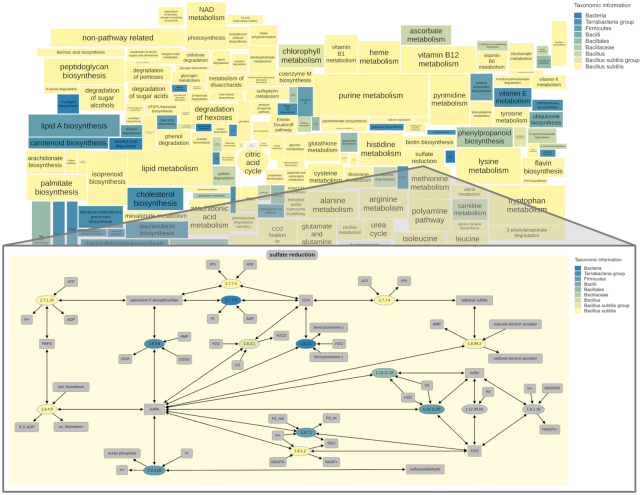
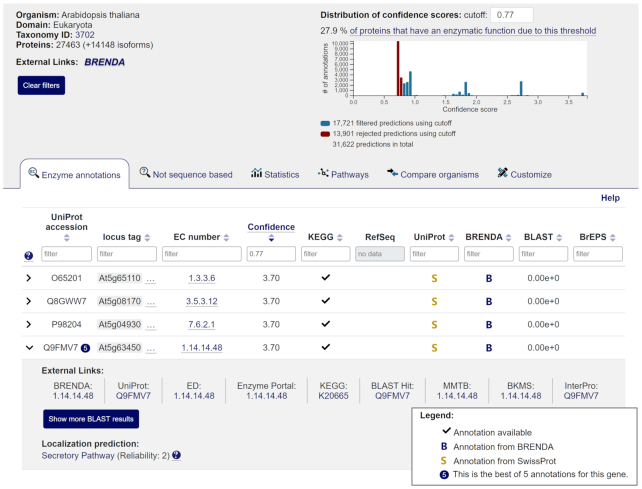
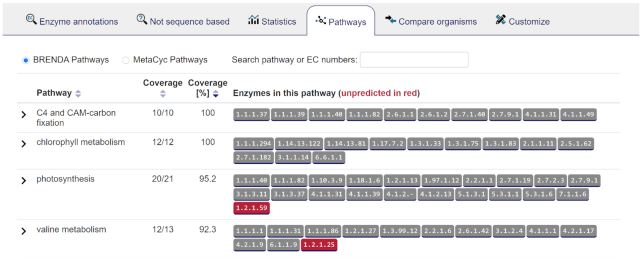
The BRENDA enzyme database (https://www.brenda-enzymes.org), established in 1987, has evolved into the main collection of functional enzyme and metabolism data. In 2018, BRENDA was selected as an ELIXIR Core Data Resource. BRENDA provides reliable data, continuous curation and updates of classified enzymes, and the integration of newly discovered enzymes. The main part contains >5 million data for ∼90 000 enzymes from ∼13 000 organisms, manually extracted from ∼157 000 primary literature references, combined with information of text and data mining, data integration, and prediction algorithms. Supplements comprise disease-related data, protein sequences, 3D structures, genome annotations, ligand information, taxonomic, bibliographic, and kinetic data. BRENDA offers an easy access to enzyme information from quick to advanced searches, text- and structured-based queries for enzyme-ligand interactions, word maps, and visualization of enzyme data. The BRENDA Pathway Maps are completely revised and updated for an enhanced interactive and intuitive usability. The new design of the Enzyme Summary Page provides an improved access to each individual enzyme. A new protein structure 3D viewer was integrated. The prediction of the intracellular localization of eukaryotic enzymes has been implemented. The new EnzymeDetector combines BRENDA enzyme annotations with protein and genome databases for the detection of eukaryotic and prokaryotic enzymes.
Overview
The claims and statistics of this paper haven’t been checked yet.
Free: it reads the open-access text and checks the first 5 claims that cite a source we can check. Create a free account to check every claim.
Integrity signals
Registry
Cites
Statistics
Figures


Verification
Claims the paper makes
The claims and statistics of this paper haven’t been checked yet.
Free: it reads the open-access text and checks the first 5 claims that cite a source we can check. Create a free account to check every claim.
Claims other papers make about this one
Each is checked against this paper’s own text: does it say what the citing paper says it does?
The source backs part of the claim, not all of it — or backs it for a different population, condition or comparison.
In the citing paper
“The amidotransferase had a lower affinity for the ASN according to parameters found in BRENDA (Chang et al., 2021).”
From Fundamental behaviors emerge from simulations of a living minimal cell (2022) · cites this paper as Chang et al., 2021
Experimental — accuracy not yet measuredThe cited source says what the claim attributes to it.
In the citing paper
“Kinetic parameters for the majority of the cellular reactions have been measured in related organisms through decades of biochemical, single-molecule (sm) FRET, and spectroscopic studies reported in the literature and kinetic databases like Bremer and Dennis (2008), BRENDA (Chang et al., 2021), and equilibrium constants reported in NIST’s TECRdb (Goldberg et al., 2004) and Equilibrator (Flamholz”
From Fundamental behaviors emerge from simulations of a living minimal cell (2022) · cites this paper as Chang et al., 2021
Self-check
Percentages, sums and reported differences re-computed from the paper’s own numbers.
The self-check needs the paper’s full text.
Citations
Cites
Basic local alignment search tool
Altschul, S. F., Gish, W., Miller, W., Myers, E. W., & Lipman, D. J. (1990) · Journal of Molecular Biology · doi:10.1006/jmbi.1990.9999 · Cited by 98,669
Cytoscape: A software Environment for integrated models of biomolecular interaction networks
Shannon, P., Markiel, A., Ozier, O., Baliga, N. S., Wang, J. T., Ramage, D., Amin, N., Schwikowski, B., & Ideker, T. (2003) · Genome Research · doi:10.1101/gr.1239303 · Cited by 51,888
Database resources of the National Center for Biotechnology Information: update
Wheeler, D. L. (2004) · Nucleic Acids Research · doi:10.1093/nar/gkh073 · Cited by 10,641
KEGG: new perspectives on genomes, pathways, diseases and drugs
Kanehisa, M., Furumichi, M., Tanabe, M., Sato, Y., & Morishima, K. (2017) · Nucleic Acids Research · doi:10.1093/nar/gkw1092 · Cited by 8,865
UniProt: a worldwide hub of protein knowledge
The UniProt Consortium (2019) · Nucleic Acids Research · doi:10.1093/nar/gky1049 · Cited by 7,698
O'Leary, N. A., Wright, M. W., Brister, J. R., Ciufo, S., Haddad, D., McVeigh, R., Rajput, B., Robbertse, B., Smith-White, B., Ako-Adjei, D., et al. (2016) · Nucleic Acids Research · doi:10.1093/nar/gkv1189 · Cited by 6,357
Predicting Subcellular Localization of Proteins Based on their N-terminal Amino Acid Sequence
Emanuelsson, O., Nielsen, H., Brunak, S., & von Heijne, G. (2000) · Journal of Molecular Biology · doi:10.1006/jmbi.2000.3903 · Cited by 4,263
A hidden Markov model for predicting transmembrane helices in protein sequences.
Sonnhammer, E. L. L., von HEIJNE, G., & Krogh, A. (1998) · PubMed · Cited by 2,505
Improvements to PATRIC, the all-bacterial Bioinformatics Database and Analysis Resource Center
Wattam, A. R., Davis, J. J., Assaf, R., Boisvert, S., Brettin, T., Bun, C., Conrad, N., Dietrich, E. M., Disz, T., Gabbard, J. L., et al. (2017) · Nucleic Acids Research · doi:10.1093/nar/gkw1017 · Cited by 1,657
Database resources of the National Center for Biotechnology Information
Coordinators, N. R., Agarwala, R., Barrett, T., Beck, J., Benson, D. A., Bollin, C., Bolton, E., Bourexis, D., Brister, J. R., Bryant, S. H., et al. (2018) · Nucleic Acids Research · doi:10.1093/nar/gkx1095 · Cited by 1,502
Cited by
Items 401–500 of 801
Otani, S., Jespersen, M. L., Brinch, C., Møller, F. D., Pilgaard, B., Jensen, E. E. B., Leekitcharoenphon, P., Svendsen, C. A., Aarestrup, A. H., Sonda, T., et al. (2025) · Gut Microbes · doi:10.1080/19490976.2025.2484385 · Cited by 5
AI ‐Driven Variant Annotation for Precision Oncology in Breast Cancer
Shukla, K., Wang, Y., Spanheimer, P. M., & Brunk, E. (2025) · Clinical and Translational Science · doi:10.1111/cts.70350 · Cited by 4
Arumugam, K., Malathi, S., Anand, D., Anand, S., & Radhakrishnan, S. V. (2022) · Methods in molecular biology · doi:10.1007/978-1-0716-2305-3_10 · Cited by 4
Hagemann, A., Tasillo, S., Aydin, A., Kehrenberg, M. C. A., & Bachmann, H. S. (2022) · Cell Communication and Signaling · doi:10.1186/s12964-022-00929-w · Cited by 4
S-adenosyl- l -methionine interaction signatures in methyltransferases
Kadam, M. S., & Burra, P. V. L. S. (2023) · Journal of Biomolecular Structure and Dynamics · doi:10.1080/07391102.2023.2217679 · Cited by 4
Fan, X., Cao, L., & Yan, X. (2023) · Biotechnology and Bioengineering · doi:10.1002/bit.28493 · Cited by 4
Gama, M. D. V. F., Alexandre, Y. D. N., da Silva, J. M. P., de Castro, D. P., & Genta, F. A. (2023) · Frontiers in Physiology · doi:10.3389/fphys.2023.1123414 · Cited by 4
Bucksot, J. E., Ritchie, K., Biancalana, M., Cole, J. A., & Cook, D. (2024) · Cancers · doi:10.3390/cancers16132302 · Cited by 5
Vidal‐Verdú, À., Torrent, D., Iglesias, A., Latorre‐Pérez, A., Abendroth, C., Corbín-Agustí, P., Peretó, J. G., & Porcar, M. (2024) · npj Biofilms and Microbiomes · doi:10.1038/s41522-024-00531-7 · Cited by 4
Al-Nijir, M., Chuck, C. J., Bedford, M. R., & Henk, D. A. (2024) · Microbiome · doi:10.1186/s40168-024-01970-2 · Cited by 6
Bostancioglu, S. M., & Mutlu, O. (2025) · Parasitology Research · doi:10.1007/s00436-024-08433-5 · Cited by 4
Rubio-Cervantes, I., Wolfrum, S., Rodehutscord, M., & Camarinha‐Silva, A. (2025) · Journal of Agriculture and Food Research · doi:10.1016/j.jafr.2025.101906 · Cited by 4
McCulloch, K., & Hicks, K. (2022) · Journal of Chemical Education · doi:10.1021/acs.jchemed.2c00502 · Cited by 4
Gene-based microbiome representation enhances host phenotype classification
Deschênes, T., Tohoundjona, F. W. E., Plante, P.-L., Marzo, V. D., & Raymond, F. (2023) · mSystems · doi:10.1128/msystems.00531-23 · Cited by 9
Chmelova, K., Gao, T., Polak, M., Schenkmayerová, A., Croll, T. I., Shaikh, T. R., Skarupova, J., Chaloupková, R., Diederichs, K., Read, R. J., et al. (2023) · Protein Science · doi:10.1002/pro.4751 · Cited by 4
McDonald, A. G., & Lisacek, F. (2024) · Scientific Reports · doi:10.1038/s41598-023-51012-4 · Cited by 4
Nishida, K., Maruyama, J., Kaizu, K., Takahashi, K., & Yugi, K. (2024) · npj Systems Biology and Applications · doi:10.1038/s41540-024-00342-8 · Cited by 9
A Review: Biological Insights on Knowledge Graphs
Galluzzo, Y. (2022) · Communications in computer and information science · doi:10.1007/978-3-031-15743-1_36 · Cited by 5
Metabolomic rearrangement controls the intrinsic microbial response to temperature changesPreprint
Knapp, B. D., Willis, L., Gonzalez, C. G., Vashistha, H., Jammal-Touma, J., Tikhonov, M., Ram, J. L., Salman, H., Elias, J. E., & Huang, K. C. (2023) · bioRxiv (Cold Spring Harbor Laboratory) · doi:10.1101/2023.07.22.550177 · Cited by 4
Boorla, V. S., & Maranas, C. D. (2024) · bioRxiv (Cold Spring Harbor Laboratory) · doi:10.1101/2024.03.10.584340 · Cited by 4
Chemistry and Technology Innovation to Advance Green and Sustainable Chemistry
Prabhakaran, P., Bhardwaj, S., Chopra, B., Dhingra, A. K., & Kant, M. (2024) · Wiley eBooks · doi:10.1002/9781394212767.ch12 · Cited by 7
Assessing cellular metabolic dynamics with NAD(P)H fluorescence polarization imagingPreprint
Lu, L., Crowley, J. C., Tan, M. L., Kunitake, J. A. M. R., Shimpi, A. A., Williams, R. M., Estroff, L. A., Fischbach, C., & Zipfel, W. R. (2025) · bioRxiv (Cold Spring Harbor Laboratory) · doi:10.1101/2025.07.28.667273 · Cited by 4
Chowdhury, N. B., Pokorzynski, N., Rucks, E. A., Ouellette, S. P., Carabeo, R. A., & Saha, R. (2024) · mSystems · doi:10.1128/msystems.00717-24 · Cited by 3
Ferreira, M. A. D. M., & Silveira, W. B. D. (2024) · Biochemical Engineering Journal · doi:10.1016/j.bej.2024.109471 · Cited by 3
RFW captures species-level metagenomic functions by integrating genome annotation information
Mi, K., Xu, R., & Liu, X. (2024) · Cell Reports Methods · doi:10.1016/j.crmeth.2024.100932 · Cited by 6
Sustainable production of chemicals by algorithm-assisted (bio)synthesis
Grzybowski, B. A., Żądło‐Dobrowolska, A., Onishchenko, N. R., & Larsen, E. S. (2025) · Nature Reviews Bioengineering · doi:10.1038/s44222-025-00312-7 · Cited by 8
ActSeek: fast and accurate search algorithm of active sites in alphafold database
Castillo, S., & Ollila, O. H. S. (2025) · Bioinformatics · doi:10.1093/bioinformatics/btaf424 · Cited by 3
Zhao, S., Xie, X., Yang, Y., Yu, H. B., Wang, J., Luo, L., & Zhou, X. (2025) · Journal of Agricultural and Food Chemistry · doi:10.1021/acs.jafc.5c05803 · Cited by 3
Juo, J.-J., & Ng, I. (2025) · Enzyme and Microbial Technology · doi:10.1016/j.enzmictec.2025.110751 · Cited by 3
MechFind: a computational framework for de novo prediction of enzyme mechanisms
Hartley, A. D., Upadhyay, V., Boorla, V. S., & Maranas, C. D. (2026) · Nature Communications · doi:10.1038/s41467-026-71957-0 · Cited by 4
Bearne, S. L. (2025) · Biochemistry and Cell Biology · doi:10.1139/bcb-2025-0264 · Cited by 3
MicroMap: a network visualisation resource for human microbiome metabolism
Thinnes, C. C., Waschkowitz, R., Courtney, E., Culligan, E., Fahy, K., Ferrazza, R. A. M., Ferris, C., Lagali, A., Lane, R., Maye, C., et al. (2025) · npj Biofilms and Microbiomes · doi:10.1038/s41522-025-00853-0 · Cited by 3
Kennedy, L. S., Harper, M., & Čuperlović‐Culf, M. (2025) · Briefings in Bioinformatics · doi:10.1093/bib/bbaf635 · Cited by 6
Proteome constrained metabolic modeling of Sus scrofa muscle stem cells for cultured meat production
Qiu, S., Kratochvilova, E., Huang, W. E., Cui, Z., Agnew, T., Yang, A., & Ye, H. (2026) · Metabolic Engineering · doi:10.1016/j.ymben.2026.01.001 · Cited by 5
Accurate enzyme specificity constant prediction with iESC
Zhang, Y., Liu, L.-H., Wang, S., & Jiang, A. (2026) · Bioresource Technology · doi:10.1016/j.biortech.2026.134067 · Cited by 3
Vibrio natriegens is sensitive to its acidic fermentation products
Haas, N. W., & McKinlay, J. B. (2026) · Applied and Environmental Microbiology · doi:10.1128/aem.01745-25 · Cited by 3
Accelerated discovery of thermophilic biocatalysts for marine polysaccharide bioprocessing via ETopt
Liu, C., Li, B., Jiang, H. W., Sun, J., Ren, J., Huang, X., Xu, P., Li, M., Xin, Y., Chen, S., et al. (2026) · International Journal of Biological Macromolecules · doi:10.1016/j.ijbiomac.2026.151068 · Cited by 3
Hazard Assessment of Antioxidants as Contaminants of Concern
Seller, C., Weissbach, F., Jorner, K., Scheringer, M., & Fenner, K. (2026) · Environmental Science & Technology Letters · doi:10.1021/acs.estlett.5c01217 · Cited by 6
Zhou, R. H. F. L., Ma, H., Xin, T., Miao, Q., Zou, L., Hu, Q., Cheng, H., Guo, J., Mu, Y., Wang, S., et al. (2026) · Journal of Chemical Information and Modeling · doi:10.1021/acs.jcim.6c00090 · Cited by 3
Tec-Campos, D., Kumar, M., Parra, N., Bracamonte, A., Castillo-Sanchez, A., Pae, J., Zúñiga, C., & Zengler, K. (2026) · Bioengineering · doi:10.3390/bioengineering13060633 · Cited by 5
A framework for considering prior information in network‐based approaches to omics data analysis
Somers, J., Fenner, M. R., Kong, G., Thirumalaisamy, D., Yashar, W. M., Thapa, K., Kinali, M., Nikolova, O. H., Babur, Ö., & Demir, E. (2023) · PROTEOMICS · doi:10.1002/pmic.202200402 · Cited by 3
Discretised Flux Balance Analysis for Reaction–Diffusion Simulation of Single-Cell Metabolism
Chew, Y. H., & Spill, F. (2024) · Bulletin of Mathematical Biology · doi:10.1007/s11538-024-01264-6 · Cited by 3
OsTH1 is a key player in thiamin biosynthesis in rice
Faustino, M. V., Lourenço, T. F., Strobbe, S., Cao, D., Fonseca, A., Rocha, I., Straeten, D. V. D., & Oliveira, M. M. (2024) · Scientific Reports · doi:10.1038/s41598-024-62326-2 · Cited by 3
Liao, Y., Wei, Z., Xu, H., Zhang, Z., & Zhu, F. (2024) · Precision medication. · doi:10.1016/j.prmedi.2024.10.002 · Cited by 5
Paul, I., Roy, A., Dutta, S., Sarkar, T., Ghosh, S., & Ray, S. (2024) · ChemistrySelect · doi:10.1002/slct.202403994 · Cited by 3
Detkova, E. N., Boltyanskaya, Y. V., Pimenov, N. V., Mardanov, A. V., & Kevbrin, V. V. (2024) · Microbiology · doi:10.1134/s0026261724606791 · Cited by 3
Kumari, N., Kumar, S. T., Roy, A., Saini, P., Jaiswal, S., Iquebal, M. A., Angadi, U. B., & Kumar, D. (2025) · Database · doi:10.1093/database/baae128 · Cited by 5
Building resource-efficient community databases using open-source software
Jung, S., Cheng, C.-H., Lee, T., Buble, K., Humann, J. L., Zheng, P., Yu, J., & Main, D. (2025) · Database · doi:10.1093/database/baaf005 · Cited by 4
Liu, M., Ni, X., Ramanujam, J., & Bryliński, M. (2025) · Journal of Chemical Information and Modeling · doi:10.1021/acs.jcim.4c02161 · Cited by 3
Delgado-Nungaray, J. A., Figueroa-Yáñez, L. J., Delgado, E. R., García-Ramírez, M. A., Aguilar-Corona, K. E., & González‐Reynoso, O. (2025) · Metabolites · doi:10.3390/metabo15040236 · Cited by 5
Morita, K., Hatano, A., Kokaji, T., Sugimoto, H., Tsuchiya, T., Ozaki, H., Egami, R., Li, D. F., Terakawa, A., Ohno, S., et al. (2025) · Science Signaling · doi:10.1126/scisignal.ads2547 · Cited by 5
Jiang, C., Li, L., & Li, J. (2025) · World Journal of Microbiology and Biotechnology · doi:10.1007/s11274-025-04524-2 · Cited by 3
Ekvik, A. E., Kober, M. M., & Titov, D. V. (2026) · Cell chemical biology · doi:10.1016/j.chembiol.2026.03.004 · Cited by 4
Mertins, S. D. (2022) · Frontiers in Oncology · doi:10.3389/fonc.2021.805592 · Cited by 3
Mahesh, M. V. N. U., Faidh, M., & Chadha, A. (2022) · Current Research in Biotechnology · doi:10.1016/j.crbiot.2022.09.003 · Cited by 5
Gerloff, D. L., Ilina, E. I., Cialini, C., Salcedo, U. M., Mittelbronn, M. G. A., & Müller, T. (2022) · STAR Protocols · doi:10.1016/j.xpro.2022.101905 · Cited by 3
Darmawan, R. D., Kusuma, W. A., & Rahmawan, H. (2023) · International Journal of Power Electronics and Drive Systems/International Journal of Electrical and Computer Engineering · doi:10.11591/ijece.v13i3.pp3111-3123 · Cited by 4
Essert, A., & Castiglione, K. (2023) · Protein Engineering Design and Selection · doi:10.1093/protein/gzad006 · Cited by 3
Route selection and reaction engineering for sustainable metabolite synthesis
Wohlgemuth, R. (2023) · Reaction Chemistry & Engineering · doi:10.1039/d3re00222e · Cited by 3
Fucose as a nutrient ligand for Dikarya and a building block of early diverging lineages
(2023) · doi:10.1186/s43008-023-00123-8 · Cited by 3
Production of enzymes for the removal of odorous substances in plant biomass
Opdensteinen, P., Knödler, M., & Buyel, J. F. (2023) · Protein Expression and Purification · doi:10.1016/j.pep.2023.106379 · Cited by 3
Klenina, O. V., & Chaban, T. I. (2023) · Farmatsevtychnyi zhurnal · doi:10.32352/0367-3057.6.23.05 · Cited by 4
Faustino, M. V., Lourenço, T. F., Strobbe, S., Cao, D., Fonseca, A., Rocha, I., Straeten, D. V. D., & Oliveira, M. M. (2024) · BMC Plant Biology · doi:10.1186/s12870-024-04878-z · Cited by 5
Wang, M., Vijayaraghavan, A., Beck, T., & Posma, J. M. (2024) · Journal of Proteome Research · doi:10.1021/acs.jproteome.3c00367 · Cited by 4
Qian, J., Jin, P., Yang, Y., Ma, N., Yang, Z., & Zhang, X. (2024) · Microbial Pathogenesis · doi:10.1016/j.micpath.2024.106727 · Cited by 3
Focil-Espinosa, C., Canto-Encalada, G., Campos, D.-T., Zúñiga, C., & Zepeda, A. (2024) · Elsevier eBooks · doi:10.1016/b978-0-443-13609-2.00020-3 · Cited by 5
LICEDB: light industrial core enzyme database for industrial applications and AI enzyme design
Gong, L., Liu, F., Zhang, C., Ming, Y., Mou, Y., Yuan, Z., Jiang, H., Gao, B., Lu, F., & Zhang, L. (2025) · Database · doi:10.1093/database/baaf001 · Cited by 3
The Metano Modeling Toolbox MMTB: An Intuitive, Web-Based Toolbox Introduced by Two Use Cases
Koblitz, J., Will, S. E., Riemer, S. A., Ulas, T., Neumann‐Schaal, M., & Schomburg, D. (2021) · Metabolites · doi:10.3390/metabo11020113 · Cited by 2
A novel Streptomyces strain isolated by functional bioprospecting for laccases
Hamoudi, H., Giacobbe, S., Strazzulli, A., Pezzella, C., Sannia, G., Moracci, M., Piscitelli, A., & Kecha, M. (2021) · Process Biochemistry · doi:10.1016/j.procbio.2021.11.016 · Cited by 3
Jurkaš, V., Weißensteiner, F., Santis, P. D., Vrabl, S., Sorgenfrei, F. A., Bierbaumer, S., Kara, S., Kourist, R., Wangikar, P. P., Winkler, C. K., et al. (2022) · Angewandte Chemie · doi:10.1002/ange.202207971 · Cited by 3
Ruiz, B., Belcour, A., Blanquart, S., Buffet‐Bataillon, S., Huërou‐Luron, I. L., Siegel, A., & Cunff, Y. L. (2024) · PLoS Computational Biology · doi:10.1371/journal.pcbi.1012577 · Cited by 4
Rivière, F., Dian, C., Dutheil, R. F., Giglione, C., & Meinnel, T. (2021) · bioRxiv (Cold Spring Harbor Laboratory) · doi:10.1101/2021.06.22.449375 · Cited by 3
Nature and biological irrelevance of mixed-type enzyme inhibitionPreprint
Pesaresi, A. (2022) · bioRxiv (Cold Spring Harbor Laboratory) · doi:10.1101/2022.12.20.521168 · Cited by 3
Photosynthetic acclimation mediates exponential growth of a desert plant in Death Valley summerPreprint
Prado, K., Xue, B., Johnson, J. E., Field, S., Stata, M., Hawkins, C. L., Hsia, R., Liu, H., Cheng, S., & Rhee, S. Y. (2023) · bioRxiv (Cold Spring Harbor Laboratory) · doi:10.1101/2023.06.23.546155 · Cited by 3
Understanding Plant Secondary Metabolism Using Bioinformatics Tools
Mukherjee, D., & Mukherjee, A. (2024) · Wiley eBooks · doi:10.1002/9781394209965.ch19 · Cited by 6
SAKPE: A Site Attention Kinetic Parameters Prediction Method for Enzyme EngineeringPreprint
Qiu, J.-H., Lin, Z., Chen, K., Sun, T., Zhang, X., Li, Y., Tian, Y., & Wu, Y. (2025) · bioRxiv (Cold Spring Harbor Laboratory) · doi:10.1101/2025.04.30.651216 · Cited by 3
CCycDB: an integrative knowledgebase to fingerprint microbially mediated carbon cycling processesPreprint
Zhou, J., Qian, L., Ji, M., Li, Y., Ma, K., Yu, X., Chen, J., Lin, L., Gong, X., He, Z., et al. (2026) · bioRxiv (Cold Spring Harbor Laboratory) · doi:10.64898/2026.01.28.702190 · Cited by 5
Boyd, A. P., Talbert, J. N., & Acevedo, N. C. (2022) · Food Chemistry Advances · doi:10.1016/j.focha.2022.100105 · Cited by 2
Comparative Analysis of Deep Generative Model for Industrial Enzyme Design
Zhang, B., Meng, Q., Ai, C., Duan, G., Wang, E., & Guo, F. (2024) · Current Bioinformatics · doi:10.2174/0115748936303223240404043202 · Cited by 2
Digitalization of biocatalysis: Best practices to research data management
Giess, T., & Pleiss, J. (2025) · Methods in enzymology on CD-ROM/Methods in enzymology · doi:10.1016/bs.mie.2025.01.040 · Cited by 2
Hinge loop reconstruction facilitates hydride transfer in Baeyer-Villiger monooxygenases
Geng, Q., Zhou, C. D., Zheng, Y., Liu, F., Chen, Q., Zhang, Z. J., Kong, X. D., Zhao, Z. K., Xu, J., & Yu, H. (2025) · Chem Catalysis · doi:10.1016/j.checat.2025.101364 · Cited by 2
Minium, K., Knepp, Z. J., Sutton, M., Falls, T., Bobb, S., McKeefery, C., Smith, K., & Root, K. T. (2025) · Biochemistry · doi:10.1021/acs.biochem.5c00057 · Cited by 3
Considering Metabolic Context in Enzyme Evolution and Design
Dokwal, D., Brown, P. M., Filipowska, K., & Reynolds, K. A. (2025) · Biochemistry · doi:10.1021/acs.biochem.5c00165 · Cited by 4
von Ziegner, F., Brauckmann, G., Filiz, V., Brinkmann, T., Bubenheim, P., & Waluga, T. (2025) · Chemical Engineering and Processing - Process Intensification · doi:10.1016/j.cep.2025.110499 · Cited by 2
Multi-omics analysis of thermogenic lipolysis in brown adipocytes
Mattanovich, M., Anagho, H. A., Argemi‐Muntadas, L., Nielsen, M. L., Gao, Q., & Möritz, T. (2025) · iScience · doi:10.1016/j.isci.2025.113382 · Cited by 5
Ridha, F., Frishman, D., & Gromiha, M. M. (2025) · International Journal of Biological Macromolecules · doi:10.1016/j.ijbiomac.2025.148290 · Cited by 3
TCNeKP: A Novel Deep Learning Architecture for Enzyme Catalytic Activity Prediction
Lei, Y., Liu, R., Yu, H., Xu, W., Long, T., & Hu, M. Y. (2025) · Journal of Chemical Information and Modeling · doi:10.1021/acs.jcim.5c01830 · Cited by 3
Cell-Free-Based Thermophilic Biocatalyst for the Synthesis of Amino Acids from One-Carbon Feedstocks
Westenberg, R., Chowdhury, S., Cardiff, R. A. L., Wennerholm, K., Beliaev, A. S., Carothers, J. M., & Peralta‐Yahya, P. (2025) · ACS Synthetic Biology · doi:10.1021/acssynbio.5c00352 · Cited by 2
Tracking polyhydroxyalkanoate biosynthesis in thermophilic microorganisms
Schroyen, B., Moanis, R., Geeraert, H., Brande, N. P. V. D., Hennecke, U., Obruča, S., Pernicová, I., Sedlář, K., Sedláček, P., & Peeters, E. (2025) · International Journal of Biological Macromolecules · doi:10.1016/j.ijbiomac.2025.148573 · Cited by 5
Editor's Choice GlycoEnzDB: a database of enzymes involved in human glycosylation
Zhou, Y., Ghosh, V., Venkatesan, S., Sriram, S., Sobczak, E., Setlur, S., Gunawan, R., & Neelamegham, S. (2025) · Glycobiology · doi:10.1093/glycob/cwaf074 · Cited by 3
Outlook: Emerging Enzyme–Material Designs for Advanced Biocatalysis
Nedyalkova, M., Vecini, D. P., & Lattuada, M. (2025) · ChemistrySelect · doi:10.1002/slct.202503483 · Cited by 4
Kambal, S., Walsh, A. T., Sivasankaran, S. K., Adossa, N. A., Skarlupka, J. H., Hanotte, O., Suen, G., & Elsik, C. G. (2025) · Nucleic Acids Research · doi:10.1093/nar/gkaf1214 · Cited by 6
Binding mode of Isoxazolyl Penicillins to a Class-A β-lactamase at ambient conditions
Gore, G., Prester, A., von Stetten, D., Bartels, K., & Schulz, E. C. (2025) · Communications Chemistry · doi:10.1038/s42004-025-01801-x · Cited by 2
Enhancing kcat prediction through residue-aware attention mechanism and pre-trained representations
Cai, Y., Ge, F., Zhang, C., Chen, H., Qi, X., Liao, X., & Wang, L. (2026) · Communications Biology · doi:10.1038/s42003-026-09551-9 · Cited by 2
Chapple, B. P., Böhmer, L. M., & Pietruszka, J. (2026) · ChemCatChem · doi:10.1002/cctc.202501714 · Cited by 2
KinForm: kinetics-informed feature optimised representation models for enzyme kcat and KM prediction
Alwer, S., & Fleming, R. M. T. (2026) · npj Systems Biology and Applications · doi:10.1038/s41540-026-00692-5 · Cited by 9
Mobilizing the Biocatalysis Community for Reproducible and Reusable Data Collection
Marques, S. M., Planas-Iglesias, J., Velecký, J., Musil, M., Asano, Y., Borowski, T., Brissos, V., Cespugli, M., Chorozian, K., Dadashipour, M., et al. (2026) · ACS Catalysis · doi:10.1021/acscatal.5c07904 · Cited by 3
Applications and limitations of AI tools in enzyme design
Teijeiro-Juiz, R., Egeler, N., Jamróg, G., Ringel, M., Brück, T., Geronimo, B. D., & Loll, B. (2026) · Protein Science · doi:10.1002/pro.70698 · Cited by 3
In silico approaches for the quest of the novel enzymes
Chetal, G., & Verma, M. L. (2023) · Elsevier eBooks · doi:10.1016/b978-0-323-89928-4.00017-1 · Cited by 2
Omics data for sampling thermodynamically feasible kinetic models
de Leeuw, M., Matos, M. R. A., & Nielsen, L. K. (2023) · Metabolic Engineering · doi:10.1016/j.ymben.2023.05.002 · Cited by 2
Metadata
- Authors
- Chang, A., Jeske, L., Ulbrich, S., Hofmann, J., Koblitz, J., Schomburg, I., Neumann-Schaal, M., Jahn, D., & Schomburg, D.
- Affiliations
- Technische Universität Braunschweig (DE)
- Leibniz Institute DSMZ – German Collection of Microorganisms and Cell Cultures (DE)
- Leibniz Institute DSMZ-German Collection of Microorganisms and Cell Cultures, Inhoffenstrasse 7 B, 38124 Braunschweig, Germany
- Corresponding author
- Schomburg, Dietmar
- Venue
- Nucleic Acids Research
- Publisher
- Oxford University Press (OUP)
- Published
- 2020-11-19
- Volume
- 49
- Issue
- D1
- Pages
- D498-D508
- ISSN
- 0305-1048 (ISSN-L)
- 1362-4962
- PMC
- PMC7779020
- OpenAlex
- W3105895642
- Cited by
- 789
- References
- 40
- Citations by year
- 2026: 126 · 2025: 182 · 2024: 171 · 2023: 145 · 2022: 117 · 2021: 48
- FWCI
- 25.35
- Type
- journal article
- Language
- en
- Open access
- gold
- doi.org
- Licence
- Locations
- Nucleic Acids Research (publishedVersion, cc-by)
- Europe PMC (PubMed Central) (publishedVersion, cc-by)
- PubMed Central (publishedVersion, cc-by)
- PubMed (publishedVersion)
- Digitale Bibliothek Braunschweig (Verbundzentrale Göttingen (VZG)) (submittedVersion, cc-by)
- Funders
- German Federal Ministry of Education and Research (031A539D, 031L0078E, 031L0078G, 01KX1235)
- Topics
- Life Sciences › Biochemistry, Genetics and Molecular Biology › Molecular Biology › Bioinformatics and Genomic Networks
- Life Sciences › Biochemistry, Genetics and Molecular Biology › Structural Biology › Enzyme Structure and Function
- Life Sciences › Biochemistry, Genetics and Molecular Biology › Molecular Biology › Genomics and Phylogenetic Studies
- Keywords
- enzyme kinetics, enzyme-ligand interactions, enzyme annotation, metabolic pathways
- MeSH terms
- Acetyl Coenzyme A, Bacillus subtilis, Enzymes, Arabidopsis, Imaging, Three-Dimensional, Databases, Protein, Metabolic Networks and Pathways, Search Engine, Molecular Sequence Annotation
About these checks
Registry, retraction, Cites and statistics results are computed, not judged, with one exception: a printed reference that no index lists is read once by a model before it counts as a citation error. Claims are extracted by a model and kept only when their quote appears verbatim in the text; each cited source is then checked, with a model’s help, for whether it says what the claim relies on. Those verdicts can be wrong — read the claim’s quote and the cited source before relying on one.
Statistics and arithmetic are recomputed, not judged.
Confidence bands are shown only for fields calibrated on our annotated test set. None is calibrated yet, so no band is shown.
What counts as a claim ›How we measure confidence ›How we check this ›
Are you an author, or do you see a problem with this page? Request a review
Data sources
Bibliographic data: Semantic Scholar, OpenAlex, Crossref.
Contains information from the Semantic Scholar Academic Graph Datasets, made available under the ODC Attribution License (ODC-BY 1.0).
Semantic Scholar’s data is described in: Kinney, R., et al. (2023). The Semantic Scholar Open Data Platform. arXiv:2301.10140.
