

The DOI matches its Crossref record; 2 of the 2 references it cites were found in a registry or an index.
KEGG: integrating viruses and cellular organisms
Abstract
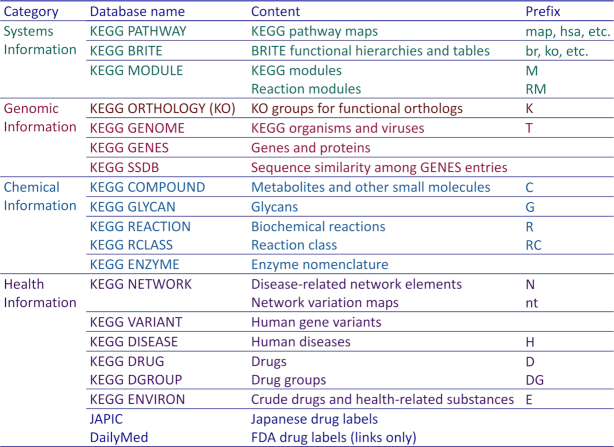
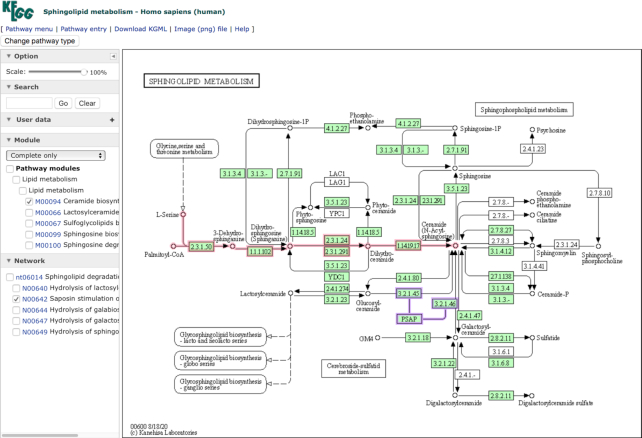
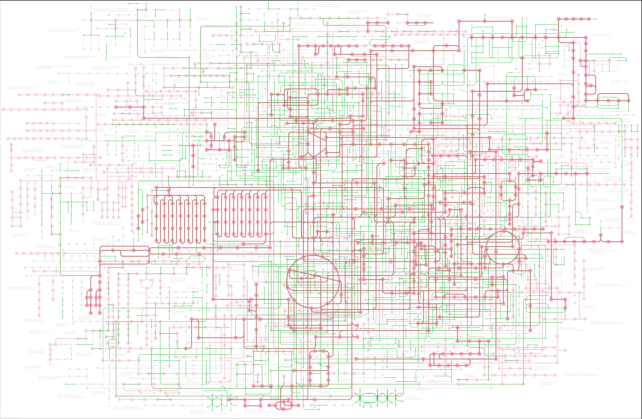
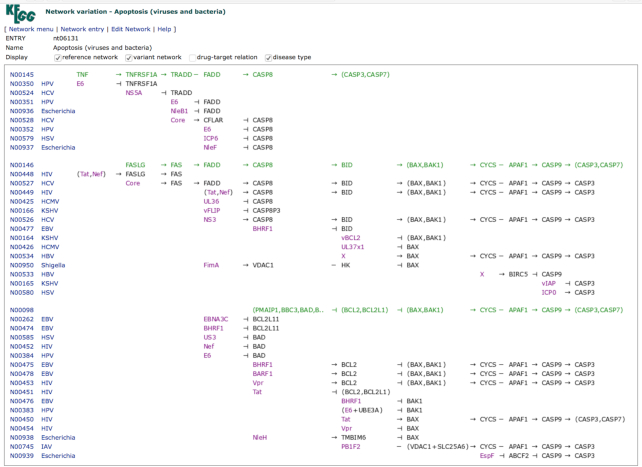
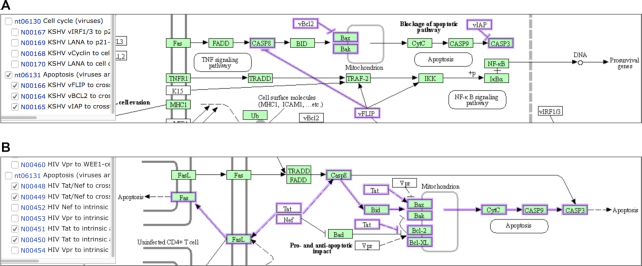
KEGG (https://www.kegg.jp/) is a manually curated resource integrating eighteen databases categorized into systems, genomic, chemical and health information. It also provides KEGG mapping tools, which enable understanding of cellular and organism-level functions from genome sequences and other molecular datasets. KEGG mapping is a predictive method of reconstructing molecular network systems from molecular building blocks based on the concept of functional orthologs. Since the introduction of the KEGG NETWORK database, various diseases have been associated with network variants, which are perturbed molecular networks caused by human gene variants, viruses, other pathogens and environmental factors. The network variation maps are created as aligned sets of related networks showing, for example, how different viruses inhibit or activate specific cellular signaling pathways. The KEGG pathway maps are now integrated with network variation maps in the NETWORK database, as well as with conserved functional units of KEGG modules and reaction modules in the MODULE database. The KO database for functional orthologs continues to be improved and virus KOs are being expanded for better understanding of virus-cell interactions and for enabling prediction of viral perturbations.
Overview
The claims and statistics of this paper haven’t been checked yet.
Run the check — free, no account needed. It reads the open-access text and checks the sources it cites.
Integrity signals
Registry
Cites
Statistics
Figures
Verification
Claims the paper makes
The claims and statistics of this paper haven’t been checked yet.
Run the check — free, no account needed. It reads the open-access text and checks the sources it cites.
Claims other papers make about this one
Each is checked against this paper’s own text: does it say what the citing paper says it does?
The source backs part of the claim, not all of it — or backs it for a different population, condition or comparison.
In the citing paper
“Based on the KEGG database, aldolase PP_2037 is predicted to belong to six different pathways: monobactam biosynthesis, lysine biosynthesis, metabolic pathways, biosynthesis of secondary metabolites, microbial metabolism in diverse environments, and biosynthesis of amino acids;”
From Adaptive evolution of Pseudomonas putida in the presence of fluoride exposes novel functions of a benzoate transporter (2026) · cites this paper as [30]
Experimental — accuracy not yet measuredIn the citing paper
“4-hydroxy-tetrahydrodipicolinate synthase is predicted to belong to the following four different pathways: ppu00040 Pentose and glucuronate interconversions, fructose and mannose metabolism, metabolic pathways, and microbial metabolism in diverse environments (30; entry ppu:PP_2036: available from: https://www.kegg.jp/entry/ppu:PP_2036; retrieved 23 March 2026; entry ppu:PP_2037: available from:”
From Adaptive evolution of Pseudomonas putida in the presence of fluoride exposes novel functions of a benzoate transporter (2026) · cites this paper as [30]
Self-check
Percentages, sums and reported differences re-computed from the paper’s own numbers.
The self-check needs the paper’s full text.
Citations
Cites
Toward understanding the origin and evolution of cellular organisms
Kanehisa, M. (2019) · Protein Science · doi:10.1002/pro.3715 · Cited by 5,509 · cited 1×
“Systems and perturbations have been used as a conceptual framework for developing the KEGG (Kyoto Encyclopedia of Genes and Genomes) database resource (1).”
MethodSelf-citationFederhen, S. (2012) · Nucleic Acids Research · doi:10.1093/nar/gkr1178 · Cited by 1,436
Research works printed but not linked: 8
- Kanehisa, 2019, New approach for understanding genome variations in KEGG, Nucleic Acids Res., 47, D590, 10.1093/nar/gky962 · DOI
- Sunagawa, 2015, Ocean plankton. Structure and function of the global ocean microbiome, Science, 348, 1261359, 10.1126/science.1261359 · DOI
- Kanehisa, 2020, KEGG Mapper for inferring cellular functions from protein sequences, Protein Sci., 29, 28, 10.1002/pro.3711 · DOI
- Hanahan, 2000, The hallmarks of cancer, Cell, 100, 57, 10.1016/S0092-8674(00)81683-9 · DOI · Paper page
- Jellinger, 2009, Recent advances in our understanding of neurodegeneration, J. Neural Transm. (Vienna), 116, 1111, 10.1007/s00702-009-0240-y · DOI · Paper page
- Baltimore, 1971, Expression of animal virus genomes, Bacteriol. Rev., 35, 235, 10.1128/BR.35.3.235-241.1971 · DOI
- Lefkowitz, 2018, Virus taxonomy: the database of the International Committee on Taxonomy of Viruses (ICTV), Nucleic Acids Res., 46, D708, 10.1093/nar/gkx932 · DOI
- Kanehisa, 2014, Data, information, knowledge and principle: back to metabolism in KEGG, Nucleic Acids Res., 42, D199, 10.1093/nar/gkt1076 · DOI
Cited by
Sorted by citations
KEGG for taxonomy-based analysis of pathways and genomes
Kanehisa, M., Furumichi, M., Sato, Y., Kawashima, M., & Ishiguro-Watanabe, M. (2023) · Nucleic Acids Research · doi:10.1093/nar/gkac963 · Cited by 5,833
Self-citationDimitrov, D., Türei, D., Garrido-Rodriguez, M., Burmedi, P. L., Nagai, J. S., Boys, C., Ramirez Flores, R. O., Kim, H., Szalai, B., Costa, I. G., et al. (2022) · Nature Communications · doi:10.1038/s41467-022-30755-0 · Cited by 664
Utilizing graph machine learning within drug discovery and development
Gaudelet, T., Day, B., Jamasb, A. R., Soman, J., Regep, C., Liu, G., Hayter, J. B. R., Vickers, R., Roberts, C., Tang, J., et al. (2021) · Briefings in Bioinformatics · doi:10.1093/bib/bbab159 · Cited by 313
Vacca, M., Kamzolas, I., Harder, L. M., Oakley, F., Trautwein, C., Hatting, M., Ross, T., Bernardo, B., Oldenburger, A., Hjuler, S. T., et al. (2024) · Nature Metabolism · doi:10.1038/s42255-024-01043-6 · Cited by 262
GeneCaRNA: A Comprehensive Gene-centric Database of Human Non-coding RNAs in the GeneCards Suite.
Barshir, R., Fishilevich, S., Iny-Stein, T., Zelig, O., Mazor, Y., Guan-Golan, Y., Safran, M., & Lancet, D. (2021) · Journal of Molecular Biology · doi:10.1016/j.jmb.2021.166913 · Cited by 134
Pharos 2023: an integrated resource for the understudied human proteome
Kelleher, K. J., Sheils, T. K., Mathias, S. L., Yang, J. J., Metzger, V. T., Siramshetty, V. B., Nguyen, D.-T., Jensen, L. J., Vidović, D., Schürer, S. C., et al. (2023) · Nucleic Acids Research · doi:10.1093/nar/gkac1033 · Cited by 137
Upadhya, S. R., & Ryan, C. J. (2022) · Cell Reports Methods · doi:10.1016/j.crmeth.2022.100288 · Cited by 81
A pan-cancer analysis of the role of hexokinase II (HK2) in human tumors
Li, R., Mei, S., Ding, Q., Wang, Q., Yu, L., & Zi, F. (2022) · Scientific Reports · doi:10.1038/s41598-022-23598-8 · Cited by 48
Senescence-induced cellular reprogramming drives cnidarian whole-body regeneration
Salinas-Saavedra, M., Febrimarsa, Krasovec, G., Horkan, H. R., Baxevanis, A. D., & Frank, U. (2023) · Cell Reports · doi:10.1016/j.celrep.2023.112687 · Cited by 45
The evolution and spread of sulfur cycling enzymes reflect the redox state of the early Earth
Mateos, K., Chappell, G., Klos, A., Le, B., Boden, J., Stüeken, E., & Anderson, R. (2023) · Science Advances · doi:10.1126/sciadv.ade4847 · Cited by 43
Cold stress tolerance of the intertidal red alga Neoporphyra haitanensis
Zhu, S., Gu, D., Lu, C., Zhang, C., Chen, J., Yang, R., Luo, Q., Wang, T., Zhang, P., & Chen, H. (2022) · BMC Plant Biology · doi:10.1186/s12870-022-03507-x · Cited by 39
Peters, N. A., Constantinides, A., Ubink, I., van Kuik, J., Bloemendal, H. J., van Dodewaard, J. M., Brink, M. A., Schwartz, T. P., Lolkema, M. P. J. K., Lacle, M. M., et al. (2022) · Frontiers in Oncology · doi:10.3389/fonc.2022.969855 · Cited by 35
Construction and Analysis of an Enzyme-Constrained Metabolic Model of Corynebacterium glutamicum
Niu, J., Mao, Z., Mao, Y., Wu, K., Shi, Z., Yuan, Q., Cai, J., & Ma, H. (2022) · Biomolecules · doi:10.3390/biom12101499 · Cited by 32
Genomic and functional diversity of the human-derived isolates of Faecalibacterium
Li, W., Lin, X., Liang, H., Wu, Z., Wang, M., Sun, J., Li, X., He, W., Gao, X., Hu, T., et al. (2024) · Frontiers in Microbiology · doi:10.3389/fmicb.2024.1379500 · Cited by 17
Involvement of RFC3 in tamoxifen resistance in ER-positive breast cancer through the cell cycle
Zhu, J., Ye, L., Sun, S., Yuan, J., Huang, J., & Zeng, Z. (2023) · Aging · doi:10.18632/aging.205260 · Cited by 10
Ets, L., Ilves, H., Juhe, L., Ilmjärv, T., Puiggené, Ò., Nikel, P. I., & Kivisaar, M. (2026) · Journal of Bacteriology · doi:10.1128/jb.00479-25 · Cited by 1
Metadata
- Authors
- Kanehisa, M., Furumichi, M., Sato, Y., Ishiguro-Watanabe, M., & Tanabe, M.
- Affiliations
- Institute for Chemical Research, Kyoto University, Uji, Kyoto 611-0011, Japan
- Social ICT Solutions Department, Fujitsu Kyushu Systems Ltd., Hakata-ku, Fukuoka 812-0007, Japan
- Human Genome Center, Institute of Medical Science, University of Tokyo, Minato-ku, Tokyo 108-8639, Japan
- ORCID
- Kanehisa, Minoru
- Venue
- Nucleic Acids Research
- Publisher
- Oxford University Press (OUP)
- Published
- 2020-10-30
- Volume
- 49
- Issue
- D1
- Pages
- D545-D551
- ISSN
- 0305-1048
- 1362-4962
- PMC
- PMC7779016
- Cited by
- 3,436
- References
- 2
- Language
- en
- Funders
- National Bioscience Database Center
About these checks
Registry, retraction, Cites and statistics results are computed, not judged, with one exception: a printed reference that no index lists is read once by a model before it counts as a citation error. Claims are extracted by a model and kept only when their quote appears verbatim in the text; each cited source is then checked, with a model’s help, for whether it says what the claim relies on. Those verdicts can be wrong — read the claim’s quote and the cited source before relying on one.
Statistics and arithmetic are recomputed, not judged.
Confidence bands are shown only for fields calibrated on our annotated test set. None is calibrated yet, so no band is shown.
What counts as a claim ›How we measure confidence ›How we check this ›
Are you an author, or do you see a problem with this page? Request a review
