

The DOI matches its Crossref record; 89 of the 89 references it cites were found in a registry or an index.
SEQUENCE SLIDER: integration of structural and genetic data to characterize isoforms from natural sources
Open accessPublished version of a preprint
Abstract
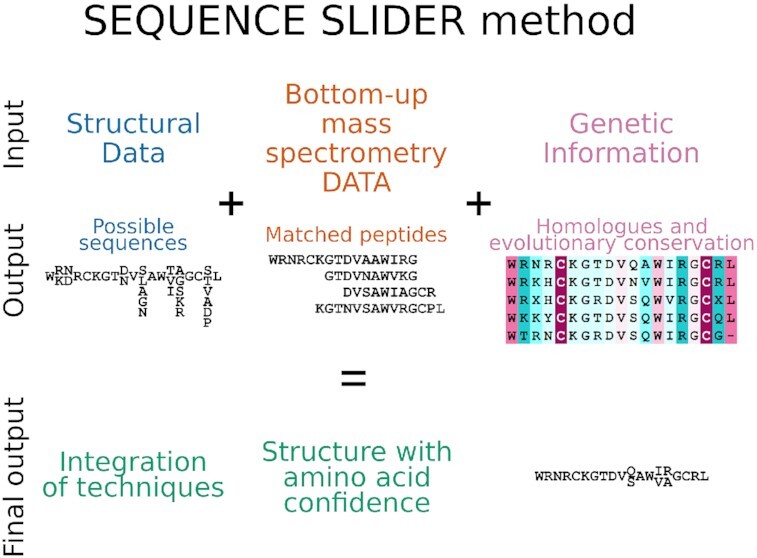
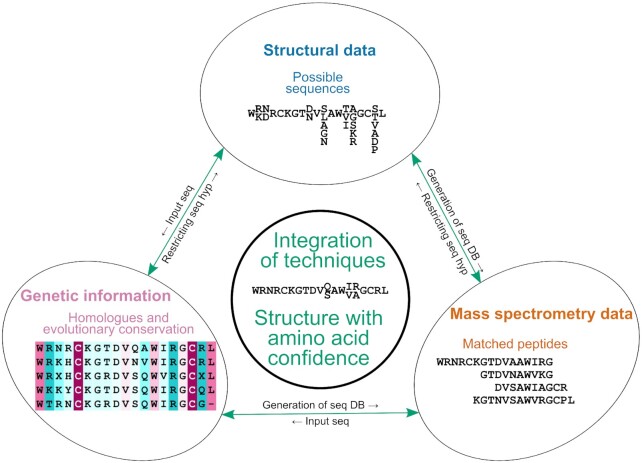
Proteins isolated from natural sources can be composed of a mixture of isoforms with similar physicochemical properties that coexist in the final steps of purification. Yet, even where unverified, the assumed sequence is enforced throughout the structural studies. Herein, we propose a novel perspective to address the usually neglected sequence heterogeneity of natural products by integrating biophysical, genetic and structural data in our program SEQUENCE SLIDER. The aim is to assess the evidence supporting chemical composition in structure determination. Locally, we interrogate the experimental map to establish which side chains are supported by the structural data, and the genetic information relating sequence conservation is integrated into this statistic. Hence, we build a constrained peptide database, containing most probable sequences to interpret mass spectrometry data (MS). In parallel, we perform MS de novo sequencing with genomic-based algorithms to detect point mutations. We calibrated SLIDER with Gallus gallus lysozyme, whose sequence is unequivocally established and numerous natural isoforms are reported. We used SLIDER to characterize a metalloproteinase and a phospholipase A2-like protein from the venom of Bothrops moojeni and a crotoxin from Crotalus durissus collilineatus. This integrated approach offers a more realistic structural descriptor to characterize macromolecules isolated from natural sources.
Overview
The claims and statistics of this paper haven’t been checked yet.
Run the check — free, no account needed. It reads the open-access text and checks the sources it cites.
Integrity signals
Registry
Cites
Statistics
Figures
Verification
Claims the paper makes
The claims and statistics of this paper haven’t been checked yet.
Run the check — free, no account needed. It reads the open-access text and checks the sources it cites.
Self-check
Percentages, sums and reported differences re-computed from the paper’s own numbers.
The self-check needs the paper’s full text.
Citations
Cites
Highly accurate protein structure prediction with AlphaFold
Jumper, J., Evans, R., Pritzel, A., Green, T., Figurnov, M., Ronneberger, O., Tunyasuvunakool, K., Bates, R., Žídek, A., Potapenko, A., et al. (2021) · Nature · doi:10.1038/s41586-021-03819-2 · Cited by 43,764
[20] Processing of X-ray diffraction data collected in oscillation mode
Otwinowski, Z., & Minor, W. (1997) · Methods in Enzymology · doi:10.1016/s0076-6879(97)76066-x · Cited by 33,475
Coot : model-building tools for molecular graphics
Emsley, P., & Cowtan, K. (2004) · Acta Crystallographica Section D Biological Crystallography · doi:10.1107/s0907444904019158 · Cited by 30,571
Features and development of Coot
Emsley, P., Lohkamp, B., Scott, W. G., & Cowtan, K. (2010) · Acta Crystallographica Section D Biological Crystallography · doi:10.1107/s0907444910007493 · Cited by 29,915
Phaser crystallographic software
McCoy, A. J., Grosse-Kunstleve, R. W., Adams, P. D., Winn, M. D., Storoni, L. C., & Read, R. J. (2007) · Journal of Applied Crystallography · doi:10.1107/s0021889807021206 · Cited by 20,612
Kabsch, W. (2010) · Acta Crystallographica Section D Biological Crystallography · doi:10.1107/s0907444909047337 · Cited by 16,463
Overview of the CCP 4 suite and current developments
Winn, M. D., Ballard, C. C., Cowtan, K. D., Dodson, E. J., Emsley, P., Evans, P. R., Keegan, R. M., Krissinel, E. B., Leslie, A. G. W., McCoy, A., et al. (2011) · Acta Crystallographica Section D Biological Crystallography · doi:10.1107/s0907444910045749 · Cited by 12,353
Database resources of the National Center for Biotechnology Information: update
Wheeler, D. L., Church, D. M., Edgar, R., Federhen, S., Helmberg, W., Madden, T. L., Pontius, J. U., Schuler, G. D., Schriml, L. M., Sequeira, E., et al. (2003) · Nucleic Acids Research · doi:10.1093/nar/gkh073 · Cited by 10,692
UniProt: a worldwide hub of protein knowledge
The UniProt Consortium (2019) · Nucleic Acids Research · doi:10.1093/nar/gky1049 · Cited by 7,698
Accelerated Profile HMM Searches
Eddy, S. R. (2011) · PLoS Computational Biology · doi:10.1371/journal.pcbi.1002195 · Cited by 6,975
Database resources of the National Center for Biotechnology Information
Agarwala, R., Barrett, T., Beck, J., Benson, D., Bollin, C., Bolton, E. E., Bourexis, D., Brister, J., Bryant, S. H., Canese, K., et al. (2017) · Nucleic Acids Res. · doi:10.1093/nar/gkx1095 · Cited by 6,277
Accurate prediction of protein structures and interactions using a 3-track network
Baek, M., DiMaio, F., Anishchenko, I., Dauparas, J., Ovchinnikov, S., Lee, G. R., Wang, J., Cong, Q., Kinch, L. N., Schaeffer, R. D., et al. (2021) · doi:10.1101/2021.06.14.448402 · Cited by 5,549
Towards automated crystallographic structure refinement with phenix.refine
Afonine, P. V., Grosse-Kunstleve, R. W., Echols, N., Headd, J. J., Moriarty, N. W., Mustyakimov, M., Terwilliger, T. C., Urzhumtsev, A., Zwart, P. H., & Adams, P. D. (2012) · Acta Crystallographica Section D Biological Crystallography · doi:10.1107/s0907444912001308 · Cited by 5,511
MolProbity: all-atom contacts and structure validation for proteins and nucleic acids
Davis, I., Leaver‐Fay, A., Chen, V. B., Block, J. N., Kapral, G. J., Wang, X., Murray, L. W., Arendall, W. B., Snoeyink, J. S., Richardson, J. S., et al. (2007) · Nucleic Acids Research · doi:10.1093/nar/gkm216 · Cited by 3,956
[26] Raster3D: Photorealistic molecular graphics
Merritt, E. A., & Bacon, D. (1997) · Methods in enzymology on CD-ROM/Methods in enzymology · doi:10.1016/s0076-6879(97)77028-9 · Cited by 3,734
Improved protein structure prediction using potentials from deep learning
Senior, A. W., Evans, R., Jumper, J., Kirkpatrick, J., Sifre, L., Green, T., Qin, C., Žídek, A., Nelson, A. W. R., Bridgland, A., et al. (2020) · Nature · doi:10.1038/s41586-019-1923-7 · Cited by 3,378
Ashkenazy, H., Abadi, S., Martz, E., Chay, O., Mayrose, I., Pupko, T., & Ben-Tal, N. (2016) · Nucleic Acids Research · doi:10.1093/nar/gkw408 · Cited by 3,163
Mass Spectrometry and Protein Analysis
Domon, B., & Aebersold, R. H. (2006) · Science · doi:10.1126/science.1124619 · Cited by 2,262
ConSurf 2005: the projection of evolutionary conservation scores of residues on protein structures
Landau, M., Mayrose, I., Rosenberg, Y., Glaser, F., Martz, E., Pupko, T., & Ben‐Tal, N. (2005) · Nucleic Acids Research · doi:10.1093/nar/gki370 · Cited by 1,379
Structures and distributions of SARS-CoV-2 spike proteins on intact virions
Ke, Z., Oton, J., Qu, K., Cortese, M., Zila, V., McKeane, L., Nakane, T., Zivanov, J., Neufeldt, C. J., Cerikan, B., et al. (2020) · Nature · doi:10.1038/s41586-020-2665-2 · Cited by 1,149
HH-suite3 for fast remote homology detection and deep protein annotation
Steinegger, M., Meier, M., Mirdita, M., Vöhringer, H., Haunsberger, S. J., & Söding, J. (2019) · BMC Bioinformatics · doi:10.1186/s12859-019-3019-7 · Cited by 1,145
MAFFT-DASH: integrated protein sequence and structural alignment
Rozewicki, J., Li, S., Amada, K. M., Standley, D. M., & Katoh, K. (2019) · Nucleic Acids Research · doi:10.1093/nar/gkz342 · Cited by 919
Single-particle cryo-EM at atomic resolution
Nakane, T., Kotecha, A., Sente, A., McMullan, G., Masiulis, S., Brown, P. M. G. E., Grigoras, I. T., Malinauskaitė, L., Malinauskas, T., Miehling, J., et al. (2020) · Nature · doi:10.1038/s41586-020-2829-0 · Cited by 902
The PDB_REDO server for macromolecular structure model optimization
Joosten, R. P., Long, F., Murshudov, G. N., & Perrakis, A. (2014) · IUCrJ · doi:10.1107/s2052252514009324 · Cited by 834
Diet and snake venom evolution
Daltry, J. C., Wüster, W., & Thorpe, R. S. (1996) · Nature · doi:10.1038/379537a0 · Cited by 674
Polder maps: improving OMIT maps by excluding bulk solvent
Liebschner, D., Afonine, P. V., Moriarty, N. W., Poon, B. K., Sobolev, O. V., Terwilliger, T. C., & Adams, P. D. (2017) · Acta Crystallographica Section D Structural Biology · doi:10.1107/s2059798316018210 · Cited by 657
Protein structure prediction from sequence variation
Marks, D. S., Hopf, T. A., & Sander, C. (2012) · Nature Biotechnology · doi:10.1038/nbt.2419 · Cited by 622
Emerging methods in protein co-evolution
de Juan, D., Pazos, F., & Valencia, A. (2013) · Nature Reviews Genetics · doi:10.1038/nrg3414 · Cited by 607
Lineage-Specific Biology Revealed by a Finished Genome Assembly of the Mouse
Church, D. M., Goodstadt, L., Hillier, L. W., Zody, M. C., Goldstein, S., She, X., Bult, C. J., Agarwala, R., Cherry, J. L., DiCuccio, M., et al. (2009) · PLoS Biology · doi:10.1371/journal.pbio.1000112 · Cited by 503
Structure of the rabbit ryanodine receptor RyR1 at near-atomic resolution
Zhen, Y., Bai, X., Yan, C., Wu, J., Li, Z., Xie, T., Peng, W., Yin, C.-C., Li, X., Scheres, S. H. W., et al. (2014) · Nature · doi:10.1038/nature14063 · Cited by 478
Snake venomics. Strategy and applications
Calvete, J. J., Juárez, P., & Sanz, L. (2007) · Journal of Mass Spectrometry · doi:10.1002/jms.1242 · Cited by 397
Wlodawer, A., Minor, W., Dauter, Z., & Jaskólski, M. (2007) · FEBS Journal · doi:10.1111/j.1742-4658.2007.06178.x · Cited by 334
Structure of the Nav1.4-β1 Complex from Electric Eel
Zhen, Y., Zhou, Q., Wang, L., Wu, J., Zhao, Y., Huang, G., Peng, W., Shen, H., Lei, J., & Yan, N. (2017) · Cell · doi:10.1016/j.cell.2017.06.039 · Cited by 321
Integrated analysis of shotgun proteomic data with PatternLab for proteomics 4.0
Carvalho, P. C., Lima, D. B., Leprevost, F. V., Santos, M. D. M., Fischer, J. S. G., Aquino, P. F., Moresco, J. J., Yates, J. R., & Barbosa, V. C. (2016) · Nature Protocols · doi:10.1038/nprot.2015.133 · Cited by 283
Biological Roles of the Two Components of Crotoxin
Hendon, R. A., & Fraenkel‐Conrat, H. (1971) · Proceedings of the National Academy of Sciences · doi:10.1073/pnas.68.7.1560 · Cited by 279
Radermacher, M., Rao, V., Grassucci, R. A., Frank, J., Timerman, A. P., Fleischer, S., & Wagenknecht, T. (1994) · The Journal of Cell Biology · doi:10.1083/jcb.127.2.411 · Cited by 268
Inverse statistical physics of protein sequences: a key issues review
Cocco, S., Feinauer, C., Figliuzzi, M., Monasson, R., & Weigt, M. (2017) · Reports on Progress in Physics · doi:10.1088/1361-6633/aa9965 · Cited by 261
Sex-based individual variation of snake venom proteome among eighteen Bothrops jararaca siblings
Menezes, M. C., Furtado, M. F., Travaglia-Cardoso, S. R., de Camargo, A. C. M., & Serrano, S. M. T. (2005) · Toxicon · doi:10.1016/j.toxicon.2005.11.007 · Cited by 238
SPIDER: SOFTWARE FOR PROTEIN IDENTIFICATION FROM SEQUENCE TAGS WITH DE NOVO SEQUENCING ERROR
Han, Y., Ma, B., & Zhang, K. (2005) · Journal of Bioinformatics and Computational Biology · doi:10.1142/s0219720005001247 · Cited by 221
Koenig, T. W., Menze, B. H., Kirchner, M., Monigatti, F., Parker, K. C., Patterson, T., Steen, J. J., Hamprecht, F. A., & Steen, H. (2008) · Journal of Proteome Research · doi:10.1021/pr700859x · Cited by 205
Usón, I., & Sheldrick, G. M. (2018) · Acta Crystallographica Section D Structural Biology · doi:10.1107/s2059798317015121 · Cited by 202
Self-citationStructure of β-galactosidase at 3.2-Å resolution obtained by cryo-electron microscopy
Bartesaghi, A., Matthies, D., Banerjee, S., Merk, A., & Subramaniam, S. (2014) · Proceedings of the National Academy of Sciences · doi:10.1073/pnas.1402809111 · Cited by 190
Liska, A. J., & Shevchenko, A. (2003) · PROTEOMICS · doi:10.1002/pmic.200390004 · Cited by 189
PeaksPTM: Mass Spectrometry-Based Identification of Peptides with Unspecified Modifications
Xi, H., He, L., Xin, L., Shan, B., & Ma, B. (2011) · Journal of Proteome Research · doi:10.1021/pr200153k · Cited by 180
Massey, D. J., Calvete, J. J., Sanchez, E. E., Sanz, L., Richards, K., Curtis, R., & Boesen, K. J. (2012) · Journal of Proteomics · doi:10.1016/j.jprot.2012.02.035 · Cited by 170
Ontogenetic variations in the venom proteome of the Amazonian snake Bothrops atrox
Guércio, R. A., Shevchenko, A., Shevchenko, A., López-Lozano, J. L., Paba, J., de Sousa, M. V., & Ricart, C. A. O. (2006) · Proteome Science · doi:10.1186/1477-5956-4-11 · Cited by 159
Peptide and protein de novo sequencing by mass spectrometry
Standing, K. G. (2003) · Current Opinion in Structural Biology · doi:10.1016/j.sbi.2003.09.005 · Cited by 155
Crotoxin: Novel activities for a classic β-neurotoxin
Sampaio, S. C., Hyslop, S., Fontes, M. R. M., Prado-Franceschi, J., Zambelli, V. O., Magro, A. J., Brigatte, P., Gutierrez, V. P., & Cury, Y. (2010) · Toxicon · doi:10.1016/j.toxicon.2010.01.011 · Cited by 149
Self-citationHow Pairwise Coevolutionary Models Capture the Collective Residue Variability in Proteins?
Figliuzzi, M., Barrat-Charlaix, P., & Weigt, M. (2018) · Molecular Biology and Evolution · doi:10.1093/molbev/msy007 · Cited by 143
The Microheterogeneity of Proteins.
Colvin, J. R., Smith, D. B., & Cook, W. H. (1954) · Chemical Reviews · doi:10.1021/cr60170a004 · Cited by 102
Faure, G., Guillaume, J. L., Camoin, L., SALIOU, B., & Bon, C. (1991) · Biochemistry · doi:10.1021/bi00246a028 · Cited by 100
Cryoelectron Microscopy and Image Analysis of the Cardiac Ryanodine Receptor
Sharma, M. R., Penczek, P. A., Grassucci, R. A., Xin, H., Fleischer, S., & Wagenknecht, T. (1998) · Journal of Biological Chemistry · doi:10.1074/jbc.273.29.18429 · Cited by 98
Extending molecular-replacement solutions withSHELXE
Thorn, A., & Sheldrick, G. M. (2013) · Acta Crystallographica Section D Biological Crystallography · doi:10.1107/s0907444913027534 · Cited by 92
Amorim, F. G., Costa, T. R., Baiwir, D., Pauw, E. D., Quinton, L., & Sampaio, S. V. (2018) · Toxins · doi:10.3390/toxins10050177 · Cited by 82
Liu, Z., Zhang, J., Li, P., Chen, S. R. W., & Wagenknecht, T. (2002) · Journal of Biological Chemistry · doi:10.1074/jbc.m208124200 · Cited by 75
CryoEM maps are full of potential
Marques, M. A., Purdy, M. D., & Yeager, M. J. (2019) · Current Opinion in Structural Biology · doi:10.1016/j.sbi.2019.04.006 · Cited by 69
Averaged kick maps: less noise, more signal…and probably less bias
Pražnikar, J., Afonine, P. V., Gunčar, G., Adams, P. D., & Türk, V. (2009) · Acta Crystallographica Section D Biological Crystallography · doi:10.1107/s0907444909021933 · Cited by 65
Chojnowski, G., Simpkin, A. J., Leonardo, D. A., Seifert-Dávila, W., Vivas-Ruiz, D. E., Keegan, R. M., & Rigden, D. J. (2021) · IUCrJ · doi:10.1107/s2052252521011088 · Cited by 65
Wilson, D. T. R., & Daly, N. L. (2018) · Microarrays · doi:10.3390/ht7030019 · Cited by 63
ARCIMBOLDO_LITE: single-workstation implementation and use
Sammito, M. D., Millán, C., Frieske, D., et al. (2015) · Acta Crystallographica Section D Biological Crystallography · doi:10.1107/s1399004715010846 · Cited by 61
Mass Spectrometry as a Tool for Protein Crystallography
Cohen, S. L., & Chait, B. T. (2001) · Annual Review of Biophysics and Biomolecular Structure · doi:10.1146/annurev.biophys.30.1.67 · Cited by 59
Lysozyme: A model enzyme in protein crystallography
Strynadka, N. C. J., & James, M. N. G. (1996) · Proceedings of the Fourth International Symposium on Polarization Phenomena in Nuclear Reactions · doi:10.1007/978-3-0348-9225-4_11 · Cited by 58
On the interpretation of electron microscopic maps of biological macromolecules
Wang, J., & Moore, P. B. (2016) · Protein Science · doi:10.1002/pro.3060 · Cited by 58
Calvete, J. J. (2009) · Journal of Proteomics · doi:10.1016/j.jprot.2009.01.018 · Cited by 55
Kvansakul, M., Hopf, M., Ries, A., Timpl, R., & Hohenester, E. (2001) · The EMBO Journal · doi:10.1093/emboj/20.19.5342 · Cited by 54
Williams, V. K., & White, J. (1992) · Toxicon · doi:10.1016/0041-0101(92)90473-i · Cited by 49
Combining mass spectrometry with database interrogation strategies in proteomics
Liska, A. J., & Shevchenko, A. (2003) · TrAC Trends in Analytical Chemistry · doi:10.1016/s0165-9936(03)00507-7 · Cited by 48
Protein Structure from Experimental Evolution
Stiffler, M. A., Poelwijk, F. J., Brock, K. P., Stein, R. R., Riesselman, A. J., Teyra, J., Sidhu, S. S., Marks, D. S., Gauthier, N. P., & Sander, C. (2019) · Cell Systems · doi:10.1016/j.cels.2019.11.008 · Cited by 47
Diemer, H., Elias, M. H., Renault, F., Rochu, D., Contreras‐Martel, C., Schaeffer‐Reiss, C., DORSSELAER, A. V., & Chabrière, É. (2007) · Proteins Structure Function and Bioinformatics · doi:10.1002/prot.21866 · Cited by 43
Adams, L. F., Davey, S., & Scott, K. (2002) · Biochimica et Biophysica Acta (BBA) - Molecular Basis of Disease · doi:10.1016/s0925-4439(01)00104-1 · Cited by 42
Saul, F. A., Prijatelj, P., Normand, B. V.-L., Villette, B., Raynal, B. D. E., Pungerčar, J., Križaj, I., & Faure, G. (2009) · Journal of Structural Biology · doi:10.1016/j.jsb.2009.10.010 · Cited by 39
Marchi‐Salvador, D. P., Borges, R. J., Lomonte, B., Lewin, M. R., & Fontes, M. R. M. (2021) · Biochimica et Biophysica Acta (BBA) - General Subjects · doi:10.1016/j.bbagen.2021.129913 · Cited by 39
Self-citationBreaking the next Cryo-EM resolution barrier – Atomic resolution determination of proteins!Preprint
Yip, K. M., Fischer, N., Paknia, E., Chari, A., & Stark, H. (2020) · bioRxiv (Cold Spring Harbor Laboratory) · doi:10.1101/2020.05.21.106740 · Cited by 33
Resolution of isotoxins in the β-bungarotoxin family
Chu, C., Li, S.-H., & Chen, Y. (1995) · Journal of Chromatography A · doi:10.1016/0021-9673(94)01173-c · Cited by 27
Sequence assignment for low-resolution modelling of protein crystal structures
Chojnowski, G., Pereira, J., & Lamzin, V. S. (2019) · Acta Crystallographica Section D Structural Biology · doi:10.1107/s2059798319009392 · Cited by 26
Multiple forms of medicinal leech destabilase-lysozyme
Zavalova, L. L., Artamonova, I. I., Berezhnoy, S., Tagaev, A. A., Baskova, I. P., Andersen, J., Roepstorff, P., & Egorov, T. A. (2003) · Biochemical and Biophysical Research Communications · doi:10.1016/s0006-291x(03)00896-9 · Cited by 23
Borges, R. J., Marchi‐Salvador, D. P., Campanelli, H. B., Pimenta, D. C., Neto, M. D. O., Usón, I., & Fontes, M. R. M. (2021) · International Journal of Biological Macromolecules · doi:10.1016/j.ijbiomac.2021.09.083 · Cited by 18
Self-citationPurification, Characterization, and Biosynthesis of Bovine Cartilage Lysozyme Isoforms
Moss, J. M., Damme, M.-P. I. V., Murphy, W. H., Stanton, P. G., Thomas, P., & Preston, B. N. (1997) · Archives of Biochemistry and Biophysics · doi:10.1006/abbi.1996.9828 · Cited by 17
Šimkovic, F., Thomas, J. M. H., Keegan, R. M., Winn, M., Mayans, O. M., & Rigden, D. J. (2016) · IUCrJ · doi:10.1107/s2052252516008113 · Cited by 17
Marchi‐Salvador, D. P., Fernandes, C. A. H., Magro, A. J., Marchi‐Salvador, D. P., Cavalcante, W. L. G., Fernández, R., Gallacci, M., Soares, A. M., Oliveira, C. L. P., & Fontes, M. R. M. (2013) · PLoS ONE · doi:10.1371/journal.pone.0060610 · Cited by 16
Self-citationSachdeva, R., Darbinian, N., Khalili, K., Amini, S., Gonzalez, D., Djeghader, A., Chabrière, É., Suh, A., Scott, K., & Simm, M. (2013) · PLoS ONE · doi:10.1371/journal.pone.0069623 · Cited by 16
Growth inhibition of malignant glioblastoma by DING protein
Bookland, M. J., Darbinian, N., Weaver, M. W., Amini, S., & Khalili, K. (2011) · Journal of Neuro-Oncology · doi:10.1007/s11060-011-0743-x · Cited by 13
SEQUENCE SLIDER: expanding polyalanine fragments for phasing with multiple side-chain hypotheses
Borges, R. J., Meindl, K., Triviño, J., Sammito, M. D., Medina, A., Millán, C., Alcorlo, M., Hermoso, J. A., Fontes, M. R. M., & Usón, I. (2020) · Acta Crystallographica Section D Structural Biology · doi:10.1107/s2059798320000339 · Cited by 12
Self-citationMarchi‐Salvador, D. P., Borges, R. J., Eulálio, M. D. M. C., dos Santos, L. D., & Fontes, M. R. M. (2020) · Biochimie · doi:10.1016/j.biochi.2020.09.001 · Cited by 12
Self-citationHow do I get the most out of my protein sequence using bioinformatics tools?
Pereira, J., & Alva, V. (2021) · Acta Crystallographica Section D Structural Biology · doi:10.1107/s2059798321007907 · Cited by 10
Separation of the subunits of crotoxin by high-performance liquid chromatography
Wu, S.-H., Chang, F., & Tzeng, M.-C. (1983) · Journal of Chromatography A · doi:10.1016/s0021-9673(01)88024-9 · Cited by 9
Marchi‐Salvador, D. P., Fernandes, C. A. H., Corrêa, L. C. S., Santos‐Filho, N. A., Soares, A. M., & Fontes, M. R. M. (2009) · Acta Crystallographica Section F Structural Biology and Crystallization Communications · doi:10.1107/s1744309109032631 · Cited by 9
Self-citationGuo, J., Uppal, S., Easthon, L. M., Mueser, T. C., & Griffith, W. P. (2011) · International Journal of Mass Spectrometry · doi:10.1016/j.ijms.2011.06.001 · Cited by 5
Saraswathy, N., & Ramalingam, P. (2011) · Elsevier eBooks · doi:10.1533/9781908818058.193 · Cited by 4
Metadata
- Authors
- Borges, R. J., Salvador, G. H. M., Pimenta, D. C., dos Santos, L. D., Fontes, M. R. M., & Usón, I.
- Affiliations
- Consejo Superior de Investigaciones Científicas (ES)
- Departament of Biophysics and Pharmacology, Biosciences Institute, São Paulo State University (UNESP), Botucatu, São Paulo 18618-689, Brazil
- Instituto Butantan (BR)
- Universidade Estadual Paulista (Unesp) (BR)
- Institució Catalana de Recerca i Estudis Avançats (ES)
- Corresponding author
- Borges, Rafael J
- Venue
- Nucleic Acids Research
- Publisher
- Oxford University Press (OUP)
- Published
- 2022-02-01
- Volume
- 50
- Issue
- 9
- Pages
- e50-e50
- ISSN
- 0305-1048 (ISSN-L)
- 1362-4962
- PMC
- PMC9122596
- OpenAlex
- W4210433582
- Cited by
- 5
- References
- 89
- Citations by year
- 2025: 1 · 2024: 2 · 2023: 1 · 2022: 1
- FWCI
- 0.45
- Type
- journal article
- Language
- en
- Open access
- gold
- doi.org
- Licence
- Locations
- Nucleic Acids Research (publishedVersion, cc-by-nc)
- bioRxiv (Cold Spring Harbor Laboratory) (acceptedVersion, cc-by-nd)
- PubMed Central (publishedVersion, cc-by-nc)
- PubMed (publishedVersion)
- LA Referencia (Red Federada de Repositorios Institucionales de Publicaciones Científicas) (publishedVersion, other-oa)
- DIGITAL.CSIC (Spanish National Research Council (CSIC)) (submittedVersion, cc-by-nc-nd)
- Funders
- São Paulo Research Foundation (2015/17286–0, 2019/05958-4, 2020/10143–7)
- FAPESP (2016/24191–8)
- Ministerio de Ciencia e Innovación (PGC2018-101370-BI00 AEI/FEDER/UE)
- CNPq (301974/2019–5, 302883/2017–7)
- Topics
- Physical Sciences › Chemistry › Spectroscopy › Advanced Proteomics Techniques and Applications
- Physical Sciences › Chemistry › Spectroscopy › Mass Spectrometry Techniques and Applications
- Life Sciences › Pharmacology, Toxicology and Pharmaceutics › Toxicology › Venomous Animal Envenomation and Studies
- Keywords
- protein isoforms, sequence heterogeneity, natural products, de novo sequencing, mass spectrometry, sequence conservation, point mutation detection, metalloproteinases, phospholipase A2, crotoxin, Crotalus durissus collilineatus, lysozyme, venom proteins
- MeSH terms
- Animals, Crotalid Venoms, Crotoxin, Software, Crotalus, Protein Isoforms, Complex Mixtures, Phospholipases A2
About these checks
Registry, retraction, Cites and statistics results are computed, not judged, with one exception: a printed reference that no index lists is read once by a model before it counts as a citation error. Claims are extracted by a model and kept only when their quote appears verbatim in the text; each cited source is then checked, with a model’s help, for whether it says what the claim relies on. Those verdicts can be wrong — read the claim’s quote and the cited source before relying on one.
Statistics and arithmetic are recomputed, not judged.
Confidence bands are shown only for fields calibrated on our annotated test set. None is calibrated yet, so no band is shown.
What counts as a claim ›How we measure confidence ›How we check this ›
Are you an author, or do you see a problem with this page? Request a review
Data sources
Bibliographic data: Semantic Scholar, OpenAlex, Crossref.
Contains information from the Semantic Scholar Academic Graph Datasets, made available under the ODC Attribution License (ODC-BY 1.0).
Semantic Scholar’s data is described in: Kinney, R., et al. (2023). The Semantic Scholar Open Data Platform. arXiv:2301.10140.
