

The DOI matches its Crossref record; 49 of the 50 references it cites were found in a registry or an index.
Deep sequencing-based expression analysis shows major advances in robustness, resolution and inter-lab portability over five microarray platforms.
Open accessAbstract
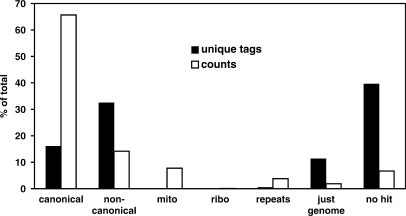
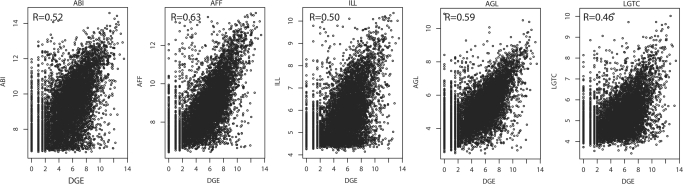
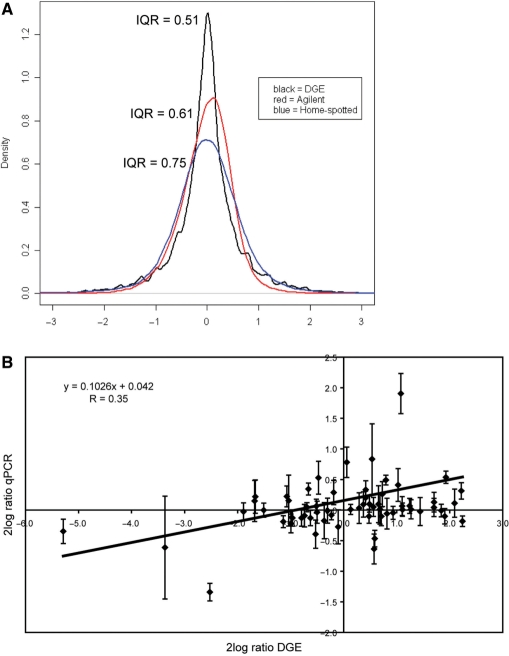
The hippocampal expression profiles of wild-type mice and mice transgenic for deltaC-doublecortin-like kinase were compared with Solexa/Illumina deep sequencing technology and five different microarray platforms. With Illumina's digital gene expression assay, we obtained approximately 2.4 million sequence tags per sample, their abundance spanning four orders of magnitude. Results were highly reproducible, even across laboratories. With a dedicated Bayesian model, we found differential expression of 3179 transcripts with an estimated false-discovery rate of 8.5%. This is a much higher figure than found for microarrays. The overlap in differentially expressed transcripts found with deep sequencing and microarrays was most significant for Affymetrix. The changes in expression observed by deep sequencing were larger than observed by microarrays or quantitative PCR. Relevant processes such as calmodulin-dependent protein kinase activity and vesicle transport along microtubules were found affected by deep sequencing but not by microarrays. While undetectable by microarrays, antisense transcription was found for 51% of all genes and alternative polyadenylation for 47%. We conclude that deep sequencing provides a major advance in robustness, comparability and richness of expression profiling data and is expected to boost collaborative, comparative and integrative genomics studies.
Overview
The claims and statistics of this paper haven’t been checked yet.
Free: it reads the open-access text and checks the first 5 claims that cite a source we can check. Create a free account to check every claim.
Integrity signals
Registry
Cites
Statistics
Figures

Verification
Claims the paper makes
The claims and statistics of this paper haven’t been checked yet.
Free: it reads the open-access text and checks the first 5 claims that cite a source we can check. Create a free account to check every claim.
Claims other papers make about this one
Each is checked against this paper’s own text: does it say what the citing paper says it does?
The cited source doesn’t support the claim as written.
In the citing paper
“DGE can eliminate background signals caused by cross-hybridization and share a higher consistence with qPCR than other platforms [62].”
From Digital Gene Expression Analysis Based on Integrated De Novo Transcriptome Assembly of Sweet Potato [Ipomoea batatas (L.) Lam.] (2012) · cites this paper as [62]
Checked by a reasoning model — may be wrong.
Experimental — accuracy not yet measuredThe source backs part of the claim, not all of it — or backs it for a different population, condition or comparison.
In the citing paper
“Comparing with other genome-wide microarray expression profiling platforms, deep sequencing-based expression analysis does not need laborious and costly cloning and sequencing steps [62].”
From Digital Gene Expression Analysis Based on Integrated De Novo Transcriptome Assembly of Sweet Potato [Ipomoea batatas (L.) Lam.] (2012) · cites this paper as [62]
Experimental — accuracy not yet measuredThe cited source says what the claim attributes to it.
In the citing paper
“The transcriptome differences of the seven tissues (including roots at different developmental stages) were characterized using Illumina DGE technology, which is essentially an improved version of MPSS [61], [62].”
From Digital Gene Expression Analysis Based on Integrated De Novo Transcriptome Assembly of Sweet Potato [Ipomoea batatas (L.) Lam.] (2012) · cites this paper as [62]
The cited source says what the claim attributes to it.
In the citing paper
“Differences in mRNA abundance values determined using different methods (qRT-PCR and microarrays) have been described previously444546.”
From Human cellular CYBA UTR sequences increase mRNA translation without affecting the half-life of recombinant RNA transcripts (2016) · cites this paper as [45]
Self-check
Percentages, sums and reported differences re-computed from the paper’s own numbers.
The self-check needs the paper’s full text.
Citations
Cites
Mapping and quantifying mammalian transcriptomes by RNA-Seq
Mortazavi, A., Williams, B. A., McCue, K., Schaeffer, L., & Wold, B. (2008) · Nature Methods · doi:10.1038/nmeth.1226 · Cited by 13,696 · cited 1×
“larger group of samples: We demonstrate that 2 million tags are required to reliably detect low abundant genes with DGE, whereas RNASeq requires at least 20 million tags per sample to obtain reasonable coverage of most transcripts (29,36).”
BackgroundGenome sequencing in microfabricated high-density picolitre reactors
Margulies, M., Egholm, M., Altman, W. E., Attiya, S., Bader, J. S., Bemben, L. A., Berka, J., Braverman, M. S., Chen, Y.-J., Chen, Z., et al. (2005) · Nature · doi:10.1038/nature03959 · Cited by 7,693
limma: Linear Models for Microarray Data
Smyth, G. K. (2005) · Statistics for Biology and Health · doi:10.1007/0-387-29362-0_23 · Cited by 5,796
Bioinformatics and Computational Biology Solutions Using R and Bioconductor
(2005) · Statistics for Biology and Health · doi:10.1007/0-387-29362-0 · Cited by 3,289
RNA-seq: An assessment of technical reproducibility and comparison with gene expression arrays
Marioni, J. C., Mason, C. E., Mane, S. M., Stephens, M., & Gilad, Y. (2008) · Genome Research · doi:10.1101/gr.079558.108 · Cited by 2,771 · cited 1×
“In most previously published reports analyzing differential gene expression in count-based data, the statistical tests applied did not account for within-group variation (28,34).”
MethodThe Transcriptional Landscape of the Yeast Genome Defined by RNA Sequencing
Nagalakshmi, U., Wang, Z., Waern, K., Shou, C., Raha, D., Gerstein, M., & Snyder, M. (2008) · Science · doi:10.1126/science.1158441 · Cited by 2,479
MAQC Consortium, Shi, L., Shi, L., Reid, L. H., Jones, W. D., Shippy, R., Warrington, J. A., Baker, S. C., Collins, P. J., de Longueville, F., et al. (2006) · Nature Biotechnology · doi:10.1038/nbt1239 · Cited by 2,126 · cited 1×
“In samples with larger differences in gene expression, like the samples analyzed by the MAQC consortium (46), the correlation is likely higher.”
MethodAntisense Transcription in the Mammalian Transcriptome
Katayama, S., Tomaru, Y., Kasukawa, T., Waki, K., Nakanishi, M., Nakamura, M., Nishida, H., Yap, C. C., Suzuki, M., Kawai, J., et al. (2005) · Science · doi:10.1126/science.1112009 · Cited by 1,661
Accurate Multiplex Polony Sequencing of an Evolved Bacterial Genome
Shendure, J., Porreca, G. J., Reppas, N. B., Lin, X., McCutcheon, J. P., Rosenbaum, A. M., Wang, M. D., Zhang, K., Mitra, R. D., & Church, G. M. (2005) · Science · doi:10.1126/science.1117389 · Cited by 1,402
Gene expression analysis by massively parallel signature sequencing (MPSS) on microbead arrays.
Brenner, S., Johnson, M., Bridgham, J., Golda, G., Lloyd, D. H., Johnson, D., Luo, S., McCurdy, S., Foy, M., Ewan, M., et al. (2000) · Nature Biotechnology · doi:10.1038/76469 · Cited by 1,360
Research works printed but not linked: 1
- Snedecor, 1989, Square root transformation for counts, 287
Cited by
A scaling normalization method for differential expression analysis of RNA-seq data
Robinson, M. D., & Oshlack, A. (2010) · Genome Biology · doi:10.1186/gb-2010-11-3-r25 · Cited by 7,876
Gene ontology analysis for RNA-seq: accounting for selection bias
Young, M. D., Wakefield, M. J., Smyth, G. K., & Oshlack, A. (2010) · Genome Biology · doi:10.1186/gb-2010-11-2-r14 · Cited by 7,107
McCarthy, D. J., Chen, Y., & Smyth, G. K. (2012) · Nucleic Acids Research · doi:10.1093/nar/gks042 · Cited by 5,195
Correlation of mRNA and protein in complex biological samples
Maier, T., Güell, M., & Serrano, L. (2009) · FEBS Letters · doi:10.1016/j.febslet.2009.10.036 · Cited by 1,802
“A comparison with five array platforms demonstrates a better resolution, reproducibility and robustness of a deep sequencing based method [75].”
Bullard, J. H., Purdom, E., Hansen, K. D., & Dudoit, S. (2010) · BMC Bioinformatics · doi:10.1186/1471-2105-11-94 · Cited by 1,680
“literature include t-statistics with square root-transformed standard errors and Bayesian statistics based on the Beta-Binomial distribution (Hoen et al., 2008).”
Method
Metadata
- Authors
- 't Hoen, P. A. C., Ariyurek, Y., Thygesen, H. H., Vreugdenhil, E., Vossen, R. H. A. M., de Menezes, R. X., Boer, J. M., van Ommen, G.-J. B., & den Dunnen, J. T.
- Affiliations
- Leiden University (NL)
- Venue
- Nucleic Acids Research
- Publisher
- Oxford University Press (OUP)
- Published
- 2008-10-15
- Volume
- 36
- Issue
- 21
- Pages
- e141-e141
- ISSN
- 0305-1048 (ISSN-L)
- 1362-4962
- PMC
- PMC2588528
- OpenAlex
- W2116166762
- Cited by
- 742
- References
- 50
- Citations by year
- 2026: 3 · 2025: 2 · 2024: 4 · 2023: 19 · 2022: 24 · 2021: 19 · 2020: 25 · 2019: 32 · 2018: 33 · 2017: 24 · 2016: 43 · 2015: 71 · 2014: 78 · 2013: 94 · 2012: 89
- FWCI
- 24.98
- Type
- journal article
- Language
- en
- Open access
- gold
- doi.org
- Licence
- Locations
- Nucleic Acids Research (publishedVersion, cc-by-nc)
- PubMed Central (publishedVersion, cc-by-nc)
- PubMed (publishedVersion)
- Funders
- Nederlandse Organisatie voor Wetenschappelijk Onderzoek
- Leids Universitair Medisch Centrum
- Topics
- Life Sciences › Biochemistry, Genetics and Molecular Biology › Molecular Biology › Gene expression and cancer classification
- Life Sciences › Biochemistry, Genetics and Molecular Biology › Molecular Biology › Genomics and Phylogenetic Studies
- Life Sciences › Biochemistry, Genetics and Molecular Biology › Molecular Biology › Single-cell and spatial transcriptomics
- Keywords
- deep sequencing, microarray comparison, hippocampus, transgenic mice, differential gene expression, false discovery rate, Bayesian model, interlaboratory reproducibility, antisense transcription, alternative polyadenylation, calcium/calmodulin-dependent protein kinase, vesicle trafficking, gene expression profiling
- MeSH terms
- Doublecortin-Like Kinases, Animals, Bayes Theorem, Hippocampus, Male, Mice, Inbred C57BL, Mice, Transgenic, Reproducibility of Results, Polymerase Chain Reaction, Sequence Tagged Sites, RNA, Antisense, Protein Serine-Threonine Kinases, Alternative Splicing, Sequence Analysis, DNA, Oligonucleotide Array Sequence Analysis, Gene Expression Profiling, Polyadenylation, Mice
About these checks
Registry, retraction, Cites and statistics results are computed, not judged, with one exception: a printed reference that no index lists is read once by a model before it counts as a citation error. Claims are extracted by a model and kept only when their quote appears verbatim in the text; each cited source is then checked, with a model’s help, for whether it says what the claim relies on. Those verdicts can be wrong — read the claim’s quote and the cited source before relying on one.
Statistics and arithmetic are recomputed, not judged.
Confidence bands are shown only for fields calibrated on our annotated test set. None is calibrated yet, so no band is shown.
What counts as a claim ›How we measure confidence ›How we check this ›
Are you an author, or do you see a problem with this page? Request a review
How to cite
Cite CoChat for the checks on this page, and the paper for its own findings.
- This page
- CoChat. (2026). Citation check: Deep sequencing-based expression analysis shows major advances in robustness, resolution and inter-lab portability over five microarray platforms. https://app.cochat.ai/papers/10.1093/nar/gkn705
- The paper
- 't Hoen, P. A. C., Ariyurek, Y., Thygesen, H. H., Vreugdenhil, E., Vossen, R. H. A. M., de Menezes, R. X., Boer, J. M., van Ommen, G.-J. B., & den Dunnen, J. T. (2008). Deep sequencing-based expression analysis shows major advances in robustness, resolution and inter-lab portability over five microarray platforms. Nucleic Acids Research. https://doi.org/10.1093/nar/gkn705
Data sources
Bibliographic data: Semantic Scholar, OpenAlex, Crossref.
Contains information from the Semantic Scholar Academic Graph Datasets, made available under the ODC Attribution License (ODC-BY 1.0).
Semantic Scholar’s data is described in: Kinney, R., et al. (2023). The Semantic Scholar Open Data Platform. arXiv:2301.10140.
