Cited by 308MicroRNA in disease regulationRNA Interference and Gene DeliveryCancer-related molecular mechanisms research

The DOI matches its Crossref record; 28 of the 29 references it cites were found in a registry or an index.

Vectors expressing efficient RNA decoys achieve the long-term suppression of specific microRNA activity in mammalian cells

Open access
Haraguchi, Takeshi, Ozaki, Yuka, Iba, Hideo·2009·Nucleic Acids Research

Abstract

Whereas the strong and stable suppression of specific microRNA activity would be essential for the functional analysis of these molecules, and also for the development of therapeutic applications, effective inhibitory methods to achieve this have not yet been fully established. In our current study, we tested various RNA decoys which were designed to efficiently expose indigestible complementary RNAs to a specific miRNA molecule. These inhibitory RNAs were at the same time designed to be expressed in lentiviral vectors and to be transported into the cytoplasm after transcription by RNA polymerase III. We report the optimal conditions that we have established for the design of such RNA decoys (we term these molecules TuD RNAs; tough decoy RNAs). We finally demonstrate that TuD RNAs induce specific and strong biological effects and also show that TuD RNAs achieve the efficient and long-term-suppression of specific miRNAs for over 1 month in mammalian cells.

Overview

The claims and statistics of this paper haven’t been checked yet.

Run the check — free, no account needed. It reads the open-access text and checks the sources it cites.

A few free checks a day · papers already verified open instantly · results are public

Integrity signals

Registry

Crossref · 10.1093/nar/gkp040

Cites

28 of 28 references verified0 citation errors · 0 not checkable

Statistics

Figures

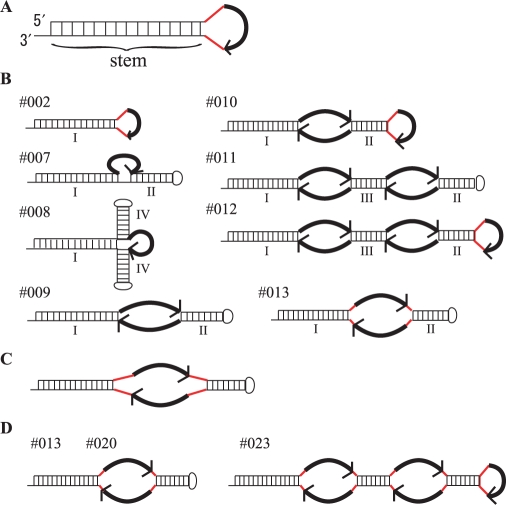
Figure 1. Structures of decoy RNAs for miR140-3p. The bold black curved arrow represents the miRNA-binding site (MBS) (5′ → 3′). The red lines represent the linkers in these molecules. (A) Structure of the prototype-decoy RNA (Decoy RNA #001-006). (B) Structures of Decoy RNA #002 and #007-013. I, II, III and IV indicate the stems present in these molecules. The lengths of each stem sequence (I, II, III and IV) for the Decoy RNA panel are shown in Table 2. (C) Structures of Decoy RNA #018–022. The lengths of linker sequence for the Decoy RNA panel are shown in Table 4. (D) Structures of Decoy RNA #013, 020 and 023. The MBS sequence for the Decoy RNA panel are shown in Table 5.
Figure 1. Structures of decoy RNAs for miR140-3p. The bold black curved arrow represents the miRNA-binding site (MBS) (5′ → 3′). The red lines represent the linkers in these molecules. (A) Structure of the prototype-decoy RNA (Decoy RNA #001-006). (B) Structures of Decoy RNA #002 and #007-013. I, II, III and IV indicate the stems present in these molecules. The lengths of each stem sequence (I, II, III and IV) for the Decoy RNA panel are shown in Table 2. (C) Structures of Decoy RNA #018–022. The lengths of linker sequence for the Decoy RNA panel are shown in Table 4. (D) Structures of Decoy RNA #013, 020 and 023. The MBS sequence for the Decoy RNA panel are shown in Table 5.CC BY-NC · PubMed Central
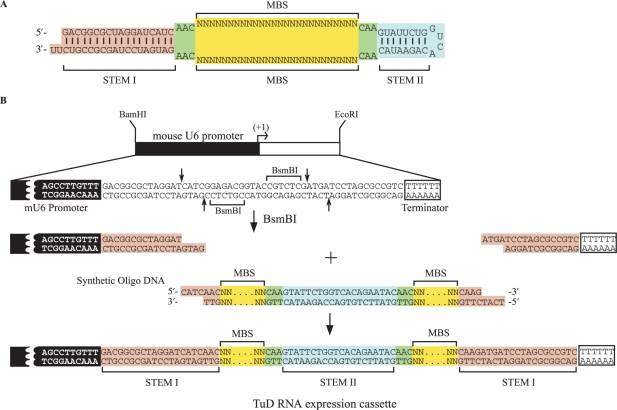
Figure 2. (A) Representative structure of the TuD RNAs. (B) Schematic representation of the generation of TuD RNA expression cassettes driven by mouse U6 promoter. 80–90mer synthetic oligonucleotides pairs are annealed and cloned between the two BsmBI sites present in the BamHI–EcoRI fragment (the original cassette) to generate TuD RNA expression cassettes.
Figure 2. (A) Representative structure of the TuD RNAs. (B) Schematic representation of the generation of TuD RNA expression cassettes driven by mouse U6 promoter. 80–90mer synthetic oligonucleotides pairs are annealed and cloned between the two BsmBI sites present in the BamHI–EcoRI fragment (the original cassette) to generate TuD RNA expression cassettes.CC BY-NC · PubMed Central
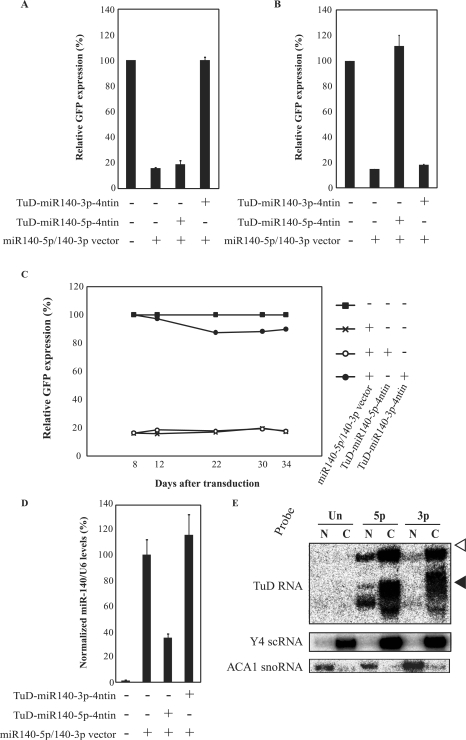
Figure 3. Generality, specificity and duration of the inhibitory effects of TuD RNA. (A) Effects of TuD-miR140-5p-4ntin or TuD-miR140-3p-4ntin on miR-140-3p activity detected by the GFP reporter cell system as shown in Table 1, except that the GFP expression levels were determined at 8–12 days post-transduction (Supplementary Figure S3D and E). (B) Effects of TuD-miR140-5p-4ntin or TuD-miR-140-3p-4ntin on miR-140-5p activity. HeLaS3 cells harbouring both the miR-140-5p reporter and the miR140-5p/140-3p vector were transduced with the lentivirus vectors expressing the corresponding TuD RNAs and the GFP expression levels were determined at 8–12 days post-transduction. The expression levels were normalized to those of HeLaS3 cells harbouring miR-140-5p reporter alone and are represented by the mean ± SEM (n = 3). (C) Time course of the inhibitory effects of TuD-miR140-3p-4ntin on miR-140-3p activity. Relative GFP expression levels were determined as shown in Table 1. (D) Levels of mature miR-140-5p in the cells described in (B) determined by quantitative real-time RT-PCR. The miR-140-5p expression levels were normalized to those of HeLaS3 cells harbouring both the miR-140-5p reporter and the miR140-5p/140-3p vector and are represented by the mean ± SEM (n = 3). U6 snRNA was served as an endogenous control. (E) Analysis of the sub-cellular localization of TuD RNAs. The migration positions of Y4 small cytoplasmic RNA (Y4 scRNA, 93 nt) and ACA1 small nucleolar RNA (ACA1 snoRNA, 130 nt) on the same gel are indicated by black and open triangles, respectively. Y4 scRNA and ACA1 snoRNA were served as marker RNAs of cytoplasmic and nuclear fractions, respectively. Un, untransduced cells; 5p, TuD-miR140-5p-transduced cells; 3p, TuD-miR140-3p-transduced cells; N, nucleus; C, cytoplasm.
Figure 3. Generality, specificity and duration of the inhibitory effects of TuD RNA. (A) Effects of TuD-miR140-5p-4ntin or TuD-miR140-3p-4ntin on miR-140-3p activity detected by the GFP reporter cell system as shown in Table 1, except that the GFP expression levels were determined at 8–12 days post-transduction (Supplementary Figure S3D and E). (B) Effects of TuD-miR140-5p-4ntin or TuD-miR-140-3p-4ntin on miR-140-5p activity. HeLaS3 cells harbouring both the miR-140-5p reporter and the miR140-5p/140-3p vector were transduced with the lentivirus vectors expressing the corresponding TuD RNAs and the GFP expression levels were determined at 8–12 days post-transduction. The expression levels were normalized to those of HeLaS3 cells harbouring miR-140-5p reporter alone and are represented by the mean ± SEM (n = 3). (C) Time course of the inhibitory effects of TuD-miR140-3p-4ntin on miR-140-3p activity. Relative GFP expression levels were determined as shown in Table 1. (D) Levels of mature miR-140-5p in the cells described in (B) determined by quantitative real-time RT-PCR. The miR-140-5p expression levels were normalized to those of HeLaS3 cells harbouring both the miR-140-5p reporter and the miR140-5p/140-3p vector and are represented by the mean ± SEM (n = 3). U6 snRNA was served as an endogenous control. (E) Analysis of the sub-cellular localization of TuD RNAs. The migration positions of Y4 small cytoplasmic RNA (Y4 scRNA, 93 nt) and ACA1 small nucleolar RNA (ACA1 snoRNA, 130 nt) on the same gel are indicated by black and open triangles, respectively. Y4 scRNA and ACA1 snoRNA were served as marker RNAs of cytoplasmic and nuclear fractions, respectively. Un, untransduced cells; 5p, TuD-miR140-5p-transduced cells; 3p, TuD-miR140-3p-transduced cells; N, nucleus; C, cytoplasm.CC BY-NC · PubMed Central
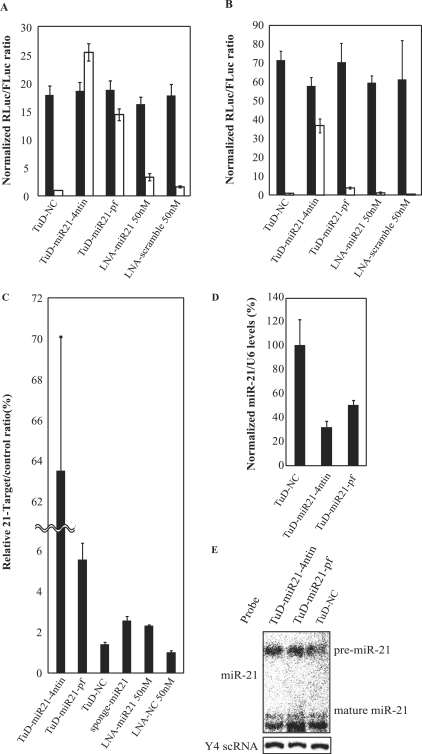
Figure 4. Inhibitory effects of TuD RNA on endogenous miR-21 activity. TuD RNA expression plasmid vectors or LNA/DNA antisense oligonucleotides were transiently transfected into PA-1 (A) or HCT-116 (B) cells together with the Renilla luciferase miR-21 reporter (miR-21-RL) (open bars) or the untargeted control Renilla luciferase reporter (UT-RL) (black bars) as well as the Firefly luciferase reporter (FL) as a transfection control. After performing a dual luciferase assay, the expression levels were normalized to the ratio of the activity of miR-21-RL to that of FL in TuD-NC vector-transfected PA-1 (A) or HCT-116 (B) cells and are represented by the mean ± SEM (n = 3). (C) Comparison of the inhibitory effects of TuD RNA and a conventional miRNA inhibitory vector. A dual luciferase assay was performed 72 h after transfection in HCT-116 cells. The ratio of miR-21-RL/FL to UT-RL/FL are represented by the mean ± SEM (n = 3) as the expression levels. (D) The levels of mature miR-21 in RNA from HCT-116 cells transfected with TuD-miR21 expression vectors determined by quantitative real time RT-PCR. The miR-21 expression levels were normalized to those of HCT-116 cells transfected with TuD-NC expression vector and are represented by the mean ± SEM (n = 3). U6 snRNA was served as an endogenous control. (E) The levels of pre- and mature miR-21 in the same RNA samples as (D) determined by northern blotting. Y4 scRNA was served as a loading control.
Figure 4. Inhibitory effects of TuD RNA on endogenous miR-21 activity. TuD RNA expression plasmid vectors or LNA/DNA antisense oligonucleotides were transiently transfected into PA-1 (A) or HCT-116 (B) cells together with the Renilla luciferase miR-21 reporter (miR-21-RL) (open bars) or the untargeted control Renilla luciferase reporter (UT-RL) (black bars) as well as the Firefly luciferase reporter (FL) as a transfection control. After performing a dual luciferase assay, the expression levels were normalized to the ratio of the activity of miR-21-RL to that of FL in TuD-NC vector-transfected PA-1 (A) or HCT-116 (B) cells and are represented by the mean ± SEM (n = 3). (C) Comparison of the inhibitory effects of TuD RNA and a conventional miRNA inhibitory vector. A dual luciferase assay was performed 72 h after transfection in HCT-116 cells. The ratio of miR-21-RL/FL to UT-RL/FL are represented by the mean ± SEM (n = 3) as the expression levels. (D) The levels of mature miR-21 in RNA from HCT-116 cells transfected with TuD-miR21 expression vectors determined by quantitative real time RT-PCR. The miR-21 expression levels were normalized to those of HCT-116 cells transfected with TuD-NC expression vector and are represented by the mean ± SEM (n = 3). U6 snRNA was served as an endogenous control. (E) The levels of pre- and mature miR-21 in the same RNA samples as (D) determined by northern blotting. Y4 scRNA was served as a loading control.CC BY-NC · PubMed Central
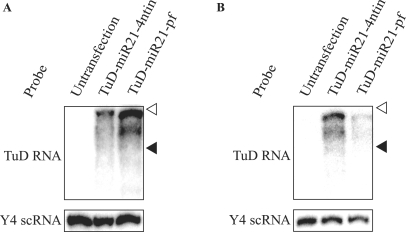
Figure 5. Detection of TuD RNA molecules by northern blotting. TuD RNA expression plasmid vectors were transfected into PA-1 (A) or HCT-116 (B) cells and TuD-miR21-4ntin and TuD-miR21-pf were detected by northern blotting. The positions of Y4 scRNA (93 nt) and ACA1 snoRNA (130 nt) are indicated by black and open triangles, respectively. Y4 scRNA was served as a loading control.
Figure 5. Detection of TuD RNA molecules by northern blotting. TuD RNA expression plasmid vectors were transfected into PA-1 (A) or HCT-116 (B) cells and TuD-miR21-4ntin and TuD-miR21-pf were detected by northern blotting. The positions of Y4 scRNA (93 nt) and ACA1 snoRNA (130 nt) are indicated by black and open triangles, respectively. Y4 scRNA was served as a loading control.CC BY-NC · PubMed Central
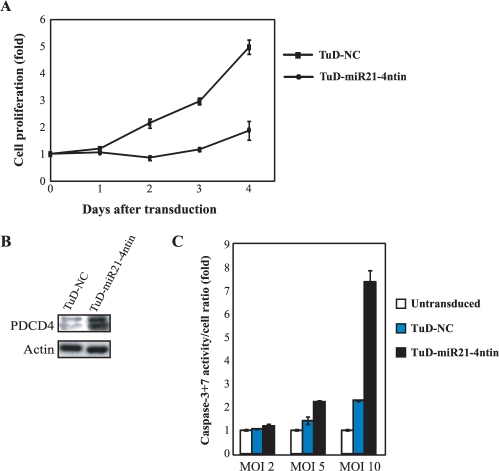
Figure 6. Biological effects induced by TuD RNA. (A) Inhibition of endogenous miR-21 function induces growth suppression and apoptosis. Cell growth assay was performed after PA-1 cells were transduced with lentivirus vectors expressing either TuD-miR21-4ntin or TuD-NC at an MOI of 10. Cell proliferation was monitored by ATPase based assays and normalized to those of untransduced PA-1 cells on Day 0 and are represented by the mean ± SEM (n = 3). (B) Effects of transduced TuD RNA expression lentivirus vectors upon the expression of endogenous PDCD4 protein, a target of miR-21. PA-1 cells were transduced with the TuD RNA expression lentivirus vectors with an MOI of 10 and total proteins were prepared 20 h after transduction. PDCD4 (top) as well as the β-actin loading control (bottom) were detected by western blotting. (C) Caspase-3 + 7 activation was assayed 48 h after transduction with indicated TuD RNA expression lentivirus with an MOI of 2, 5 and 10. Caspase-3 + 7 activity levels/cell was normalized to that of untransduced PA-1 cells and are represented by the mean ± SEM (n = 3).
Figure 6. Biological effects induced by TuD RNA. (A) Inhibition of endogenous miR-21 function induces growth suppression and apoptosis. Cell growth assay was performed after PA-1 cells were transduced with lentivirus vectors expressing either TuD-miR21-4ntin or TuD-NC at an MOI of 10. Cell proliferation was monitored by ATPase based assays and normalized to those of untransduced PA-1 cells on Day 0 and are represented by the mean ± SEM (n = 3). (B) Effects of transduced TuD RNA expression lentivirus vectors upon the expression of endogenous PDCD4 protein, a target of miR-21. PA-1 cells were transduced with the TuD RNA expression lentivirus vectors with an MOI of 10 and total proteins were prepared 20 h after transduction. PDCD4 (top) as well as the β-actin loading control (bottom) were detected by western blotting. (C) Caspase-3 + 7 activation was assayed 48 h after transduction with indicated TuD RNA expression lentivirus with an MOI of 2, 5 and 10. Caspase-3 + 7 activity levels/cell was normalized to that of untransduced PA-1 cells and are represented by the mean ± SEM (n = 3).CC BY-NC · PubMed Central
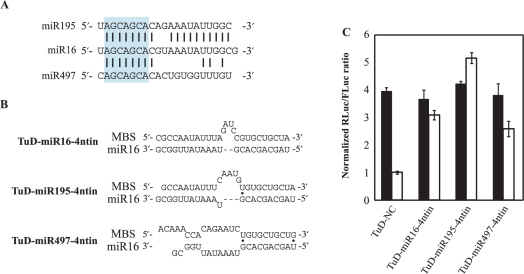
Figure 7. Inhibitory effects of TuD RNA on other family members of the target miRNA. (A) RNA sequences of miR-16, 195 and 497 and homology between them. Sequences shown in blue box are the heptameric seed sequence (2–8 from the 5′ end). Black bars indicated homologous nucleotides. (B) The imperfect pairing between miR-16 and MBSs of the corresponding TuD RNAs. Black dots indicate G-U pairs. (C) TuD RNA expression plasmid vectors were transiently transfected into HCT-116 cells together with the Renilla luciferase miR-16 reporter (open bars) or the untargeted control Renilla luciferase reporter (black bars) as well as the Firefly luciferase reporter as a transfection control. After performing a dual luciferase assay, the expression levels were normalized to the ratio of the activity of miR-16-RL to that of FL in TuD-NC vector-transfected cells and are represented by the mean ± SEM (n = 3).
Figure 7. Inhibitory effects of TuD RNA on other family members of the target miRNA. (A) RNA sequences of miR-16, 195 and 497 and homology between them. Sequences shown in blue box are the heptameric seed sequence (2–8 from the 5′ end). Black bars indicated homologous nucleotides. (B) The imperfect pairing between miR-16 and MBSs of the corresponding TuD RNAs. Black dots indicate G-U pairs. (C) TuD RNA expression plasmid vectors were transiently transfected into HCT-116 cells together with the Renilla luciferase miR-16 reporter (open bars) or the untargeted control Renilla luciferase reporter (black bars) as well as the Firefly luciferase reporter as a transfection control. After performing a dual luciferase assay, the expression levels were normalized to the ratio of the activity of miR-16-RL to that of FL in TuD-NC vector-transfected cells and are represented by the mean ± SEM (n = 3).CC BY-NC · PubMed Central

Verification

Claims the paper makes

The claims and statistics of this paper haven’t been checked yet.

Run the check — free, no account needed. It reads the open-access text and checks the sources it cites.

A few free checks a day · papers already verified open instantly · results are public

Claims other papers make about this one

Each is checked against this paper’s own text: does it say what the citing paper says it does?

Self-check

Percentages, sums and reported differences re-computed from the paper’s own numbers.

The self-check needs the paper’s full text.

Citations

Cites

Show all 29 references

Cited by

Sorted by citations

Items 301–308 of 308

Metadata

Authors
Haraguchi, T., Ozaki, Y., & Iba, H.
Affiliations
Institute of Medical Science, The University of Tokyo (JP)
Corresponding author
Iba, Hideo
Venue
Nucleic Acids Research
Published
2009-02-17
Volume
37
Issue
6
Pages
e43-e43
ISSN
  • 0305-1048 (ISSN-L)
  • 1362-4962
OpenAlex
W2128520557
Cited by
305
References
29
Citations by year
2026: 6 · 2025: 8 · 2024: 15 · 2023: 6 · 2022: 14 · 2021: 10 · 2020: 20 · 2019: 18 · 2018: 21 · 2017: 27 · 2016: 29 · 2015: 24 · 2014: 33 · 2013: 23 · 2012: 23
FWCI
5.59
Type
journal article
Language
en
Open access
Locations
  • Nucleic Acids Research (publishedVersion, cc-by-nc)
  • PubMed Central (publishedVersion, cc-by-nc)
  • PubMed (publishedVersion)
Topics
  • Life Sciences › Biochemistry, Genetics and Molecular Biology › Cancer Research › MicroRNA in disease regulation
  • Life Sciences › Biochemistry, Genetics and Molecular Biology › Molecular Biology › RNA Interference and Gene Delivery
  • Life Sciences › Biochemistry, Genetics and Molecular Biology › Cancer Research › Cancer-related molecular mechanisms research
Keywords
microRNA inhibition, RNA decoys, lentiviral vectors, RNA polymerase III transcription, mammalian cells
MeSH terms
Binding Sites, Cell Line, Genetic Vectors, Humans, Nucleic Acid Conformation, Transduction, Genetic, Lentivirus, Genes, Reporter, RNA, Untranslated, MicroRNAs

About these checks

Registry, retraction, Cites and statistics results are computed, not judged, with one exception: a printed reference that no index lists is read once by a model before it counts as a citation error. Claims are extracted by a model and kept only when their quote appears verbatim in the text; each cited source is then checked, with a model’s help, for whether it says what the claim relies on. Those verdicts can be wrong — read the claim’s quote and the cited source before relying on one.

Statistics and arithmetic are recomputed, not judged.

Confidence bands are shown only for fields calibrated on our annotated test set. None is calibrated yet, so no band is shown.

What counts as a claim ›How we measure confidence ›How we check this ›

Are you an author, or do you see a problem with this page? Request a review