

The DOI matches its Crossref record; 53 of the 53 references it cites were found in a registry or an index.
Integrative genomic analysis of human ribosomal DNA
Open accessAbstract
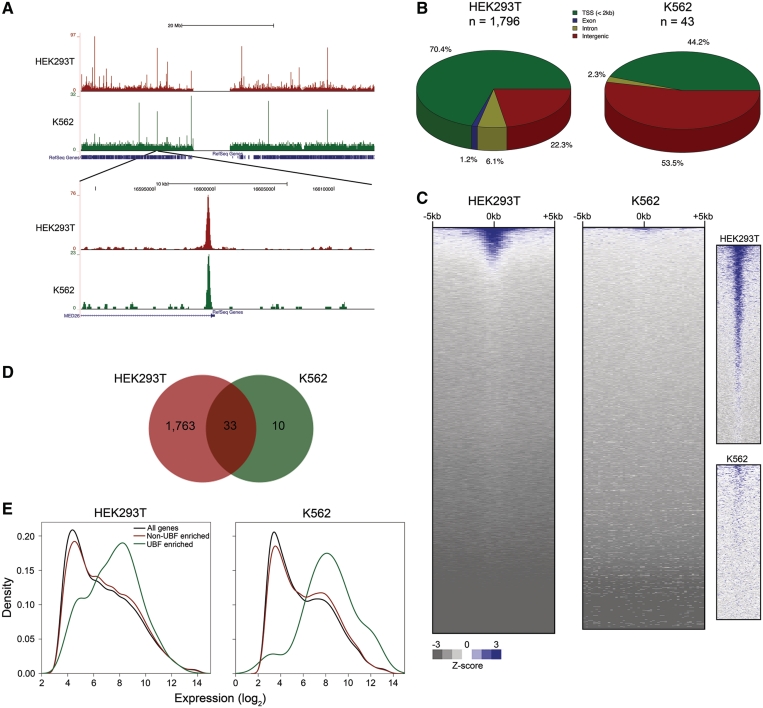
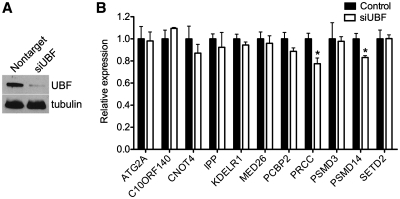
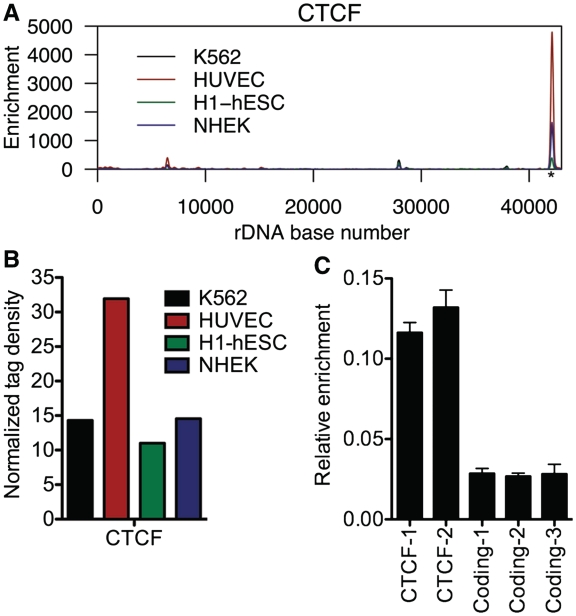
The transcription of ribosomal RNA (rRNA) is critical to life. Despite its importance, ribosomal DNA (rDNA) is not included in current genome assemblies and, consequently, genomic analyses to date have excluded rDNA. Here, we show that short sequence reads can be aligned to a genome assembly containing a single rDNA repeat. Integrated analysis of ChIP-seq, DNase-seq, MNase-seq and RNA-seq data reveals several novel findings. First, the coding region of active rDNA is contained within nucleosome-depleted open chromatin that is highly transcriptionally active. Second, histone modifications are located not only at the rDNA promoter but also at novel sites within the intergenic spacer. Third, the distributions of active modifications are more similar within and between different cell types than repressive modifications. Fourth, UBF, a positive regulator of rRNA transcription, binds to sites throughout the genome. Lastly, the insulator binding protein CTCF associates with the spacer promoter of rDNA, suggesting that transcriptional insulation plays a role in regulating the transcription of rRNA. Taken together, these analyses confirm and expand the results of previous ChIP studies of rDNA and provide novel avenues for exploration of chromatin-mediated regulation of rDNA.
Overview
The claims and statistics of this paper haven’t been checked yet.
Run the check — free, no account needed. It reads the open-access text and checks the sources it cites.
Integrity signals
Registry
Cites
Statistics
Figures
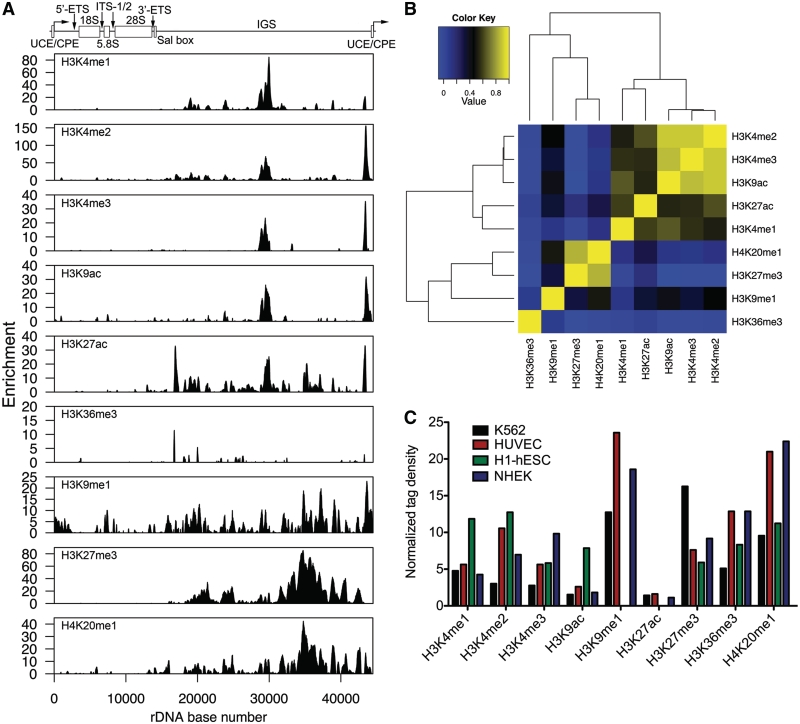
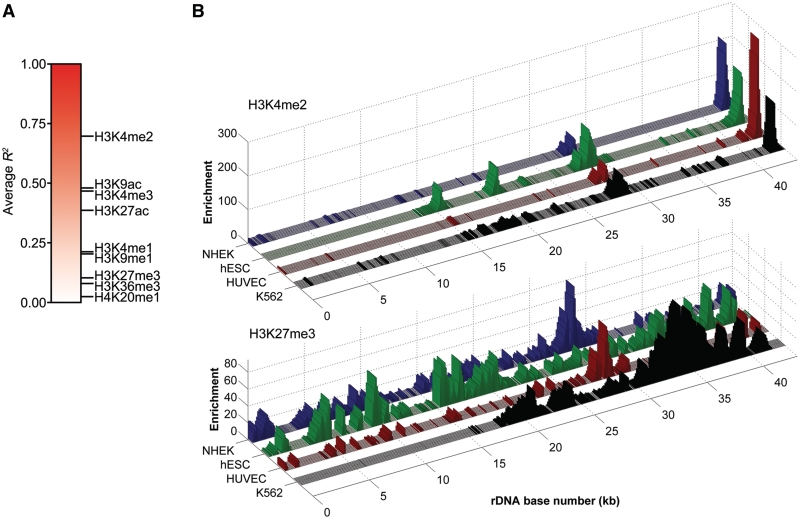
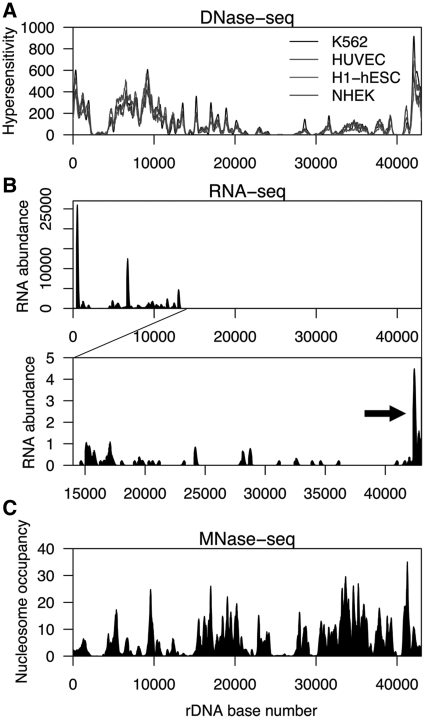
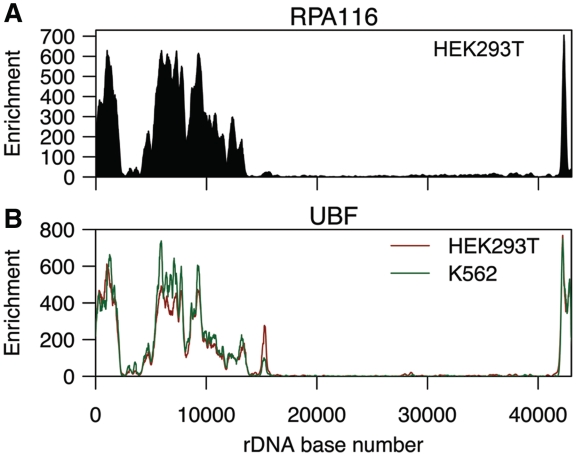
Verification
Claims the paper makes
The claims and statistics of this paper haven’t been checked yet.
Run the check — free, no account needed. It reads the open-access text and checks the sources it cites.
Claims other papers make about this one
Each is checked against this paper’s own text: does it say what the citing paper says it does?
The source backs part of the claim, not all of it — or backs it for a different population, condition or comparison.
In the citing paper
“Under basal conditions, a substantial proportion of the multiple rDNA repeats located on acrocentric chromosomes remain transcriptionally inactive, being associated with condensed chromatin and higher levels of DNA methylation [176].”
From Ribosome Biogenesis as a Putative Bottleneck to Skeletal Muscle Hypertrophy: Mechanisms, Human Evidence, and Practical Modulators (2026) · cites this paper as [176]
Experimental — accuracy not yet measured
Self-check
Percentages, sums and reported differences re-computed from the paper’s own numbers.
The self-check needs the paper’s full text.
Citations
Cites
Initial sequencing and analysis of the human genome
International Human Genome Sequencing Consortium, Whitehead Institute for Biomedical Research, C. F. G. R., Lander, E. S., Linton, L. M., Birren, B., Nusbaum, C., Zody, M. C., Baldwin, J., Devon, K., Dewar, K., et al. (2001) · Nature · doi:10.1038/35057062 · Cited by 24,216
Ultrafast and memory-efficient alignment of short DNA sequences to the human genome.
Langmead, B., Trapnell, C., Pop, M., & Salzberg, S. L. (2009) · Genome Biology · doi:10.1186/gb-2009-10-3-r25 · Cited by 21,849
The sequence of the human genome
Venter, J. C., Adams, M. D., Myers, E. W., Li, P. W., Mural, R. J., Sutton, G. G., Smith, H. O., Yandell, M., Evans, C. A., Holt, R. A., et al. (2001) · Science · doi:10.1126/science.1058040 · Cited by 13,909
Summaries of Affymetrix GeneChip probe level data
Irizarry, R. A. (2003) · Nucleic Acids Research · doi:10.1093/nar/gng015 · Cited by 4,837
Heintzman, N. D., Stuart, R. K., Hon, G., Fu, Y., Ching, C. W., Hawkins, R. D., Barrera, L. O., Van Calcar, S., Qu, C., Ching, K. A., et al. (2007) · Nature Genetics · doi:10.1038/ng1966 · Cited by 3,398 · cited 2×
“This scenario is reminiscent of that in the nucleoplasm, where marks associated with promoters tend to be invariant between cell types while marks associated with enhancers display cell-type specificity (34).”
BackgroundChen, X., Han, X., Yuan, P., Fang, F., Huss, M., Vega, V. B., Wong, E., Orlov, Y. L., Zhang, W., Jiang, J., et al. (2008) · Cell · doi:10.1016/j.cell.2008.04.043 · Cited by 2,547
Widespread transcription at neuronal activity-regulated enhancers
Kim, T.-K., Hemberg, M., Gray, J. M., Costa, A. M., Bear, D. M., Wu, J., Harmin, D. A., Laptewicz, M., Barbara-Haley, K., Kuersten, S., et al. (2010) · Nature · doi:10.1038/nature09033 · Cited by 2,450
ChIP–seq: advantages and challenges of a maturing technology
Park, P. J. (2009) · Nature Reviews Genetics · doi:10.1038/nrg2641 · Cited by 2,217
CTCF: Master Weaver of the Genome
Phillips‐Cremins, J. E., & Corces, V. G. (2009) · Cell · doi:10.1016/j.cell.2009.06.001 · Cited by 1,585
Dynamic Regulation of Nucleosome Positioning in the Human Genome
Schones, D. E., Cui, K., Cuddapah, S., Roh, T., Barski, A., Wang, Z., Wei, G., & Zhao, K. (2008) · Cell · doi:10.1016/j.cell.2008.02.022 · Cited by 1,473
Research works printed but not linked: 1
- Sylvester, 2003, The Nucleolus, 58
Cited by
Sorted by citations
RNA helicase DDX21 coordinates transcription and ribosomal RNA processing
Calo, E., Flynn, R. A., Martin, L., Spitale, R. C., Chang, H. Y., & Wysocka, J. (2014) · Nature · doi:10.1038/nature13923 · Cited by 325
Variant ribosomal RNA alleles are conserved and exhibit tissue-specific expression
Parks, M. M., Kurylo, C. M., Dass, R. A., Bojmar, L., Lyden, D., Vincent, C. T., & Blanchard, S. C. (2018) · Science Advances · doi:10.1126/sciadv.aao0665 · Cited by 260
Cai, X., Gao, L., Teng, L., Ge, J., Oo, Z. M., Kumar, A. R., Gilliland, D. G., Mason, P. J., Tan, K., & Speck, N. A. (2015) · Cell stem cell · doi:10.1016/j.stem.2015.06.002 · Cited by 237
Nucleolar RNA polymerase II drives ribosome biogenesis
Abraham, K. J., Khosraviani, N., Chan, J. N. Y., Gorthi, A., Samman, A., Zhao, D. Y., Wang, M., Bokros, M., Vidya, E., Ostrowski, L., et al. (2020) · Nature · doi:10.1038/s41586-020-2497-0 · Cited by 209
Concerted copy number variation balances ribosomal DNA dosage in human and mouse genomes
Gibbons, J. G., Branco, A. T., Godinho, S. A., Yu, S., & Lemos, B. (2015) · Proceedings of the National Academy of Sciences · doi:10.1073/pnas.1416878112 · Cited by 201
Nadel, J., Athanasiadou, R., Lemetre, C., Wijetunga, N. A., Broin, P. Ó., Sato, H., Zhang, Z., Jeddeloh, J. A., Montagna, C., Golden, A., et al. (2015) · Epigenetics & Chromatin · doi:10.1186/s13072-015-0040-6 · Cited by 184
Gibbons, J. G., Branco, A. T., Yu, S., & Lemos, B. (2014) · Nature Communications · doi:10.1038/ncomms5850 · Cited by 165
Paulsen, M. T., Veloso, A., Prasad, J., Bedi, K., Ljungman, E. A., Tsan, Y.-C., Chang, C., Tarrier, B., Washburn, J. G., Lyons, R., et al. (2013) · Proceedings of the National Academy of Sciences · doi:10.1073/pnas.1219192110 · Cited by 162
Interaction of nucleolin with ribosomal RNA genes and its role in RNA polymerase I transcription
Cong, R., Das, S., Ugrinova, I., Kumar, S., Mongelard, F., Wong, J., & Bouvet, P. (2012) · Nucleic Acids Research · doi:10.1093/nar/gks720 · Cited by 155
Ribosomal DNA copy number loss and sequence variation in cancer
Xu, B., Li, H., Perry, J. M., Singh, V. P., Unruh, J. R., Yu, Z., Zakari, M., McDowell, W., Li, L., & Gerton, J. L. (2017) · PLoS Genetics · doi:10.1371/journal.pgen.1006771 · Cited by 158
Small Non-Coding RNAs Derived from Eukaryotic Ribosomal RNA
Lambert, M., Benmoussa, A., & Provost, P. (2019) · Non-Coding RNA · doi:10.3390/ncrna5010016 · Cited by 140
Epigenetic control of RNA polymerase I transcription in mammalian cells
Grummt, I., & Längst, G. (2013) · Biochimica et Biophysica Acta (BBA) - Gene Regulatory Mechanisms · doi:10.1016/j.bbagrm.2012.10.004 · Cited by 132
Wang, M., & Lemos, B. (2017) · PLoS Genetics · doi:10.1371/journal.pgen.1006994 · Cited by 129
Correll, C. C., Bártek, J., & Dundr, M. (2019) · Cells · doi:10.3390/cells8080869 · Cited by 126
Structural insights into nuclear transcription by eukaryotic DNA-dependent RNA polymerases
Girbig, M., Misiaszek, A. D., & Müller, C. W. (2022) · Nature Reviews Molecular Cell Biology · doi:10.1038/s41580-022-00476-9 · Cited by 125
Ribosomal DNA and the nucleolus in the context of genome organization
Potapova, T., & Gerton, J. L. (2019) · Chromosome Research · doi:10.1007/s10577-018-9600-5 · Cited by 103
Keeping ribosomal DNA intact: a repeating challenge
Warmerdam, D. O., & Wolthuis, R. M. F. (2018) · Chromosome Research · doi:10.1007/s10577-018-9594-z · Cited by 97
Ribosomal DNA and the Nucleolus as Keystones of Nuclear Architecture, Organization, and Function
Cerqueira, A. V., & Lemos, B. (2019) · Trends in Genetics · doi:10.1016/j.tig.2019.07.011 · Cited by 94
Kim, J.-H., Dilthey, A. T., Nagaraja, R., Lee, H.-S., Koren, S., Dudekula, D., Wood III, W. H., Piao, Y., Ogurtsov, A. Y., Utani, K., et al. (2018) · Nucleic Acids Research · doi:10.1093/nar/gky442 · Cited by 86
ISWI and CHD Chromatin Remodelers Bind Promoters but Act in Gene Bodies
Zentner, G. E., Tsukiyama, T., & Henikoff, S. (2013) · PLoS Genetics · doi:10.1371/journal.pgen.1003317 · Cited by 88
ISWI and CHD chromatin remodelers bind to promoters but act in gene bodies
Zentner, G. E., Tsukiyama, T., & Henikoff, S. (2013) · Epigenetics & Chromatin · doi:10.1186/1756-8935-6-s1-o29 · Cited by 86
The Nucleolus: In Genome Maintenance and Repair
Tsekrekou, M., Stratigi, K., & Chatzinikolaou, G. (2017) · International Journal of Molecular Sciences · doi:10.3390/ijms18071411 · Cited by 86
Profiling and Identification of Small rDNA-Derived RNAs and Their Potential Biological Functions
Wei, H., Zhou, B. Z., Zhang, F., Tu, Y., Hu, Y., Zhang, B., & Zhai, Q. (2013) · PLoS ONE · doi:10.1371/journal.pone.0056842 · Cited by 87
Schöfer, C., & Weipoltshammer, K. (2018) · Histochemistry and Cell Biology · doi:10.1007/s00418-018-1696-3 · Cited by 83
The conservation landscape of the human ribosomal RNA gene repeats
Agrawal, S., & Ganley, A. R. D. (2018) · PLoS ONE · doi:10.1371/journal.pone.0207531 · Cited by 81
Corsini, N. S., Peer, A. M., Möseneder, P., Roiuk, M., Burkard, T. R., Theussl, H., Moll, I., & Knoblich, J. A. (2018) · Cell stem cell · doi:10.1016/j.stem.2018.03.002 · Cited by 79
The Long and Short of It: The Emerging Roles of Non-Coding RNA in Small Extracellular Vesicles
Abramowicz, A., & Story, M. D. (2020) · Cancers · doi:10.3390/cancers12061445 · Cited by 76
Mayor, R., Izquierdo‐Bouldstridge, A., Millán-Ariño, L., Bustillos, A., Sampaio, C., Luque, N., & Jordan, A. (2015) · Journal of Biological Chemistry · doi:10.1074/jbc.m114.617324 · Cited by 75
The impact of ribosome biogenesis in cancer: from proliferation to metastasis
Hwang, S.-P., & Denicourt, C. (2024) · NAR Cancer · doi:10.1093/narcan/zcae017 · Cited by 78
Tchurikov, N. A., Fedoseeva, D. M., Сосин, Д. В., Snezhkina, A., Melnikova, N. V., Kudryavtseva, A. V., Kravatsky, Y. V., & Kretova, O. V. (2014) · Journal of Molecular Cell Biology · doi:10.1093/jmcb/mju038 · Cited by 73
Chromatin states at ribosomal DNA loci
Hamperl, S., Wittner, M., Babl, V., Perez-Fernandez, J., Tschochner, H., & Griesenbeck, J. (2013) · Biochimica et Biophysica Acta (BBA) - Gene Regulatory Mechanisms · doi:10.1016/j.bbagrm.2012.12.007 · Cited by 69
Sanij, E., Diesch, J., Lesmana, A., Poortinga, G., Hein, N., Lidgerwood, G. E., Cameron, D. P., Ellul, J., Goodall, G. J., Wong, L. H., et al. (2014) · Genome Research · doi:10.1101/gr.176115.114 · Cited by 65
Super-resolution in situ analysis of active ribosomal DNA chromatin organization in the nucleolus
Maiser, A., Dillinger, S., Längst, G., Schermelleh, L., Leonhardt, H., & Németh, A. (2020) · Scientific Reports · doi:10.1038/s41598-020-64589-x · Cited by 65
Genetic and epigenetic regulation of skeletal muscle ribosome biogenesis with exercise
Figueiredo, V. C., Wen, Y., Alkner, B., Fernandez‐Gonzalo, R., Norrbom, J., Vechetti, I. J., Valentino, T., Mobley, C. B., Zentner, G. E., Peterson, C. A., et al. (2021) · The Journal of Physiology · doi:10.1113/jp281244 · Cited by 64
Regulation of Ribosomal Gene Expression in Cancer
Nguyen, L. X. T., Raval, A., Garcia, J. S., & Mitchell, B. S. (2014) · Journal of Cellular Physiology · doi:10.1002/jcp.24854 · Cited by 62
Chromatin dynamics of plant telomeres and ribosomal genes
Dvořáčková, M., Fojtová, M., & Fajkus, J. (2015) · The Plant Journal · doi:10.1111/tpj.12822 · Cited by 59
The chromatin landscape of the ribosomal RNA genes in mouse and human
Moss, T., Mars, J.-C., Tremblay, M. G., & Sabourin‐Félix, M. (2019) · Chromosome Research · doi:10.1007/s10577-018-09603-9 · Cited by 59
Huang, K., Jia, J., Wu, C. W., Yao, M., Li, M., Jin, J., Jiang, C., Cai, Y., Pei, D., Pan, G., et al. (2013) · Journal of Biological Chemistry · doi:10.1074/jbc.m113.486175 · Cited by 59
CTCF and BORIS in genome regulation and cancer
Marshall, A. D., Bailey, C. G., & Rasko, J. E. J. (2013) · Current Opinion in Genetics & Development · doi:10.1016/j.gde.2013.10.011 · Cited by 57
Long Noncoding RNAs and Stress Response in the Nucleolus
Пирогов, С. А., Gvozdev, V. A., & Klenov, M. S. (2019) · Cells · doi:10.3390/cells8070668 · Cited by 56
Condensates induced by transcription inhibition localize active chromatin to nucleoli
Yasuhara, T., Xing, Y., Bauer, N. C., Lee, L., Dong, R., Yadav, T., Soberman, R. J., Rivera, M. N., & Zou, L. (2022) · Molecular Cell · doi:10.1016/j.molcel.2022.05.010 · Cited by 52
Homology‐dependent repair is involved in 45 S rDNA loss in plant CAF ‐1 mutants
Muchová, V., Amiard, S., Mozgová, I., Dvořáčková, M., Gallego, M. E., White, C. I., & Fajkus, J. (2014) · The Plant Journal · doi:10.1111/tpj.12718 · Cited by 50
Superresolution microscopy reveals linkages between ribosomal DNA on heterologous chromosomes
Potapova, T., Unruh, J. R., Yu, Z., Rancati, G. I., Li, H., Stampfer, M. R., & Gerton, J. L. (2019) · The Journal of Cell Biology · doi:10.1083/jcb.201810166 · Cited by 53
Proteomic profiling of the human T-cell nucleolus
Jarboui, M. A., Wynne, K. J., Elia, G., Hall, W. W., & Gautier, V. (2011) · Molecular Immunology · doi:10.1016/j.molimm.2011.09.005 · Cited by 52
Woolnough, J. L., Atwood, B. L., Liu, Z., Zhao, R., & Giles, K. E. (2016) · PLoS ONE · doi:10.1371/journal.pone.0157276 · Cited by 52
Fourth Report on Chicken Genes and Chromosomes 2022
Smith, J., Alfieri, J. M., Anthony, N., Arensburger, P., Athrey, G., Balacco, J., Balic, A., Bardou, P., Barela, P., Bigot, Y., et al. (2022) · Cytogenetic and Genome Research · doi:10.1159/000529376 · Cited by 58
Mot1 Redistributes TBP from TATA-Containing to TATA-Less Promoters
Zentner, G. E., & Henikoff, S. (2013) · Molecular and Cellular Biology · doi:10.1128/mcb.01218-13 · Cited by 49
Genomic Characterization of the Mouse Ribosomal DNA Locus
Zentner, G. E., Balow, S. A., & Scacheri, P. C. (2013) · G3 Genes Genomes Genetics · doi:10.1534/g3.113.009290 · Cited by 47
The long-range interaction map of ribosomal DNA arrays
Yu, S., & Lemos, B. (2018) · PLoS Genetics · doi:10.1371/journal.pgen.1007258 · Cited by 53
Yu, S., & Lemos, B. (2016) · Genome Biology and Evolution · doi:10.1093/gbe/evw257 · Cited by 52
Diesch, J., Bywater, M. J., Sanij, E., Cameron, D. P., Schierding, W. S., Brajanovski, N., Son, J., Sornkom, J., Hein, N., Evers, M., et al. (2019) · Communications Biology · doi:10.1038/s42003-019-0284-y · Cited by 51
BEND3 represses rDNA transcription by stabilizing a NoRC component via USP21 deubiquitinase
Khan, A. A., Giri, S., Wang, Y., Chakraborty, A., Ghosh, A. K., Anantharaman, A., Aggarwal, V., Sathyan, K. M., Ha, T., Prasanth, K. V., et al. (2015) · Proceedings of the National Academy of Sciences · doi:10.1073/pnas.1424705112 · Cited by 48
Mars, J.-C., Sabourin‐Félix, M., Tremblay, M. G., & Moss, T. (2017) · G3 Genes Genomes Genetics · doi:10.1534/g3.117.300225 · Cited by 46
Genome (in)stability at tandem repeats
Balzano, E., Pelliccia, F., & Giunta, S. (2020) · Seminars in Cell and Developmental Biology · doi:10.1016/j.semcdb.2020.10.003 · Cited by 50
The relationship between transcription initiation RNAs and CCCTC-binding factor (CTCF) localization
Taft, R. J., Hawkins, P. G., Mattick, J. S., & Morris, K. V. (2011) · Epigenetics & Chromatin · doi:10.1186/1756-8935-4-13 · Cited by 45
Das, S., Cong, R., Shandilya, J., Senapati, P., Moindrot, B., Monier, K., Delage, H., Mongélard, F., Kumar, S., Kundu, T. K., et al. (2013) · FEBS Letters · doi:10.1016/j.febslet.2013.01.035 · Cited by 43
Yoshikawa, M., & Fujii, Y. R. (2016) · BioMed Research International · doi:10.1155/2016/7562085 · Cited by 40
Emerging roles of novel small non-coding regulatory RNAs in immunity and cancer
Rosace, D., López, J., & Blanco, S. (2020) · RNA Biology · doi:10.1080/15476286.2020.1737442 · Cited by 42
Almuzzaini, B., Sarshad, A. A., Rahmanto, A. S., Hansson, M. L., von Euler, A., Sangfelt, O., Visa, N., Farrants, A. Ö., & Percipalle, P. (2016) · The FASEB Journal · doi:10.1096/fj.201600280r · Cited by 40
Where no RNA polymerase has gone before
Jacob, M. D., Audas, T. E., Mullineux, S.-T., & Lee, S. B. (2012) · Nucleus · doi:10.4161/nucl.20585 · Cited by 38
A Runx2-HDAC1 co-repressor complex regulates rRNA gene expression by modulating UBF acetylation
Ali, S. A., Dobson, J. R., Lian, J. B., Stein, J. L., van Wijnen, A. J., Zaidi, S. K., & Stein, G. S. (2012) · Journal of Cell Science · doi:10.1242/jcs.100909 · Cited by 41
The nucleolus from a liquid droplet perspective
Yoneda, M., Nakagawa, T., Hattori, N., & Ito, T. (2021) · The Journal of Biochemistry · doi:10.1093/jb/mvab090 · Cited by 34
Nucleolar DNA: the host and the guests
Smirnov, E., Cmarko, D., Mazel, T., Hornáček, M., & Raška, I. (2016) · Histochemistry and Cell Biology · doi:10.1007/s00418-016-1407-x · Cited by 37
Vertebrate Spt2 is a novel nucleolar histone chaperone that assists in ribosomal DNA transcription
Osakabe, A., Tachiwana, H., Takaku, M., Hori, T., Obuse, C., Kimurâ, H., Fukagawa, T., & Kurumizaka, H. (2013) · Journal of Cell Science · doi:10.1242/jcs.112623 · Cited by 29
Analysis of histone modifications at human ribosomal DNA in liver cancer cell
Yu, F., Shen, X., Li, F., & Yu, Z. (2015) · Scientific Reports · doi:10.1038/srep18100 · Cited by 32
Control of ribosomal RNA synthesis by hematopoietic transcription factors
Charles Antony, A., George, S. S., Blum, J., Somers, P., Thorsheim, C. L., Wu-Corts, D. J., Ai, Y., Gao, L., Lv, K., Tremblay, M. G., et al. (2022) · Molecular Cell · doi:10.1016/j.molcel.2022.08.027 · Cited by 32
Construction and validation of customized genomes for human and mouse ribosomal DNA mapping
George, S. S., Pimkin, M., & Paralkar, V. R. (2023) · Journal of Biological Chemistry · doi:10.1016/j.jbc.2023.104766 · Cited by 35
Aberrant DNA Methylation of rDNA and PRIMA1 in Borderline Personality Disorder
Teschler, S., Gotthardt, J., Dammann, G., & Dammann, R. (2016) · International Journal of Molecular Sciences · doi:10.3390/ijms17010067 · Cited by 31
Sarshad, A. A., Corcoran, M., Almuzzaini, B., Borgonovo-Brandter, L., von Euler, A., Lamont, D., Visa, N., & Percipalle, P. (2014) · PLoS Genetics · doi:10.1371/journal.pgen.1004390 · Cited by 31
Smirnov, E., Chmúrčiaková, N., Liška, F., Bažantová, P., & Cmarko, D. (2021) · Cells · doi:10.3390/cells10020196 · Cited by 35
The hunt for origins of DNA replication in multicellular eukaryotes
Urban, J. M., Foulk, M. S., Casella, C., & Gerbi, S. A. (2015) · F1000Prime Reports · doi:10.12703/p7-30 · Cited by 28
Xie, Q., Li, C., Song, X., Wu, L., Jiang, Q., Qiu, Z., Cao, H., Yu, K., Wan, C., Li, J., et al. (2016) · Nucleic Acids Research · doi:10.1093/nar/gkw1208 · Cited by 27
Ray, S., Johnston, R., Campbell, D. C., Nugent, S., McDade, S. S., Waugh, D. J. J., & Panov, K. I. (2013) · Gene · doi:10.1016/j.gene.2013.04.018 · Cited by 26
Human Argonaute 2 Is Tethered to Ribosomal RNA through MicroRNA Interactions
Atwood, B. L., Woolnough, J. L., Lefevre, G. M., Ribeiro, M. S. J., Felsenfeld, G., & Giles, K. E. (2016) · Journal of Biological Chemistry · doi:10.1074/jbc.m116.725051 · Cited by 26
Argonaute 2 Binds Directly to tRNA Genes and Promotes Gene Repression in cis
Woolnough, J. L., Atwood, B. L., & Giles, K. E. (2015) · Molecular and Cellular Biology · doi:10.1128/mcb.00076-15 · Cited by 25
SHPRH regulates rRNA transcription by recognizing the histone code in an mTOR-dependent manner
Lee, D., An, J., Park, Y.-U., Liaw, H., Woodgate, R., Park, J. H., & Myung, K. (2017) · Proceedings of the National Academy of Sciences · doi:10.1073/pnas.1701978114 · Cited by 27
Common Features of the Pericentromere and Nucleolus
Lawrimore, C. J., & Bloom, K. (2019) · Genes · doi:10.3390/genes10121029 · Cited by 25
Chromatin-Specific Regulation of Mammalian rDNA Transcription by Clustered TTF-I Binding Sites
Diermeier, S. D., Németh, A., Rehli, M., Grummt, I., & Längst, G. (2013) · PLoS Genetics · doi:10.1371/journal.pgen.1003786 · Cited by 24
Son, J., Hannan, K. M., Poortinga, G., Hein, N., Cameron, D. P., Ganley, A. R. D., Sheppard, K. E., Pearson, R. B., Hannan, R. D., & Sanij, E. (2020) · Frontiers in Cell and Developmental Biology · doi:10.3389/fcell.2020.00568 · Cited by 24
Nucleolar detention of NONO shields DNA double-strand breaks from aberrant transcripts
Trifault, B., Mamontova, V., Cossa, G., Ganskih, S., Wei, Y., Hofstetter, J., Bhandare, P., Baluapuri, A., Nieto, B., Solvie, D., et al. (2024) · Nucleic Acids Research · doi:10.1093/nar/gkae022 · Cited by 25
Shiue, C.-N., Mahani, A., & Wright, A. P. H. (2014) · Nucleic Acids Research · doi:10.1093/nar/gku183 · Cited by 24
Hoeppner, M. P., Denisenko, E., Gardner, P. P., Schmeier, S., & Poole, A. M. (2018) · Molecular Biology and Evolution · doi:10.1093/molbev/msy046 · Cited by 23
Hot spots of DNA double-strand breaks in human rDNA units are produced in vivo
Tchurikov, N. A., Yudkin, D. V., Gorbacheva, M. A., Kulemzina, A. I., Grischenko, I. V., Fedoseeva, D. M., Сосин, Д. В., Kravatsky, Y. V., & Kretova, O. V. (2016) · Scientific Reports · doi:10.1038/srep25866 · Cited by 26
Nucleolar Structure and Function in Trypanosomatid Protozoa
Martínez‐Calvillo, S., Florencio-Martínez, L. E., & Nepomuceno‐Mejía, T. (2019) · Cells · doi:10.3390/cells8050421 · Cited by 23
Ribosomal RNA Genes in the Protozoan Parasite Leishmania major Possess a Nucleosomal Structure
Vizuet‐de‐Rueda, J. C., Florencio-Martínez, L. E., Padilla-Mejía, N. E., Manning-Cela, R. G., Hernández‐Rivas, R., & Martínez‐Calvillo, S. (2016) · Protist · doi:10.1016/j.protis.2016.02.001 · Cited by 22
Siebenwirth, C., Greubel, C., Drexler, G. A., Reindl, J., Walsh, D. W. M., Schwarz, B., Sammer, M., Baur, I., Pospiech, H., Schmid, T. E., et al. (2019) · Journal of Cell Science · doi:10.1242/jcs.232181 · Cited by 21
Chromatin loops and causality loops: the influence of RNA upon spatial nuclear architecture
Sawyer, I. A., & Dundr, M. (2017) · Chromosoma · doi:10.1007/s00412-017-0632-y · Cited by 20
CRISPR screening uncovers nucleolar RPL22 as a heterochromatin destabilizer and senescence driver
Li, H., Wang, M., Jiang, X., Jing, Y., Wu, Z., He, Y., Yan, K., Sun, S., Ma, S., Ji, Z., et al. (2024) · Nucleic Acids Research · doi:10.1093/nar/gkae740 · Cited by 22
A ribosomal DNA-hosted microRNA regulates zebrafish embryonic angiogenesis
Shi, Y., Duan, X., Xu, G., Wang, X., Wei, G., Dong, S., Xie, G., & Liu, D. (2019) · Angiogenesis · doi:10.1007/s10456-019-09663-3 · Cited by 18
VELCRO-IP RNA-seq reveals ribosome expansion segment function in translation genome-wide
Leppek, K., Byeon, G. W., Fujii, K., & Barna, M. (2021) · Cell Reports · doi:10.1016/j.celrep.2020.108629 · Cited by 18
The Ribosomal Gene Loci—The Power behind the Throne
Panov, K. I., Hannan, K. M., Hannan, R. D., & Hein, N. (2021) · Genes · doi:10.3390/genes12050763 · Cited by 19
Cell cycle and growth stimuli regulate different steps of RNA polymerase I transcription
Hung, S. S. C., Lesmana, A., Peck, A., Lee, R., Tchoubrieva, E., Hannan, K. M., Lin, J. I., Sheppard, K. E., Jastrzebski, K., Quinn, L. M., et al. (2016) · Gene · doi:10.1016/j.gene.2016.12.015 · Cited by 17
Establishment and Maintenance of Open Ribosomal RNA Gene Chromatin States in Eukaryotes
Schächner, C., Merkl, P., Pilsl, M., Schwank, K., Hergert, K., Kruse, S., Milkereit, P., Tschochner, H., & Griesenbeck, J. (2022) · Methods in molecular biology · doi:10.1007/978-1-0716-2501-9_2 · Cited by 13
Evidence of RNA polymerase III recruitment and transcription at protein-coding gene promoters
Rajendra, K. C., Cheng, R., Zhou, S., Lizarazo, S., Smith, D. J., & Bortle, K. V. (2024) · Molecular Cell · doi:10.1016/j.molcel.2024.09.019 · Cited by 15
Kamat, N., Khidhir, M. A., Hussain, S., Alashari, M., & Rannug, U. (2014) · Cancer Cell International · doi:10.1186/s12935-014-0118-4 · Cited by 15
Spt6 Is Essential for rRNA Synthesis by RNA Polymerase I
Engel, K. L., French, S. L., Viktorovskaya, O., Beyer, A. L., & Schneider, D. A. (2015) · Molecular and Cellular Biology · doi:10.1128/mcb.01499-14 · Cited by 15
Zhang, Y., Najmi, S. M., & Schneider, D. A. (2016) · Biochimica et Biophysica Acta (BBA) - Gene Regulatory Mechanisms · doi:10.1016/j.bbagrm.2016.10.010 · Cited by 14
Inhibitor of Growth 4 (ING4) is a positive regulator of rRNA synthesis
Trinh, D., Shirakawa, R., Kimura, T., Sakata, N., Goto, K., & Horiuchi, H. (2019) · Scientific Reports · doi:10.1038/s41598-019-53767-1 · Cited by 14
Pliss, A., Fritz, A. J., Stojkovic, B., Ding, H., Mukherjee, L., Bhattacharya, S., Xu, J., & Berezney, R. (2014) · Journal of Cellular Physiology · doi:10.1002/jcp.24726 · Cited by 14
Yang, Z., Yan, X., Zhang, J., Liang, L., Gao, C.-C., Zhang, P., Liu, Y., Sun, J., Ruan, B., Duan, J., et al. (2023) · Journal of Clinical Investigation · doi:10.1172/jci159860 · Cited by 12
Metadata
- Authors
- Zentner, G. E., Saiakhova, A., Manaenkov, P., Adams, M. D., & Scacheri, P. C.
- Affiliations
- Case Comprehensive Cancer Center (US)
- Corresponding author
- Scacheri, Peter C.
- Venue
- Nucleic Acids Research
- Publisher
- Oxford University Press (OUP)
- Published
- 2011-02-25
- Volume
- 39
- Issue
- 12
- Pages
- 4949-4960
- ISSN
- 0305-1048 (ISSN-L)
- 1362-4962
- PMC
- PMC3130253
- OpenAlex
- W2114591008
- Cited by
- 165
- References
- 53
- Citations by year
- 2026: 6 · 2025: 3 · 2024: 15 · 2023: 9 · 2022: 11 · 2021: 11 · 2020: 10 · 2019: 18 · 2018: 11 · 2017: 10 · 2016: 13 · 2015: 12 · 2014: 14 · 2013: 16 · 2012: 4
- FWCI
- 4.67
- Type
- journal article
- Language
- en
- Open access
- gold
- doi.org
- Licence
- Locations
- Nucleic Acids Research (publishedVersion, cc-by-nc)
- PubMed Central (publishedVersion, cc-by-nc)
- PubMed (publishedVersion)
- Funders
- National Human Genome Research Institute (R01HG004722)
- National Institute of General Medical Sciences (T32GM008613)
- Eunice Kennedy Shriver National Institute of Child Health and Human Development (R01HD056369)
- Topics
- Life Sciences › Biochemistry, Genetics and Molecular Biology › Molecular Biology › Genomics and Chromatin Dynamics
- Life Sciences › Biochemistry, Genetics and Molecular Biology › Molecular Biology › Nuclear Structure and Function
- Life Sciences › Biochemistry, Genetics and Molecular Biology › Genetics › Chromosomal and Genetic Variations
- Keywords
- ribosomal DNA, rRNA transcription, histone modifications, intergenic spacer, UBF, CTCF, chromatin regulation, rDNA promoter, cell type variation
- MeSH terms
- CCCTC-Binding Factor, Chromatin, DNA, Ribosomal, Histones, Humans, Nucleosomes, Promoter Regions, Genetic, Repressor Proteins, RNA Polymerase I, RNA, Ribosomal, Transcription, Genetic, Genome, Human, Sequence Alignment, Sequence Analysis, DNA, K562 Cells, Genomics, Pol1 Transcription Initiation Complex Proteins, Chromatin Immunoprecipitation, HEK293 Cells, High-Throughput Nucleotide Sequencing
About these checks
Registry, retraction, Cites and statistics results are computed, not judged, with one exception: a printed reference that no index lists is read once by a model before it counts as a citation error. Claims are extracted by a model and kept only when their quote appears verbatim in the text; each cited source is then checked, with a model’s help, for whether it says what the claim relies on. Those verdicts can be wrong — read the claim’s quote and the cited source before relying on one.
Statistics and arithmetic are recomputed, not judged.
Confidence bands are shown only for fields calibrated on our annotated test set. None is calibrated yet, so no band is shown.
What counts as a claim ›How we measure confidence ›How we check this ›
Are you an author, or do you see a problem with this page? Request a review
