Cited by 43

The DOI matches its Crossref record; 2 of the 2 references it cites were found in a registry or an index.

A novel role of CPEB3 in regulating EGFR gene transcription via association with Stat5b in neurons

Peng, Shu-Chun, Lai, Yen-Ting, Huang, Hsi-Yuan, Huang, Hsien-Da, Huang, Yi-Shuian·2010·Nucleic Acids Research

Overview

The claims and statistics of this paper haven’t been checked yet.

Run the check — free, no account needed. It reads the open-access text and checks the sources it cites.

A few free checks a day · papers already verified open instantly · results are public

Integrity signals

Registry

Crossref · 10.1093/nar/gkq634

Cites

2 of 2 references verified0 citation errors · 0 not checkable

Statistics

Figures

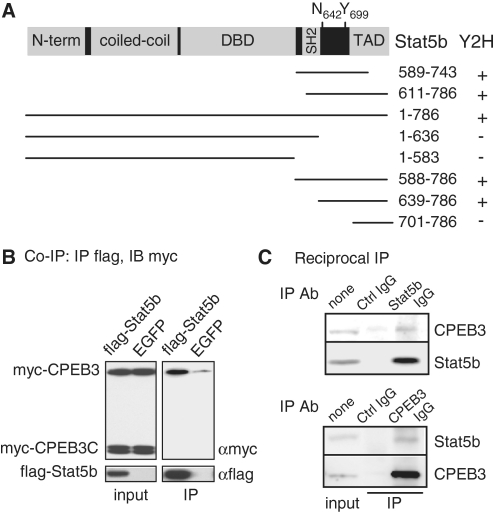
Figure 1. CPEB3 interacts with Stat5b. (A) Salient features of Stat5b showing the N-terminal region, coiled-coil domain, DNA-binding domain (DBD), Src-homology (SH2) and transactivation domain (TAD). The transcriptional activity of Stat5b is enhanced when the denoted tyrosine 699 (Y699) is phosphorylated upon growth hormone stimulation. When asparagine 642 mutated to histidine (N642H), it improves Stat5b’s activity by hindering dephosphorylation of phosphorylated Y699. Using the N-terminus (amino acids 1–427) of CPEB3 as the bait, a yeast two hybrid (Y2H) screen identified two clones corresponding to the amino acids 589–743 and 611–786 of Stat5b. The wild-type and truncated Stat5b mutants were tested for positive (+) or negative (–) interaction with the N-terminus of CPEB3. (B) Co-immunoprecipitation (Co-IP) assay. The plasmid expressing flag-Stat5b or a control EGFP along with plasmids encoding myc-tagged full-length (myc-CPEB3) and the C-terminal RNA-binding domain of CPEB3 (myc-CPEB3C) were cotransfected into 293T cells. The cell lysates were precipitated with flag antibody (Ab) and immunoblotted with myc Ab. IB: immunoblotting, IP: immunoprecipitation. (C) Reciprocal immunoprecipitation assay. The lysate from cortical neurons was precipitated with control, Stat5b or CPEB3 Ab and immunoblotted with CPEB3 and Stat5b Abs.
Figure 1. CPEB3 interacts with Stat5b. (A) Salient features of Stat5b showing the N-terminal region, coiled-coil domain, DNA-binding domain (DBD), Src-homology (SH2) and transactivation domain (TAD). The transcriptional activity of Stat5b is enhanced when the denoted tyrosine 699 (Y699) is phosphorylated upon growth hormone stimulation. When asparagine 642 mutated to histidine (N642H), it improves Stat5b’s activity by hindering dephosphorylation of phosphorylated Y699. Using the N-terminus (amino acids 1–427) of CPEB3 as the bait, a yeast two hybrid (Y2H) screen identified two clones corresponding to the amino acids 589–743 and 611–786 of Stat5b. The wild-type and truncated Stat5b mutants were tested for positive (+) or negative (–) interaction with the N-terminus of CPEB3. (B) Co-immunoprecipitation (Co-IP) assay. The plasmid expressing flag-Stat5b or a control EGFP along with plasmids encoding myc-tagged full-length (myc-CPEB3) and the C-terminal RNA-binding domain of CPEB3 (myc-CPEB3C) were cotransfected into 293T cells. The cell lysates were precipitated with flag antibody (Ab) and immunoblotted with myc Ab. IB: immunoblotting, IP: immunoprecipitation. (C) Reciprocal immunoprecipitation assay. The lysate from cortical neurons was precipitated with control, Stat5b or CPEB3 Ab and immunoblotted with CPEB3 and Stat5b Abs.CC BY-NC · PubMed Central
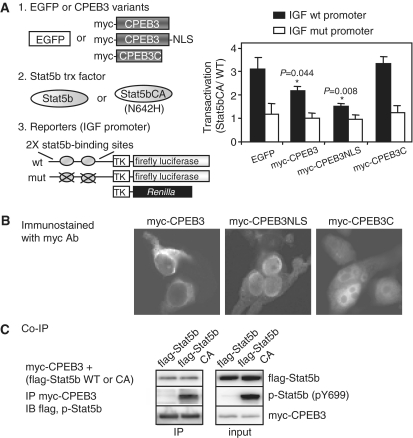
Figure 2. CPEB3 inhibits Stat5b-dependent transcription. (A) The 293T cells were transfected with plasmids encoding (i) EGFP, myc-CPEB3, myc-CPEB3 fused with the nuclear localization sequence (myc-CPEB3NLS) or myc-CPEB3C, and (ii) wild-type (WT) or constitutively active (CA) Stat5b with N642H mutation, and (iii) reporters expressing firefly luciferase driven by the IGF1 promoter containing two wild-type or mutated Stat5b-binding sites along with Renilla luciferase. TK: thymidine kinase promoter. Stat5b-mediated transactivation is expressed as fold of induction of normalized luciferase activity (firefly/Renilla) obtained in the presence of CA verse WT Stat5b. Three independent experiments were analyzed and expressed as mean ± s.e.m. and the asterisks denote significant difference (Student’s t-test). (B) Subcellular distribution of myc-CPEB3, myc-CPEB3NLS and myc-CPEB3C in 293T cells. (C) CPEB3 interacts similarly with Stat5b and Stat5bCA. The extracts containing myc-CPEB3 and WT or CA flag-Stat5b, were precipitated with myc Ab and probed with flag, p-Stat5b and myc Abs.
Figure 2. CPEB3 inhibits Stat5b-dependent transcription. (A) The 293T cells were transfected with plasmids encoding (i) EGFP, myc-CPEB3, myc-CPEB3 fused with the nuclear localization sequence (myc-CPEB3NLS) or myc-CPEB3C, and (ii) wild-type (WT) or constitutively active (CA) Stat5b with N642H mutation, and (iii) reporters expressing firefly luciferase driven by the IGF1 promoter containing two wild-type or mutated Stat5b-binding sites along with Renilla luciferase. TK: thymidine kinase promoter. Stat5b-mediated transactivation is expressed as fold of induction of normalized luciferase activity (firefly/Renilla) obtained in the presence of CA verse WT Stat5b. Three independent experiments were analyzed and expressed as mean ± s.e.m. and the asterisks denote significant difference (Student’s t-test). (B) Subcellular distribution of myc-CPEB3, myc-CPEB3NLS and myc-CPEB3C in 293T cells. (C) CPEB3 interacts similarly with Stat5b and Stat5bCA. The extracts containing myc-CPEB3 and WT or CA flag-Stat5b, were precipitated with myc Ab and probed with flag, p-Stat5b and myc Abs.CC BY-NC · PubMed Central
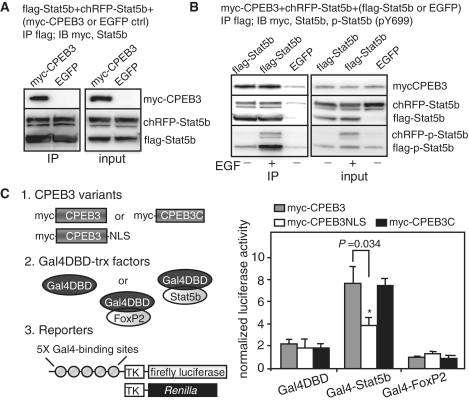
Figure 3. CPEB3 inhibits Stat5b-dependent transcription without affecting its dimerization and DNA-binding ability. (A) CPEB3 does not affect Stat5b dimerization. The 293T cells expressing flag-Stat5b and red fluorescence protein cherry (chRFP)-tagged Stat5b along with myc-CPEB3 or EGFP, were precipitated with flag Ab and probed with myc and Stat5b Abs. (B) Y699 phosphorylation in Stat5b has no effect on its dimerization as well as association with CPEB3. The 293T cells expressing myc-CPEB3 and red fluorescence protein cherry (chRFP)-tagged Stat5b along with flag-Stat5b or EGFP, were treated with or without EGF for an hour. The extracts were precipitated with flag antibody and probed with myc, Stat5b and pY699-Stat5b antibodies. (C) CPEB3 represses Stat5b-activated transcription without disrupting Stat5b’s DNA binding. The 293T cells were transfected with plasmids encoding (i) myc-CPEB3, myc-CPEB3NLS or myc-CPEB3C, and (ii) Gal4 DNA-binding domain (Gal4DBD) or Gal4DBD fused to Stat5b or FoxP2, and (iii) reporters containing firefly luciferase driven by the promoter containing five Gal4-binding sites and Renilla luciferase. The data from three sets of experiments is expressed as mean ± s.e.m. and the asterisks denote significant difference (Student’s t-test).
Figure 3. CPEB3 inhibits Stat5b-dependent transcription without affecting its dimerization and DNA-binding ability. (A) CPEB3 does not affect Stat5b dimerization. The 293T cells expressing flag-Stat5b and red fluorescence protein cherry (chRFP)-tagged Stat5b along with myc-CPEB3 or EGFP, were precipitated with flag Ab and probed with myc and Stat5b Abs. (B) Y699 phosphorylation in Stat5b has no effect on its dimerization as well as association with CPEB3. The 293T cells expressing myc-CPEB3 and red fluorescence protein cherry (chRFP)-tagged Stat5b along with flag-Stat5b or EGFP, were treated with or without EGF for an hour. The extracts were precipitated with flag antibody and probed with myc, Stat5b and pY699-Stat5b antibodies. (C) CPEB3 represses Stat5b-activated transcription without disrupting Stat5b’s DNA binding. The 293T cells were transfected with plasmids encoding (i) myc-CPEB3, myc-CPEB3NLS or myc-CPEB3C, and (ii) Gal4 DNA-binding domain (Gal4DBD) or Gal4DBD fused to Stat5b or FoxP2, and (iii) reporters containing firefly luciferase driven by the promoter containing five Gal4-binding sites and Renilla luciferase. The data from three sets of experiments is expressed as mean ± s.e.m. and the asterisks denote significant difference (Student’s t-test).CC BY-NC · PubMed Central
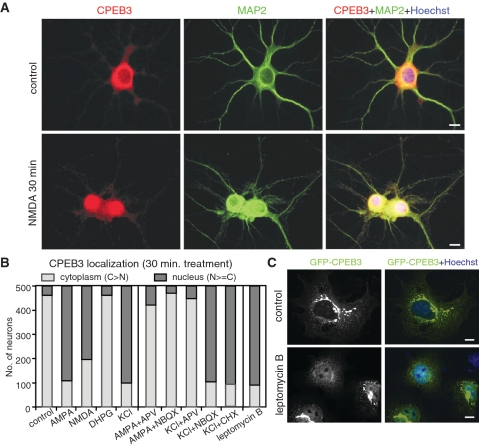
Figure 4. NMDAR signaling increases nuclear distribution of CPEB3. (A) Immunostaining of CPEB3 in cultured hippocampal neurons stimulated with or without NMDA for 30 min. MAP2 staining was used to identify neurons. (B) The summary result of CPEB3 localization from analyzing 500 neurons treated with various reagents for 30 min. The staining signal in the cytoplasm greater than that in the nucleus is considered as cytoplasm-localized (light gray bar) and the rest is grouped as nucleus-localized (dark gray bar). (C) The COS7 cells expressing GFP-CPEB3 were treated for 30 min with leptomycin B, fixed and stained for nuclei with Hoechst 33342. Scale: 10 µm.
Figure 4. NMDAR signaling increases nuclear distribution of CPEB3. (A) Immunostaining of CPEB3 in cultured hippocampal neurons stimulated with or without NMDA for 30 min. MAP2 staining was used to identify neurons. (B) The summary result of CPEB3 localization from analyzing 500 neurons treated with various reagents for 30 min. The staining signal in the cytoplasm greater than that in the nucleus is considered as cytoplasm-localized (light gray bar) and the rest is grouped as nucleus-localized (dark gray bar). (C) The COS7 cells expressing GFP-CPEB3 were treated for 30 min with leptomycin B, fixed and stained for nuclei with Hoechst 33342. Scale: 10 µm.CC BY-NC · PubMed Central
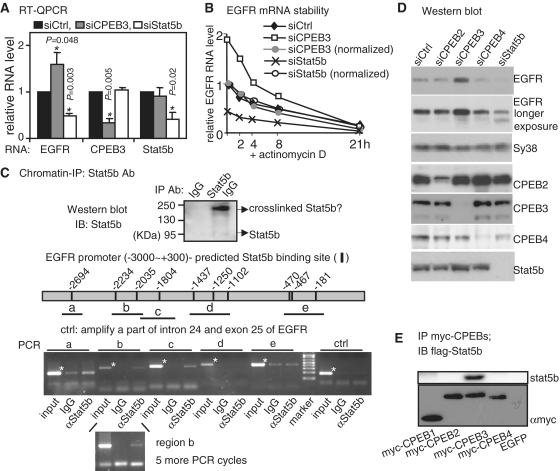
Figure 5. EGFR transcription is regulated by Stat5b and CPEB3. (A) The RNA levels of EGFR, CPEB3 and Stat5b in CPEB3 and Stat5b knockdown (siCPEB3 and siStat5b) hippocampal neurons were measured by quantitative RT–PCR and expressed as a relative ratio to the control knockdown (siCtrl) which was arbitrarily set to 1. The results are expressed as mean ± s.e.m. from three independent experiments and the asterisks denote the difference of statistical significance (Student’s t-test). (B) The stability of EGFR RNA in siCtrl, siCPEB3 and siStat5b neurons was measured in the presence of actinomycin D. The amount of EGFR RNA expressed as a relative ratio to the time zero siCtrl which was arbitrarily set to 1. To normalize the differential EGFR transcript level caused by CPEB3 or Stat5b knockdown, the amounts of EGFR RNA at time zero of siCPEB3 and siStat5b were arbitrarily set to 1 (normalized, siCPEB3: gray circle, siStat5b: open circle). (C) Chromatin immunoprecipitation of cortical neuronal lysate with Stat5b or control IgG. The pulled-down substances were analyzed for proteins and DNA. The Western blot shows precipitated Stat5b and the band of 190 kDa molecular weight is likely to be crosslinked dimeric Stat5b. The predicted Stat5b-binding sites within the –3000 to +300 EGFR promoter and the PCR-amplified regions (a–e) are illustrated. The specific amplified bands are indicated with asterisks. The regions, a, b and c, were amplified more evidently in the Stat5b immunoprecipitate. To increase signal intensity of the region b detected in the Stat5b immunoprecipitate, five more PCR cycles were applied. (D) Immunoblots using extracts from hippocampal neurons knocked down with CPEB2, CPEB3, CPEB4 or Stat5b. (E) Stat5b interacts with CPEB3 but not other CPEBs. The lysates containing flag-Stat5b and one of myc-tagged CPEBs1–4 were precipitated with myc Ab and probed with myc and flag Abs.
Figure 5. EGFR transcription is regulated by Stat5b and CPEB3. (A) The RNA levels of EGFR, CPEB3 and Stat5b in CPEB3 and Stat5b knockdown (siCPEB3 and siStat5b) hippocampal neurons were measured by quantitative RT–PCR and expressed as a relative ratio to the control knockdown (siCtrl) which was arbitrarily set to 1. The results are expressed as mean ± s.e.m. from three independent experiments and the asterisks denote the difference of statistical significance (Student’s t-test). (B) The stability of EGFR RNA in siCtrl, siCPEB3 and siStat5b neurons was measured in the presence of actinomycin D. The amount of EGFR RNA expressed as a relative ratio to the time zero siCtrl which was arbitrarily set to 1. To normalize the differential EGFR transcript level caused by CPEB3 or Stat5b knockdown, the amounts of EGFR RNA at time zero of siCPEB3 and siStat5b were arbitrarily set to 1 (normalized, siCPEB3: gray circle, siStat5b: open circle). (C) Chromatin immunoprecipitation of cortical neuronal lysate with Stat5b or control IgG. The pulled-down substances were analyzed for proteins and DNA. The Western blot shows precipitated Stat5b and the band of 190 kDa molecular weight is likely to be crosslinked dimeric Stat5b. The predicted Stat5b-binding sites within the –3000 to +300 EGFR promoter and the PCR-amplified regions (a–e) are illustrated. The specific amplified bands are indicated with asterisks. The regions, a, b and c, were amplified more evidently in the Stat5b immunoprecipitate. To increase signal intensity of the region b detected in the Stat5b immunoprecipitate, five more PCR cycles were applied. (D) Immunoblots using extracts from hippocampal neurons knocked down with CPEB2, CPEB3, CPEB4 or Stat5b. (E) Stat5b interacts with CPEB3 but not other CPEBs. The lysates containing flag-Stat5b and one of myc-tagged CPEBs1–4 were precipitated with myc Ab and probed with myc and flag Abs.CC BY-NC · PubMed Central
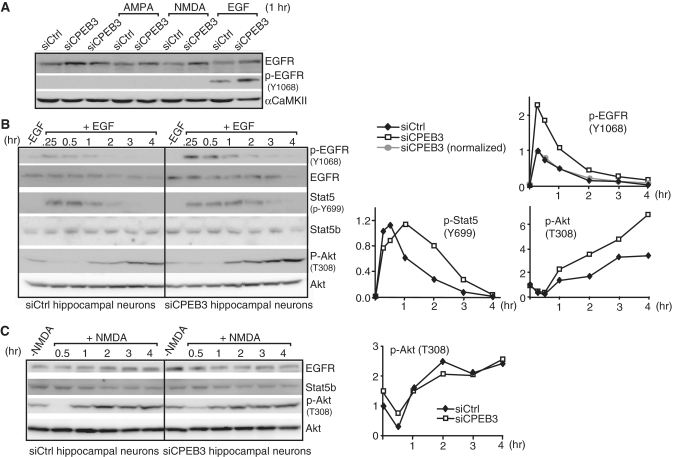
Figure 6. The kinetics of EGFR downstream signaling is altered in CPEB3-deficient hippocampal neurons. (A) The tyrosine kinase activity of EGFR as measured by autophosphorylation of Y1068 (p-Y1068) was assessed using siCtrl and siCPEB3 neurons treated with AMPA, NMDA and EGF. (B) Western blots of p-EGFR, EGFR, p-Stat5, Stat5b, p-Akt and Akt proteins in neurons treated with EGF at the indicated time. The signals were quantified and plotted against the time of treatment. The p-EGFR signal (top plot) in siCPEB3 neurons was also normalized with the fold of increase in EGFR protein level that was determined from non-EGF treated samples (normalized, gray circle). The signals of p-Stat5b at Y699 and p-Akt at T308 are displayed in the bottom plots. The signals of p-EGFR and p-Stat5b at 0.25 h and p-Akt at 0 h (i.e. no EGF treatment) from the siCtrl samples were arbitrarily set to 1. (C) Same as the above except neurons were treated with NMDA. The p-EGFR and p-Stat5b were undetectable (data not shown). The plot shows the kinetics of Akt T308 phosphorylation in siCtrl and siCPEB3 neurons.
Figure 6. The kinetics of EGFR downstream signaling is altered in CPEB3-deficient hippocampal neurons. (A) The tyrosine kinase activity of EGFR as measured by autophosphorylation of Y1068 (p-Y1068) was assessed using siCtrl and siCPEB3 neurons treated with AMPA, NMDA and EGF. (B) Western blots of p-EGFR, EGFR, p-Stat5, Stat5b, p-Akt and Akt proteins in neurons treated with EGF at the indicated time. The signals were quantified and plotted against the time of treatment. The p-EGFR signal (top plot) in siCPEB3 neurons was also normalized with the fold of increase in EGFR protein level that was determined from non-EGF treated samples (normalized, gray circle). The signals of p-Stat5b at Y699 and p-Akt at T308 are displayed in the bottom plots. The signals of p-EGFR and p-Stat5b at 0.25 h and p-Akt at 0 h (i.e. no EGF treatment) from the siCtrl samples were arbitrarily set to 1. (C) Same as the above except neurons were treated with NMDA. The p-EGFR and p-Stat5b were undetectable (data not shown). The plot shows the kinetics of Akt T308 phosphorylation in siCtrl and siCPEB3 neurons.CC BY-NC · PubMed Central
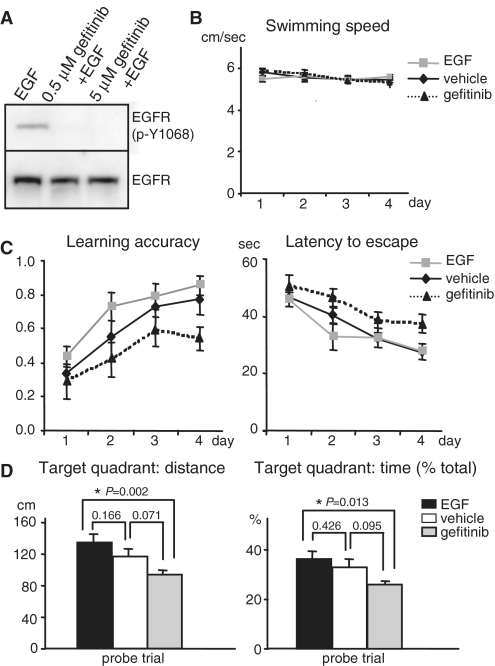
Figure 7. EGFR influences spatial memory. (A) To test gefitinib potency, the hippocampal neurons were stimulated with EGF in the presence or absence of gefitinib. The EGFR kinase activity was indicated by p-Y1068. (B) No difference in the swimming speed in the water maze task among vehicle, EGF and gefitinib-treated mice. (C) Intervention of the kinase activity of EGFR in the brain with EGF (activation) and gefitinib (inhibition) affects the learning accuracy and latency to escape in Morris water maze tasks. The accuracy was calculated per day as the trial number that the mice successfully climb onto the invisible platform divided by total four trials. The gefitinib group (n = 10) showed slower and impaired learning in Morris water maze when compared to the control vehicle group (n = 11) as judged by reduced learning accuracy (left plot, P = 0.021) and increased latency (right plot, P = 0.016) to locate the invisible platform for the four consecutive training days. In contrast, the EGF-treated group (n = 12) showed a trend of enhanced learning accuracy (left plot, P = 0.074) and decreased latency (right plot, P = 0.452). The P-value was calculated using the two-way ANOVA least square difference (LSD) analysis. (D) For the probe trial when the platform was removed after the 4-day training, the distance (left plot) and the percentage of time (right plot) that EGF- and gefitinib-treated mice swam in the target quadrant where the platform used to be were increased and reduced, respectively, when compared to the vehicle-infused mice. The P-value was calculated using the one-way ANOVA LSD test to compare the statistical difference between groups.
Figure 7. EGFR influences spatial memory. (A) To test gefitinib potency, the hippocampal neurons were stimulated with EGF in the presence or absence of gefitinib. The EGFR kinase activity was indicated by p-Y1068. (B) No difference in the swimming speed in the water maze task among vehicle, EGF and gefitinib-treated mice. (C) Intervention of the kinase activity of EGFR in the brain with EGF (activation) and gefitinib (inhibition) affects the learning accuracy and latency to escape in Morris water maze tasks. The accuracy was calculated per day as the trial number that the mice successfully climb onto the invisible platform divided by total four trials. The gefitinib group (n = 10) showed slower and impaired learning in Morris water maze when compared to the control vehicle group (n = 11) as judged by reduced learning accuracy (left plot, P = 0.021) and increased latency (right plot, P = 0.016) to locate the invisible platform for the four consecutive training days. In contrast, the EGF-treated group (n = 12) showed a trend of enhanced learning accuracy (left plot, P = 0.074) and decreased latency (right plot, P = 0.452). The P-value was calculated using the two-way ANOVA least square difference (LSD) analysis. (D) For the probe trial when the platform was removed after the 4-day training, the distance (left plot) and the percentage of time (right plot) that EGF- and gefitinib-treated mice swam in the target quadrant where the platform used to be were increased and reduced, respectively, when compared to the vehicle-infused mice. The P-value was calculated using the one-way ANOVA LSD test to compare the statistical difference between groups.CC BY-NC · PubMed Central

Verification

Claims the paper makes

The claims and statistics of this paper haven’t been checked yet.

Run the check — free, no account needed. It reads the open-access text and checks the sources it cites.

A few free checks a day · papers already verified open instantly · results are public

Claims other papers make about this one

Each is checked against this paper’s own text: does it say what the citing paper says it does?

Self-check

Percentages, sums and reported differences re-computed from the paper’s own numbers.

The self-check needs the paper’s full text.

Citations

Cites

Research works printed but not linked: 53

  1. Richter, 2009, Making synaptic plasticity and memory last: mechanisms of translational regulation, Genes Dev., 23, 1, 10.1101/gad.1735809 · DOI
  2. Bramham, 2007, Dendritic mRNA: transport, translation and function, Nat. Rev. Neurosci., 8, 776, 10.1038/nrn2150 · DOI
  3. Costa-Mattioli, 2009, Translational control of long-lasting synaptic plasticity and memory, Neuron, 61, 10, 10.1016/j.neuron.2008.10.055 · DOI · Paper page
  4. Giorgi, 2007, The EJC factor eIF4AIII modulates synaptic strength and neuronal protein expression, Cell, 130, 179, 10.1016/j.cell.2007.05.028 · DOI
  5. Huang, 2006, CPEB3 and CPEB4 in neurons: analysis of RNA-binding specificity and translational control of AMPA receptor GluR2 mRNA, EMBO J., 25, 4865, 10.1038/sj.emboj.7601322 · DOI
  6. Theis, 2003, Two previously undescribed members of the mouse CPEB family of genes and their inducible expression in the principal cell layers of the hippocampus, Proc. Natl Acad. Sci. USA, 100, 9602, 10.1073/pnas.1133424100 · DOI
  7. Keleman, 2007, Function of the Drosophila CPEB protein Orb2 in long-term courtship memory, Nat. Neurosci., 10, 1587, 10.1038/nn1996 · DOI
  8. Vogler, 2009, CPEB3 is Associated with Human Episodic Memory, Front Behav. Neurosci., 3, 4, 10.3389/neuro.08.004.2009 · DOI
  9. Mendez, 2001, Translational control by CPEB: a means to the end, Nat. Rev. Mol. Cell Biol., 2, 521, 10.1038/35080081 · DOI
  10. Richter, 2007, CPEB: a life in translation, Trends Biochem. Sci., 32, 279, 10.1016/j.tibs.2007.04.004 · DOI
  11. Si, 2003, A neuronal isoform of the aplysia CPEB has prion-like properties, Cell, 115, 879, 10.1016/S0092-8674(03)01020-1 · DOI
  12. Si, 2010, Aplysia CPEB can form prion-like multimers in sensory neurons that contribute to long-term facilitation, Cell, 140, 421, 10.1016/j.cell.2010.01.008 · DOI
  13. Johnston, 1995, Tyrosine phosphorylation and activation of STAT5, STAT3, and Janus kinases by interleukins 2 and 15, Proc. Natl Acad. Sci. USA, 92, 8705, 10.1073/pnas.92.19.8705 · DOI
  14. Gouilleux, 1994, Prolactin induces phosphorylation of Tyr694 of Stat5 (MGF), a prerequisite for DNA binding and induction of transcription, EMBO J., 13, 4361, 10.1002/j.1460-2075.1994.tb06756.x · DOI
  15. Mertens, 2007, SnapShot: JAK-STAT signaling, Cell, 131, 612, 10.1016/j.cell.2007.10.033 · DOI
  16. Ninomiya, 2006, Enhanced neurogenesis in the ischemic striatum following EGF-induced expansion of transit-amplifying cells in the subventricular zone, Neurosci. Lett., 403, 63, 10.1016/j.neulet.2006.04.039 · DOI
  17. Torroglosa, 2007, Nitric oxide decreases subventricular zone stem cell proliferation by inhibition of epidermal growth factor receptor and phosphoinositide-3-kinase/Akt pathway, Stem Cells, 25, 88, 10.1634/stemcells.2006-0131 · DOI
  18. Hynes, 2009, ErbB receptors and signaling pathways in cancer, Curr. Opin. Cell Biol., 21, 177, 10.1016/j.ceb.2008.12.010 · DOI · Paper page
  19. Sibilia, 1998, A strain-independent postnatal neurodegeneration in mice lacking the EGF receptor, EMBO J., 17, 719, 10.1093/emboj/17.3.719 · DOI
  20. Kornblum, 1998, Abnormal astrocyte development and neuronal death in mice lacking the epidermal growth factor receptor, J. Neurosci. Res., 53, 697, 10.1002/(SICI)1097-4547(19980915)53:6<697::AID-JNR8>3.0.CO;2-0 · DOI
  21. Terlau, 1989, Influence of epidermal growth factor on long-term potentiation in the hippocampal slice, Brain Res., 484, 352, 10.1016/0006-8993(89)90380-6 · DOI
  22. Ishiyama, 1991, Epidermal growth factor and basic fibroblast growth factor promote the generation of long-term potentiation in the dentate gyrus of anaesthetized rats, Neurosci. Res., 12, 403, 10.1016/0168-0102(91)90071-6 · DOI
  23. Arteaga, 2001, Tyrosine kinase inhibitors-ZD1839 (Iressa), Curr. Opin. Oncol., 13, 491, 10.1097/00001622-200111000-00012 · DOI
  24. Novoa, Mitotic cell-cycle progression is regulated by CPEB1 and CPEB4-dependent translational control, Nat. Cell. Biol., 12, 447, 10.1038/ncb2046 · DOI
  25. Hagele, 2009, Cytoplasmic polyadenylation-element-binding protein (CPEB)1 and 2 bind to the HIF-1alpha mRNA 3′-UTR and modulate HIF-1alpha protein expression, Biochem. J., 417, 235, 10.1042/BJ20081353 · DOI
  26. Huang, 2007, Analysis of mRNA translation in cultured hippocampal neurons, Methods Enzymol., 431, 143, 10.1016/S0076-6879(07)31008-2 · DOI
  27. Banker, 1988, Developments in neuronal cell culture, Nature, 336, 185, 10.1038/336185a0 · DOI
  28. Morris, 1984, Developments of a water-maze procedure for studying spatial learning in the rat, J. Neurosci. Methods, 11, 47, 10.1016/0165-0270(84)90007-4 · DOI · Paper page
  29. Woelfle, 2003, Mechanisms of growth hormone (GH) action. Identification of conserved Stat5 binding sites that mediate GH-induced insulin-like growth factor-I gene activation, J. Biol. Chem., 278, 51261, 10.1074/jbc.M309486200 · DOI
  30. Ariyoshi, 2000, Constitutive activation of STAT5 by a point mutation in the SH2 domain, J. Biol. Chem., 275, 24407, 10.1074/jbc.M909771199 · DOI
  31. Toda, 2008, A reporter assay for Stat5-dependent promoters without cytokine stimulation, Anal. Biochem., 372, 250, 10.1016/j.ab.2007.10.006 · DOI
  32. Clodfelter, 2006, Sex-dependent liver gene expression is extensive and largely dependent upon signal transducer and activator of transcription 5b (STAT5b): STAT5b-dependent activation of male genes and repression of female genes revealed by microarray analysis, Mol. Endocrinol., 20, 1333, 10.1210/me.2005-0489 · DOI
  33. Kel, 2003, MATCH: a tool for searching transcription factor binding sites in DNA sequences, Nucleic Acids Res., 31, 3576, 10.1093/nar/gkg585 · DOI
  34. Giorgi, 2007, The nuclear nurture and cytoplasmic nature of localized mRNPs, Semin Cell. Dev. Biol., 18, 186, 10.1016/j.semcdb.2007.01.002 · DOI
  35. Alwan, 2003, Ligand-induced lysosomal epidermal growth factor receptor (EGFR) degradation is preceded by proteasome-dependent EGFR de-ubiquitination, J. Biol. Chem., 278, 35781, 10.1074/jbc.M301326200 · DOI
  36. Sorkin, 2008, Endocytosis and intracellular trafficking of ErbBs, Exp. Cell Res., 314, 3093
  37. Ernoult-Lange, 2009, Nucleocytoplasmic traffic of CPEB1 and accumulation in Crm1 nucleolar bodies, Mol. Biol. Cell, 20, 176, 10.1091/mbc.E08-09-0904 · DOI
  38. Lin, 2009, The nuclear experience of CPEB: Implications for RNA processing and translational control, RNA, 16, 338, 10.1261/rna.1779810 · DOI
  39. Levy, 2002, Stats: transcriptional control and biological impact, Nat. Rev. Mol. Cell. Biol., 3, 651, 10.1038/nrm909 · DOI · Paper page
  40. Chatterjee-Kishore, 2000, How Stat1 mediates constitutive gene expression: a complex of unphosphorylated Stat1 and IRF1 supports transcription of the LMP2 gene, EMBO J., 19, 4111, 10.1093/emboj/19.15.4111 · DOI
  41. Sehgal, 2008, Paradigm shifts in the cell biology of STAT signaling, Semin. Cell Dev. Biol., 19, 329, 10.1016/j.semcdb.2008.07.003 · DOI
  42. Nakajima, 2001, Functional interaction of STAT5 and nuclear receptor co-repressor SMRT: implications in negative regulation of STAT5-dependent transcription, EMBO J., 20, 6836, 10.1093/emboj/20.23.6836 · DOI
  43. Lewis, 2003, The mediator coactivator complex: functional and physical roles in transcriptional regulation, J. Cell. Sci., 116, 3667, 10.1242/jcs.00734 · DOI
  44. Marr, 2006, Coactivator cross-talk specifies transcriptional output, Genes Dev., 20, 1458, 10.1101/gad.1418806 · DOI
  45. Berthelsen, 1998, Prep1, a novel functional partner of Pbx proteins, EMBO J., 17, 1423, 10.1093/emboj/17.5.1423 · DOI
  46. Villaescusa, 2009, Cytoplasmic Prep1 interacts with 4EHP inhibiting Hoxb4 translation, PLoS One, 4, e5213, 10.1371/journal.pone.0005213 · DOI
  47. Duncan, 1994, A sequence-specific, single-strand binding protein activates the far upstream element of c-myc and defines a new DNA-binding motif, Genes Dev., 8, 465, 10.1101/gad.8.4.465 · DOI
  48. Wan, 2007, Ribosomal protein S3: a KH domain subunit in NF-kappaB complexes that mediates selective gene regulation, Cell, 131, 927, 10.1016/j.cell.2007.10.009 · DOI
  49. Opazo, 2003, Phosphatidylinositol 3-kinase regulates the induction of long-term potentiation through extracellular signal-related kinase-independent mechanisms, J. Neurosci., 23, 3679, 10.1523/JNEUROSCI.23-09-03679.2003 · DOI · Paper page
  50. Lin, 2001, A role for the PI-3 kinase signaling pathway in fear conditioning and synaptic plasticity in the amygdala, Neuron, 31, 841, 10.1016/S0896-6273(01)00433-0 · DOI
  51. English, 1996, Activation of p42 mitogen-activated protein kinase in hippocampal long term potentiation, J. Biol. Chem., 271, 24329, 10.1074/jbc.271.40.24329 · DOI
  52. Futamura, 2002, Abnormal expression of epidermal growth factor and its receptor in the forebrain and serum of schizophrenic patients, Mol. Psychiatry, 7, 673, 10.1038/sj.mp.4001081 · DOI
  53. Futamura, 2003, Neonatal perturbation of neurotrophic signaling results in abnormal sensorimotor gating and social interaction in adults: implication for epidermal growth factor in cognitive development, Mol. Psychiatry, 8, 19, 10.1038/sj.mp.4001138 · DOI

Cited by

Sorted by citations

See all 43

Metadata

Authors
Peng, S.-C., Lai, Y.-T., Huang, H.-Y., Huang, H.-D., & Huang, Y.-S.
Venue
Nucleic Acids Research
Published
2010-07-17
Volume
38
Issue
21
Pages
7446-7457
ISSN
  • 1362-4962
  • 0305-1048
Cited by
43
References
2
Language
en

About these checks

Registry, retraction, Cites and statistics results are computed, not judged, with one exception: a printed reference that no index lists is read once by a model before it counts as a citation error. Claims are extracted by a model and kept only when their quote appears verbatim in the text; each cited source is then checked, with a model’s help, for whether it says what the claim relies on. Those verdicts can be wrong — read the claim’s quote and the cited source before relying on one.

Statistics and arithmetic are recomputed, not judged.

Confidence bands are shown only for fields calibrated on our annotated test set. None is calibrated yet, so no band is shown.

What counts as a claim ›How we measure confidence ›How we check this ›

Are you an author, or do you see a problem with this page? Request a review