

The DOI matches its Crossref record; 47 of the 48 references it cites were found in a registry or an index.
Self-organization of domain structures by DNA-loop-extruding enzymes
Open accessAbstract
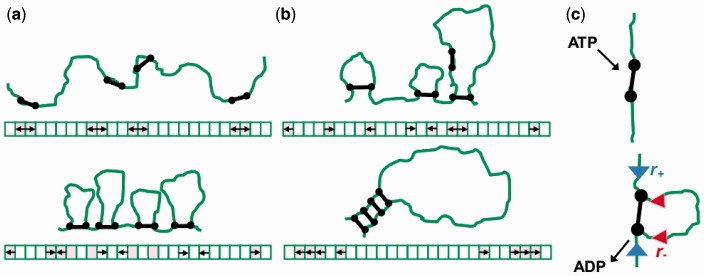
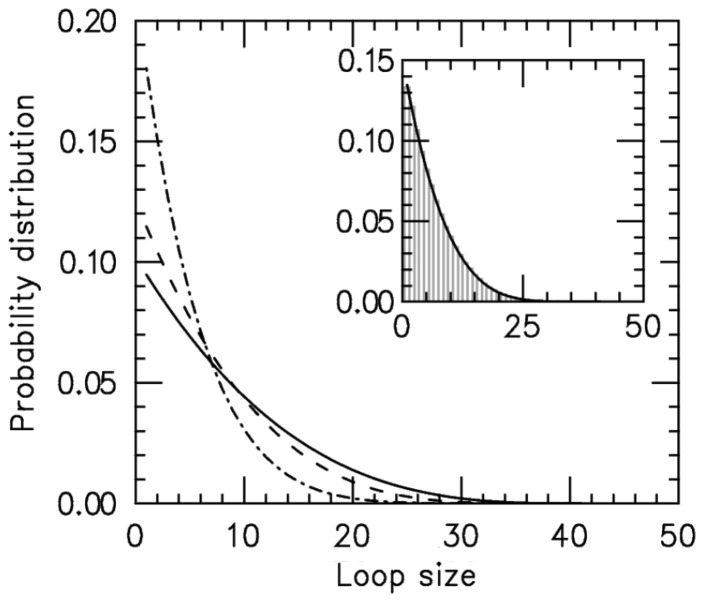
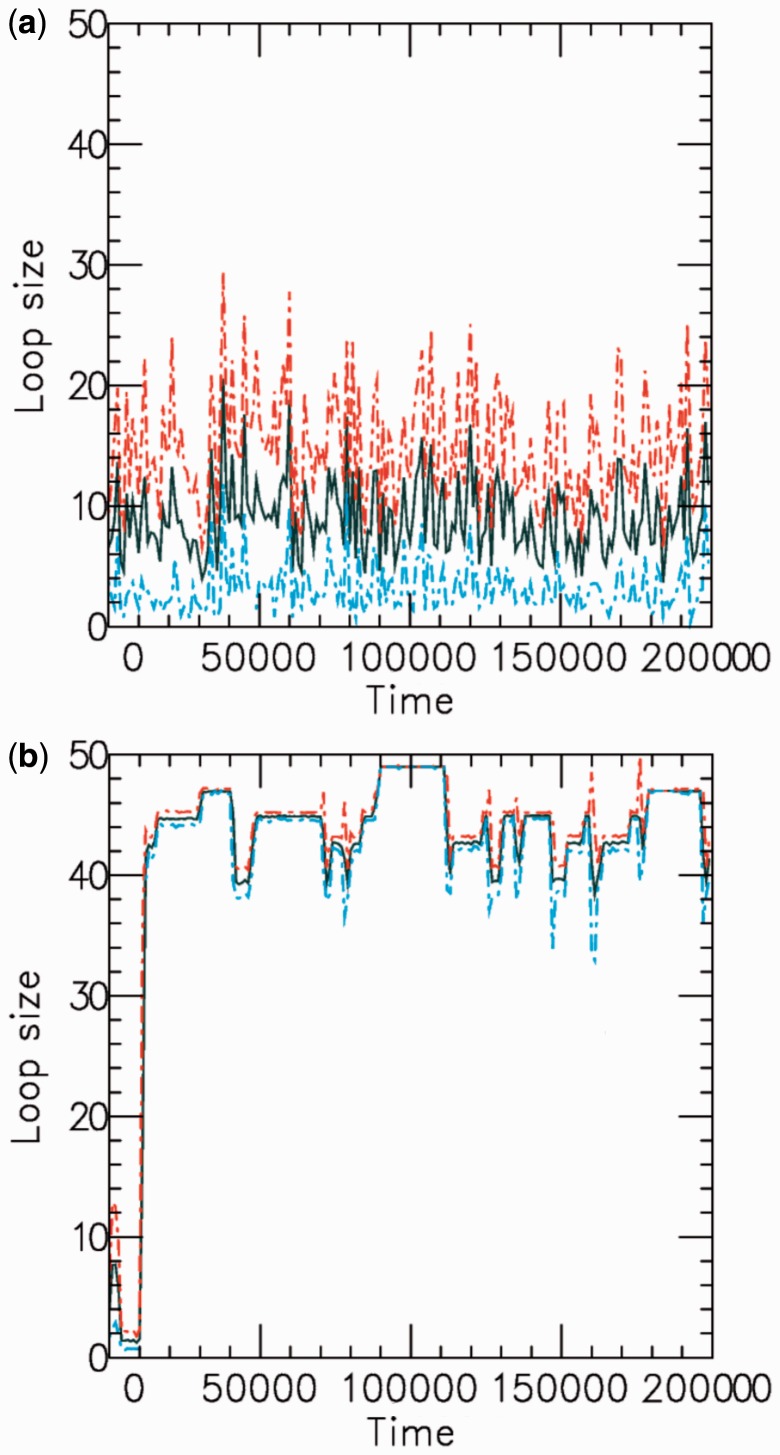
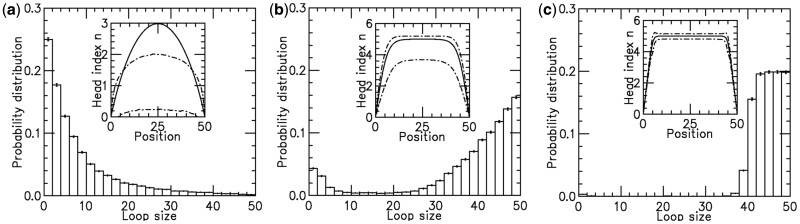
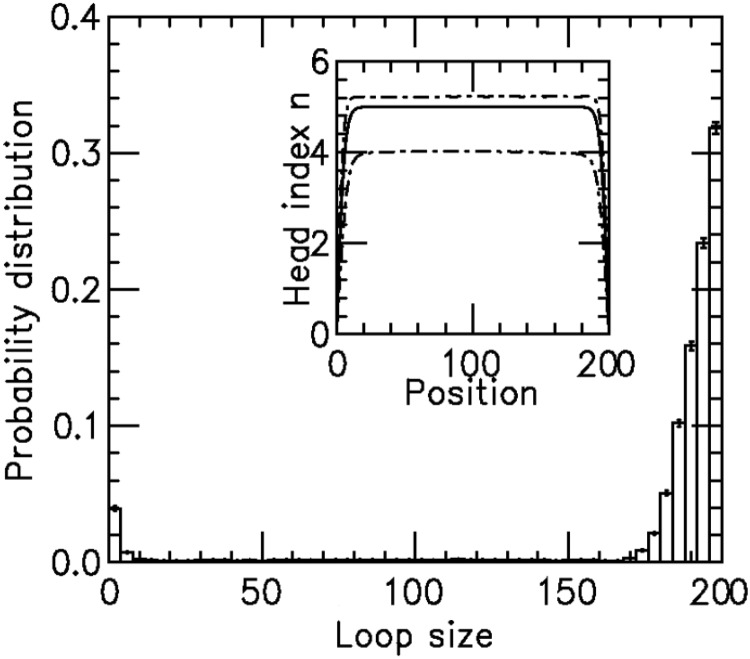
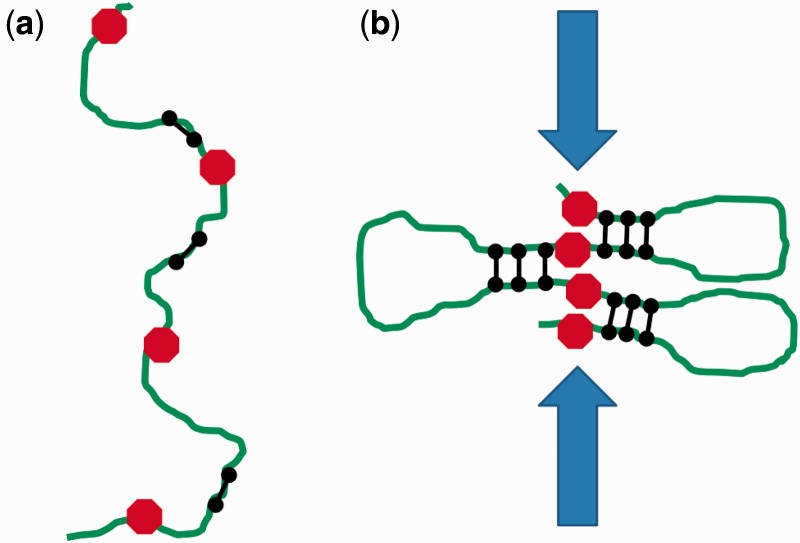
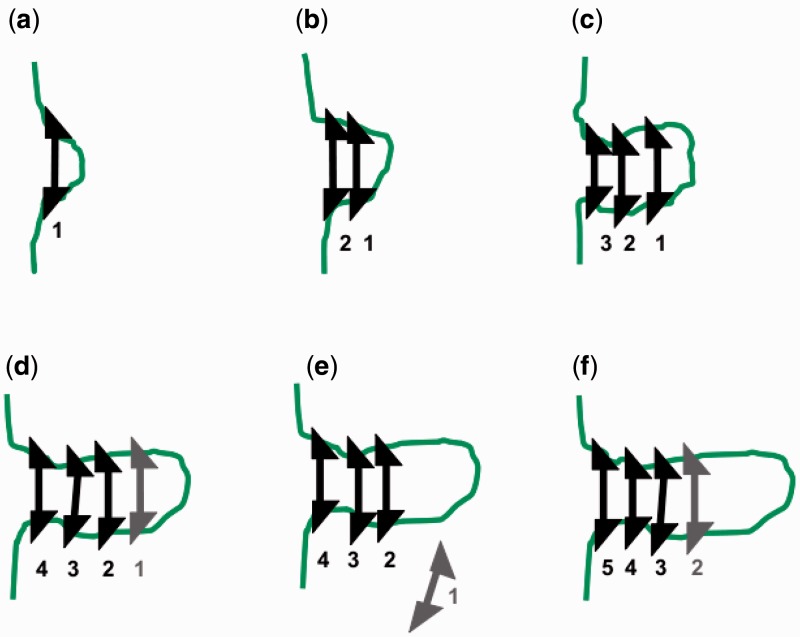
The long chromosomal DNAs of cells are organized into loop domains much larger in size than individual DNA-binding enzymes, presenting the question of how formation of such structures is controlled. We present a model for generation of defined chromosomal loops, based on molecular machines consisting of two coupled and oppositely directed motile elements which extrude loops from the double helix along which they translocate, while excluding one another sterically. If these machines do not dissociate from DNA (infinite processivity), a disordered, exponential steady-state distribution of small loops is obtained. However, if dissociation and rebinding of the machines occurs at a finite rate (finite processivity), the steady state qualitatively changes to a highly ordered 'stacked' configuration with suppressed fluctuations, organizing a single large, stable loop domain anchored by several machines. The size of the resulting domain can be simply regulated by boundary elements, which halt the progress of the extrusion machines. Possible realizations of these types of molecular machines are discussed, with a major focus on structural maintenance of chromosome complexes and also with discussion of type I restriction enzymes. This mechanism could explain the geometrically uniform folding of eukaryote mitotic chromosomes, through extrusion of pre-programmed loops and concomitant chromosome compaction.
Overview
The claims and statistics of this paper haven’t been checked yet.
Run the check — free, no account needed. It reads the open-access text and checks the sources it cites.
Integrity signals
Registry
Cites
Statistics
Figures
Verification
Claims the paper makes
The claims and statistics of this paper haven’t been checked yet.
Run the check — free, no account needed. It reads the open-access text and checks the sources it cites.
Claims other papers make about this one
Each is checked against this paper’s own text: does it say what the citing paper says it does?
In the citing paper
“this favors a linear tracking mechanism,47 known as the “loop extrusion model”.8,9,48”
From Recent evidence that TADs and chromatin loops are dynamic structures (2018) · cites this paper as [48]
Self-check
Percentages, sums and reported differences re-computed from the paper’s own numbers.
The self-check needs the paper’s full text.
Citations
Cites
Table of Integrals, Series, and Products
(1980) · Elsevier eBooks · doi:10.1016/c2013-0-10754-4 · Cited by 19,385
Exact stochastic simulation of coupled chemical reactions
Gillespie, D. T. (1977) · The Journal of Physical Chemistry · doi:10.1021/j100540a008 · Cited by 10,215
Scaling Concepts in Polymer Physics
de Gennes, P. G., & Witten, T. A. (1980) · Physics Today · doi:10.1063/1.2914118 · Cited by 9,348
Comprehensive Mapping of Long-Range Interactions Reveals Folding Principles of the Human Genome
Lieberman-Aiden, E., van Berkum, N. L., Williams, L., Imakaev, M., Ragoczy, T., Telling, A., Amit, I., Lajoie, B. R., Sabo, P. J., Dorschner, M. O., et al. (2009) · Science · doi:10.1126/science.1181369 · Cited by 8,898 · cited 1×
“Furthermore, analyses of DNA juxtapositions inside eukaryote nuclei reveal that loci up to tens of megabases apart along chromosomes are positioned near one another in the nucleus (9,10), with statistical properties inconsistent with randompolymer organization (10).”
BackgroundCapturing Chromosome Conformation
Dekker, J., Rippe, K., Dekker, M., & Kleckner, N. (2002) · Science · doi:10.1126/science.1067799 · Cited by 3,652
Mediator and cohesin connect gene expression and chromatin architecture
Kagey, M. H., Newman, J. J., Bilodeau, S., Zhan, Y., Orlando, D. A., van Berkum, N. L., Ebmeier, C. C., Goossens, J., Rahl, P. B., Levine, S. S., et al. (2010) · Nature · doi:10.1038/nature09380 · Cited by 1,939
Cohesin mediates transcriptional insulation by CCCTC-binding factor
Wendt, K. S., Yoshida, K., Itoh, T., Bando, M., Koch, B., Schirghuber, E., Tsutsumi, S., Nagae, G., Ishihara, K., Mishiro, T., et al. (2008) · Nature · doi:10.1038/nature06634 · Cited by 1,193 · cited 1×
“It is thought that ‘chromatin-bridging’ proteins (12) somehow stabilize these loop structures, but the processes by which sequence-defined chromatin loops are established and maintained are unknown.”
BackgroundChromosome territories – a functional nuclear landscape
Cremer, T., Cremer, M., Dietzel, S., Müller, S., Solovei, I. V., & Fakan, S. (2006) · Current Opinion in Cell Biology · doi:10.1016/j.ceb.2006.04.007 · Cited by 601 · cited 1×
“In eukaryote cells, interphase chromosomes in differentiated cells occupy distinct territories (8).”
BackgroundOno, T., Losada, A., Hirano, M., Myers, M., Neuwald, A. F., & Hirano, T. (2003) · Cell · doi:10.1016/s0092-8674(03)00724-4 · Cited by 588
A heterodimeric coiled-coil protein required for mitotic chromosome condensation in vitro.
Hirano, T., & Mitchison, T. (1994) · Cell · doi:10.1016/0092-8674(94)90254-2 · Cited by 559 · cited 1×
“Immuno-inactivation of condensin complexes in Xenopus egg extracts (an in vitro system capable of assembling mitotic chromosomes) (22), or siRNA depletion of even one subunit of condensin complexes (23,24) in tissue culture cells, causes defective mitotic chromosome condensation.”
BackgroundViollier, P. H., Thanbichler, M., McGrath, P. T., West, L. E., Meewan, M., McAdams, H., & Shapiro, L. (2004) · Proceedings of the National Academy of Sciences of the United States of America · doi:10.1073/pnas.0402606101 · Cited by 435 · cited 1×
“Chromosomes of Escherichia coli (3–5) and Caulobacter crescentus (6) have loci precisely positioned inside the cell, with fluctuations too small to be consistent with random-polymer statistics (7).”
Kimura, K., & Hirano, T. (1997) · Cell · doi:10.1016/s0092-8674(00)80524-3 · Cited by 396
Dynamic organization of chromosomal DNA in Escherichia coliPreprint
Niki, H., Yamaichi, Y., & Hiraga, S. (2000) · Genes & Development · doi:10.1101/gad.14.2.212 · Cited by 391
Distinct functions of condensin I and II in mitotic chromosome assembly
Hirota, T., Gerlich, D. W., Koch, B., Ellenberg, J., & Peters, J. (2004) · Journal of Cell Science · doi:10.1242/jcs.01604 · Cited by 379 · cited 1×
“Immuno-inactivation of condensin complexes in Xenopus egg extracts (an in vitro system capable of assembling mitotic chromosomes) (22), or siRNA depletion of even one subunit of condensin complexes (23,24) in tissue culture cells, causes defective mitotic chromosome condensation.”
BackgroundJun, S., & Mulder, B. (2006) · Proceedings of the National Academy of Sciences of the United States of America · doi:10.1073/pnas.0605305103 · Cited by 376 · cited 1×
“It has been proposed that chromosomes might simply occupy maximum-entropy conformations, in the manner of confined random-coil polymers (1,2).”
BackgroundControl of Actin Filament Treadmilling in Cell Motility
Bugyi, B., & Carlier, M. (2010) · Annual Review of Biophysics · doi:10.1146/annurev-biophys-051309-103849 · Cited by 343
Identification of cis -acting sites for condensin loading onto budding yeast chromosomesPreprint
D’Ambrosio, C., Schmidt, C. K., 由起, 加., Kelly, G., Itoh, T., 克彦, 白., & Uhlmann, F. (2008) · Genes & Development · doi:10.1101/gad.1675708 · Cited by 339 · cited 1×
“Condensin is known to be ‘loaded’ onto yeast chromosomes at specific locations (38), but it is not yet known if this is true in higher eukaryotes.”
BackgroundKimura, K., Rybenkov, V., Crisona, N. J., Hirano, T., & Cozzarelli, N. (1999) · Cell · doi:10.1016/s0092-8674(00)81018-1 · Cited by 336 · cited 1×
“Furthermore, experiments that observe an ATP-dependent (35) and phosphorylation-regulated (36) DNA supercoiling activity of condensin indicate that condensin is able to impose 3D constraints on the bound DNA, so as to generate positive writhe (37).”
BackgroundBates, D. B., & Kleckner, N. E. (2005) · Cell · doi:10.1016/j.cell.2005.04.013 · Cited by 323
Hudson, D., Vagnarelli, P., Gassmann, R., & Earnshaw, W. (2003) · Developmental Cell · doi:10.1016/s1534-5807(03)00199-0 · Cited by 311 · cited 1×
“Cells where one condensin subunit can be inducibly knocked out also show chromosome condensation defects (25).”
BackgroundThe ABCs of SMC proteins: two-armed ATPases for chromosome condensation, cohesion, and repairPreprint
Hirano, T. (2002) · Genes & Development · doi:10.1101/gad.955102 · Cited by 303
Condensin and cohesin complexity: the expanding repertoire of functions
Wood, A. J., Severson, A. F., & Meyer, B. J. (2010) · Nature Reviews Genetics · doi:10.1038/nrg2794 · Cited by 268 · cited 1×
“It is thought that structural maintenance of chromosome (SMC) complexes are in general involved in mediating distant-site interactions in chromatin (19), with condensin SMCs playing a key role in mitotic chromosome folding (20), and with cohesin SMCs playing an important role in sister chromatid cohesion and in defini…”
BackgroundHuman chromokinesin KIF4A functions in chromosome condensation and segregation
Mazumdar, M., Sundareshan, S., & Misteli, T. (2004) · The Journal of Cell Biology · doi:10.1083/jcb.200401142 · Cited by 213 · cited 1×
“Other motors, notably the chromokinesin KIF4A that controls chromosome condensation and the chromatidaxial distribution of condensins in metaphase chromosomes (45) might also contribute to condensin relocation.”
BackgroundEntropy as the driver of chromosome segregation
Jun, S., & Wright, A. (2010) · Nature Reviews Microbiology · doi:10.1038/nrmicro2391 · Cited by 207 · cited 1×
“It has been proposed that chromosomes might simply occupy maximum-entropy conformations, in the manner of confined random-coil polymers (1,2).”
BackgroundNielsen, H. J., Ottesen, J. R., Youngren, B., Austin, S., & Hansen, F. G. (2006) · Molecular Microbiology · doi:10.1111/j.1365-2958.2006.05346.x · Cited by 197
Condensin association with histone H2A shapes mitotic chromosomes
Tada, K., Susumu, H., Sakuno, T., & Watanabe, Y. (2011) · Nature · doi:10.1038/nature10179 · Cited by 186 · cited 1×
“It is also feasible that a wide variety of interactions of condensins with chromatin proteins regulate mitotic chromosome condensation activity, including interactions with core histones (41).”
BackgroundCondensin structures chromosomal DNA through topological links
Cuylen, S., Metz, J., & Haering, C. H. (2011) · Nature Structural & Molecular Biology · doi:10.1038/nsmb.2087 · Cited by 186 · cited 2×
“Recently, it has been discovered that condensins interact with DNA through a ‘topological embrace’ mechanism whereby condensins are linked to DNA through their tripartite ring-like structure (27).”
BackgroundMitotic chromosomes are chromatin networks without a mechanically contiguous protein scaffold
Poirier, M. G., & Marko, J. F. (2002) · Proceedings of the National Academy of Sciences · doi:10.1073/pnas.232442599 · Cited by 178
Self-citationDanilova, O., Reyes‐Lamothe, R., Pinskaya, M., Sherratt, D. J., & Possoz, C. (2007) · Molecular Microbiology · doi:10.1111/j.1365-2958.2007.05881.x · Cited by 170
Strong intranucleoid interactions organize the Escherichia coli chromosome into a nucleoid filament
Wiggins, P. A., Cheveralls, K. C., Martin, J. S., Lintner, R. E., & Kondev, J. (2010) · Proceedings of the National Academy of Sciences · doi:10.1073/pnas.0912062107 · Cited by 164 · cited 1×
“Chromosomes of Escherichia coli (3–5) and Caulobacter crescentus (6) have loci precisely positioned inside the cell, with fluctuations too small to be consistent with random-polymer statistics (7).”
BackgroundSARs are cis DNA elements of chromosome dynamics: Synthesis of a SAR repressor protein
Strick, R., & Laemmli, U. K. (1995) · Cell · doi:10.1016/0092-8674(95)90140-x · Cited by 157
Polymer Models of Meiotic and Mitotic Chromosomes
Marko, J. F., & Siggia, E. D. (1997) · Molecular Biology of the Cell · doi:10.1091/mbc.8.11.2217 · Cited by 152 · cited 4×
“For the case of mitotic/meitoic chromosome condensation, a random-collision model of contact formation cannot lead to linearly condensed chromosomes since the underlying DNA sequence distance between juxtapositions cannot be sensed: the result will be conventional polymer collapse of chromosomes into spherical globule…”
BackgroundInfluentialSelf-citationReal-time detection of single-molecule DNA compaction by condensin I.
Strick, T., Kawaguchi, T., & Hirano, T. (2004) · Current Biology · doi:10.1016/j.cub.2004.04.038 · Cited by 151 · cited 10×
“In those experiments, after subsequent washing away of solution-phase protein and addition of ATP, condensins were observed to reorganize ‘along’ single DNAs, driving step-wise condensation (26).”
BackgroundResultInfluentialMechanism of Chromosome Compaction and Looping by the Escherichia coli Nucleoid Protein Fis
Skoko, D., Yoo, D., Bai, H., Schnurr, B., Yan, J., McLeod, S. M., Marko, J. F., & Johnson, R. C. (2006) · Journal of Molecular Biology · doi:10.1016/j.jmb.2006.09.043 · Cited by 148 · cited 2×
“(26) experiment (see (16) for theory and (29) for experimental validation using non-specific DNA–loop-binding proteins).”
BackgroundSelf-citationSt‐Pierre, J., Douziech, M., Bazile, F., Pascariu, C. M., Bonneil, É., Sauvé, V., Ratsima, H., & D’Amours, D. (2009) · Molecular Cell · doi:10.1016/j.molcel.2009.04.013 · Cited by 145 · cited 1×
“Furthermore, experiments that observe an ATP-dependent (35) and phosphorylation-regulated (36) DNA supercoiling activity of condensin indicate that condensin is able to impose 3D constraints on the bound DNA, so as to generate positive writhe (37).”
BackgroundReal-time observation of DNA translocation by the type I restriction modification enzyme EcoR124I
Seidel, R., van Noort, J., van der Scheer, C., Bloom, J. G. P., Dekker, N., Dutta, C., Blundell, A., Robinson, T., Firman, K., & Dekker, C. (2004) · Nature Structural &Molecular Biology · doi:10.1038/nsmb816 · Cited by 125 · cited 1×
“We also note that other enzymes that extrude DNA loops are known and have been characterized, most notably type I restriction enzymes (31), and our model may prove useful for describing their self-organization.”
BackgroundMicromechanical studies of mitotic chromosomes
Marko, J. F. (2008) · Chromosome Research · doi:10.1007/s10577-008-1233-7 · Cited by 116
Self-citationMCPH1 regulates chromosome condensation and shaping as a composite modulator of condensin II
Yamashita, D., Shintomi, K., Ono, T., Gavvovidis, I., Schindler, D., Neitzel, H., Trimborn, M., & Hirano, T. (2011) · The Journal of Cell Biology · doi:10.1083/jcb.201106141 · Cited by 84 · cited 1×
“Notably, the protein MCPH1 has recently been observed to control condensin activity; its suppression leads to ‘dumpy’, over-condensed chromosomes (40).”
BackgroundDeciphering condensin action during chromosome segregation
Cuylen‐Haering, S., & Haering, C. H. (2011) · Trends in Cell Biology · doi:10.1016/j.tcb.2011.06.003 · Cited by 76 · cited 2×
“Indeed, the molecular details of how condensin binds DNA are not fully understood (28).”
BackgroundFormation of loops in DNA under tension
Sankararaman, S., & Marko, J. F. (2005) · Physical Review E · doi:10.1103/physreve.71.021911 · Cited by 69 · cited 2×
“(26) experiment (see (16) for theory and (29) for experimental validation using non-specific DNA–loop-binding proteins).”
BackgroundSelf-citationMicromechanical Studies of Mitotic Chromosomes
Poirier, M. G., & Marko, J. F. (2003) · Current topics in developmental biology/Current Topics in Developmental Biology · doi:10.1016/s0070-2153(03)01002-0 · Cited by 66
Self-citationStrukov, Y. G., Wang, Y., & Belmont, A. S. (2003) · The Journal of Cell Biology · doi:10.1083/jcb.200303098 · Cited by 60 · cited 1×
“A piece of evidence in favor of sequence-defined chromosome condensation in mammalian cells is the observation that insertions of non-eukaryote DNA into chromosomes lead to chromosomes which ‘thin’ at those locations when put under stress (39), indicating that the foreign DNA induces chromosome condensation defects.”
BackgroundMicromechanics of human mitotic chromosomes
Sun, M., Kawamura, R., & Marko, J. F. (2011) · Physical Biology · doi:10.1088/1478-3975/8/1/015003 · Cited by 35 · cited 1×
“This prediction is consistent with experiments indicating that cutting DNA alone is sufficient to entirely dissolve eukaryote metaphase chromosomes (13,42,43).”
ResultSelf-citationChromatin Boundaries, Insulators, and Long-Range Interactions in the NucleusPreprint
Giles, K. E., Gowher, H., Ghirlando, R., Jin, C., & Felsenfeld, G. (2010) · Cold Spring Harbor Symposia on Quantitative Biology · doi:10.1101/sqb.2010.75.006 · Cited by 34 · cited 1×
“Detailed characterizations of specific cases of in cis gene regulation also indicate that chromosomes have a well-defined ‘loop domain’ organization, with specific but distant sequences along the same chromosome positioned to be near one another (11).”
BackgroundMarko, J. (2011) · Journal of statistical physics · doi:10.1007/s10955-011-0172-4 · Cited by 21
Self-citationExact solution of the discrete (1+1)-dimensional RSOS model with field and surface interactions
Owczarek, A. L., & Prellberg, T. (2009) · Journal of Physics A Mathematical and Theoretical · doi:10.1088/1751-8113/42/49/495003 · Cited by 8 · cited 1×
“Equation (5) is a ‘restricted solid-on-solid’ model used to describe interface fluctuations, some properties of which can be solved exactly (33).”
BackgroundLinking topology of large DNA molecules
Marko, J. F. (2010) · Physica A Statistical Mechanics and its Applications · doi:10.1016/j.physa.2010.01.003 · Cited by 6
Self-citation
Research works printed but not linked: 2
- 2009, PHYS A, 389, 2997
- 1999, Cell, 98, 239:248
Cited by
Sorted by citations
Formation of chromosomal domains by loop extrusion
Fudenberg, G., Imakaev, M., Lu, C., Goloborodko, A., Abdennur, N., & Mirny, L. A. (2016) · Cell Reports · doi:10.1016/j.celrep.2016.04.085 · Cited by 2,003
Cohesin Loss Eliminates All Loop Domains
Rao, S. S. P., Huang, S.-C., Glenn St Hilaire, B., Engreitz, J. M., Perez, E. M., Kieffer-Kwon, K.-R., Sanborn, A. L., Johnstone, S. E., Bascom, G. D., Bochkov, I. D., et al. (2017) · Cell · doi:10.1016/j.cell.2017.09.026 · Cited by 1,883
“We (Sanborn et al., 2015) and others (Alipour and Marko, 2012; Fudenberg et al., 2016; Nasmyth, 2001) have hypothesized that the underlying physical process is the formation of loops by extrusion.”
BackgroundSanborn, A. L., Rao, S. S. P., Huang, S.-C., Durand, N. C., Huntley, M. H., Jewett, A. I., Bochkov, I. D., Chinnappan, D., Cutkosky, A., Li, J., et al. (2015) · Proceedings of the National Academy of Sciences · doi:10.1073/pnas.1518552112 · Cited by 1,730
Organizational principles of 3D genome architecture
Rowley, M. J., & Corces, V. G. (2018) · Nature Reviews Genetics · doi:10.1038/s41576-018-0060-8 · Cited by 1,171
Organization of the mitotic chromosome
Naumova, N., Imakaev, M., Fudenberg, G., Zhan, Y., Lajoie, B. R., Mirny, L. A., & Dekker, J. (2013) · Science · doi:10.1126/science.1236083 · Cited by 976
Metadata
- Authors
- Alipour, E., & Marko, J. F.
- Affiliations
- UConn Health (US)
- Northwestern University (US)
- Corresponding author
- Alipour, E.
- Marko, J. F.
- Venue
- Nucleic Acids Research
- Publisher
- Oxford University Press (OUP)
- Published
- 2012-10-15
- Volume
- 40
- Issue
- 22
- Pages
- 11202-11212
- ISSN
- 0305-1048 (ISSN-L)
- 1362-4962
- PMC
- PMC3526278
- OpenAlex
- W2100148696
- Cited by
- 540
- References
- 48
- Citations by year
- 2026: 26 · 2025: 45 · 2024: 44 · 2023: 46 · 2022: 38 · 2021: 55 · 2020: 71 · 2019: 61 · 2018: 54 · 2017: 52 · 2016: 27 · 2015: 10 · 2014: 7 · 2013: 3
- FWCI
- 2.56
- Type
- journal article
- Language
- en
- Open access
- gold
- doi.org
- Licence
- Locations
- Nucleic Acids Research (publishedVersion, cc-by-nc)
- Europe PMC (PubMed Central) (publishedVersion, cc-by-nc)
- PubMed Central (publishedVersion, cc-by-nc)
- PubMed (publishedVersion)
- HighWire Press Open Archive (submittedVersion)
- Funders
- National Science Foundation (1206868, 1022117, 0715099)
- National Institutes of Health (MCB-1022117, DMR-1206868)
- National Cancer Institute (U54CA143869)
- Division of Materials Research (DMR-1206868)
- Topics
- Life Sciences › Biochemistry, Genetics and Molecular Biology › Molecular Biology › Genomics and Chromatin Dynamics
- Life Sciences › Biochemistry, Genetics and Molecular Biology › Molecular Biology › Diffusion and Search Dynamics
- Life Sciences › Biochemistry, Genetics and Molecular Biology › Molecular Biology › DNA Repair Mechanisms
- Keywords
- DNA loop extrusion, self-organization, molecular machines, DNA translocation, processivity, loop size distribution, chromosome compaction, type I restriction enzymes, boundary elements
- MeSH terms
- Chromosomes, Computer Simulation, DNA, Enzymes, Models, Genetic, Nucleic Acid Conformation
About these checks
Registry, retraction, Cites and statistics results are computed, not judged, with one exception: a printed reference that no index lists is read once by a model before it counts as a citation error. Claims are extracted by a model and kept only when their quote appears verbatim in the text; each cited source is then checked, with a model’s help, for whether it says what the claim relies on. Those verdicts can be wrong — read the claim’s quote and the cited source before relying on one.
Statistics and arithmetic are recomputed, not judged.
Confidence bands are shown only for fields calibrated on our annotated test set. None is calibrated yet, so no band is shown.
What counts as a claim ›How we measure confidence ›How we check this ›
Are you an author, or do you see a problem with this page? Request a review
