

The DOI matches its Crossref record; 43 of the 43 references it cites were found in a registry or an index.
How far from the SNP may the causative genes be?
Open accessAbstract
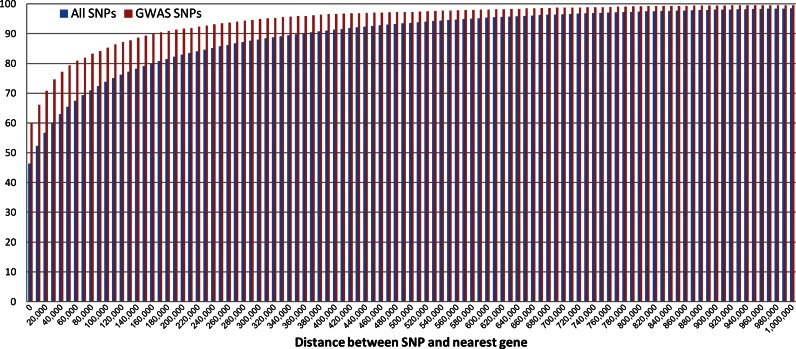
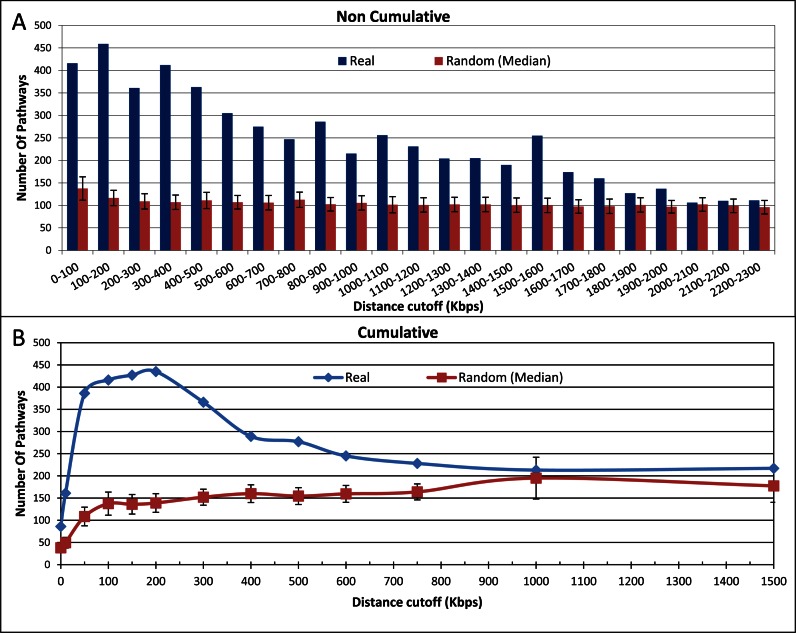
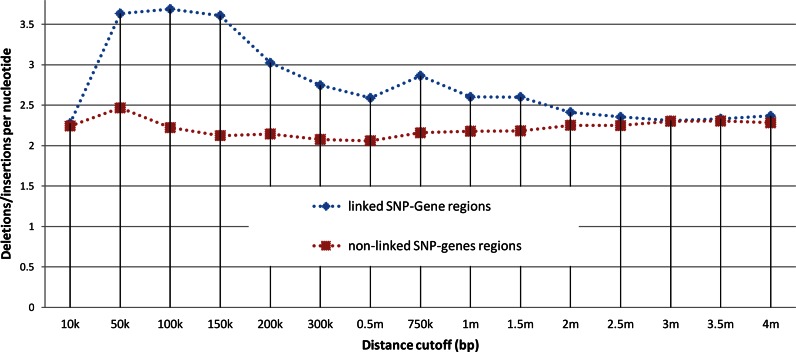
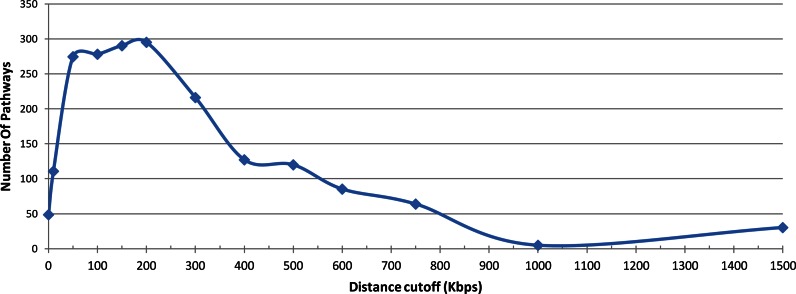
While GWAS identify many disease-associated SNPs, using them to decipher disease mechanisms is hindered by the difficulty in mapping SNPs to genes. Most SNPs are in non-coding regions and it is often hard to identify the genes they implicate. To explore how far the SNP may be from the affected genes we used a pathway-based approach. We found that affected genes are often up to 2 Mbps away from the associated SNP, and are not necessarily the closest genes to the SNP. Existing approaches for mapping SNPs to genes leave many SNPs unmapped to genes and reveal only 86 significant phenotype-pathway associations for all known GWAS hits combined. Using the pathway-based approach we propose here allows mapping of virtually all SNPs to genes and reveals 435 statistically significant phenotype-pathway associations. In search for mechanisms that may explain the relationships between SNPs and distant genes, we found that SNPs that are mapped to distant genes have significantly more large insertions/deletions around them than other SNPs, suggesting that these SNPs may sometimes be markers for large insertions/deletions that may affect large genomic regions.
Overview
The claims and statistics of this paper haven’t been checked yet.
Run the check — free, no account needed. It reads the open-access text and checks the sources it cites.
Integrity signals
Registry
Cites
Statistics
Figures
Verification
Claims the paper makes
The claims and statistics of this paper haven’t been checked yet.
Run the check — free, no account needed. It reads the open-access text and checks the sources it cites.
Claims other papers make about this one
Each is checked against this paper’s own text: does it say what the citing paper says it does?
In the citing paper
“There has been a growing appreciation in recent years that simply assigning a GWAS-identified SNP to the nearest gene in linear genomic space may lead to false associations [174].”
From Genetic architecture of Alzheimer's disease (2020) · cites this paper as [174]
Self-check
Percentages, sums and reported differences re-computed from the paper’s own numbers.
The self-check needs the paper’s full text.
Citations
Cites
Comprehensive Mapping of Long-Range Interactions Reveals Folding Principles of the Human Genome
Lieberman-Aiden, E., van Berkum, N. L., Williams, L., Imakaev, M., Ragoczy, T., Telling, A., Amit, I., Lajoie, B. R., Sabo, P. J., Dorschner, M. O., et al. (2009) · Science · doi:10.1126/science.1181369 · Cited by 8,898
dbSNP: the NCBI database of genetic variation
Sherry, S. T. (2001) · Nucleic Acids Research · doi:10.1093/nar/29.1.308 · Cited by 7,502
Hindorff, L. A., Sethupathy, P., Junkins, H. A., Ramos, E. M., Mehta, J. P., Collins, F. S., & Manolio, T. A. (2009) · Proceedings of the National Academy of Sciences · doi:10.1073/pnas.0903103106 · Cited by 4,013
The NHGRI GWAS Catalog, a curated resource of SNP-trait associations
Welter, D., MacArthur, J., Morales, J., Burdett, T., Hall, P., Junkins, H., Klemm, A., Flicek, P., Manolio, T., Hindorff, L., et al. (2014) · Nucleic Acids Research · doi:10.1093/nar/gkt1229 · Cited by 2,707
KEGG for representation and analysis of molecular networks involving diseases and drugs
Kanehisa, M., Goto, S., Furumichi, M., Tanabe, M., & Hirakawa, M. (2010) · Nucleic Acids Research · doi:10.1093/nar/gkp896 · Cited by 2,322
The Framingham Heart Study and the epidemiology of cardiovascular disease: a historical perspective
Mahmood, S. S., Levy, D., Vasan, R. S., & Wang, T. J. (2014) · The Lancet · doi:10.1016/s0140-6736(13)61752-3 · Cited by 1,622
Genetic Mapping in Human Disease
Altshuler, D., Daly, M. J., & Lander, E. S. (2008) · Science · doi:10.1126/science.1156409 · Cited by 1,452
The Database of Genomic Variants: a curated collection of structural variation in the human genome
MacDonald, J. R., Ziman, R., Yuen, R. K. C., Feuk, L., & Scherer, S. W. (2013) · Nucleic Acids Research · doi:10.1093/nar/gkt958 · Cited by 1,370
Enhancer function: new insights into the regulation of tissue-specific gene expression
Ong, C.-T., & Corces, V. G. (2011) · Nature Reviews Genetics · doi:10.1038/nrg2957 · Cited by 929
Pathway-Based Approaches for Analysis of Genomewide Association Studies
Wang, K., Li, M., & Bućan, M. (2007) · The American Journal of Human Genetics · doi:10.1086/522374 · Cited by 860
Cited by
Sorted by citations
Immune complement and coagulation dysfunction in adverse outcomes of SARS-CoV-2 infection
Ramlall, V., Thangaraj, P., Meydan, C., Foox, J., Butler, D., Kim, J., May, B., Freitas, J. K. D., Glicksberg, B. S., Mason, C. E., et al. (2020) · Nature Medicine · doi:10.1038/s41591-020-1021-2 · Cited by 356
Dapas, M., Lin, F. T. J., Nadkarni, G. N., Sisk, R., Legro, R. S., Urbanek, M., Hayes, M. G., & Dunaif, A. (2020) · PLOS Medicine · doi:10.1371/journal.pmed.1003132 · Cited by 297
Genetic variants in mRNA untranslated regions
Steri, M., Idda, M. L., Whalen, M. B., & Orrù, V. (2018) · Wiley Interdisciplinary Reviews - RNA · doi:10.1002/wrna.1474 · Cited by 209
Biophysical and Mechanistic Models for Disease-Causing Protein Variants
Stein, A., Fowler, D. M., Hartmann‐Petersen, R., & Lindorff‐Larsen, K. (2019) · Trends in Biochemical Sciences · doi:10.1016/j.tibs.2019.01.003 · Cited by 167
Liu, Y., Wang, D., He, F., Wang, J., Joshi, T., & Xu, D. H. (2019) · Frontiers in Genetics · doi:10.3389/fgene.2019.01091 · Cited by 160
Genetic architecture of Alzheimer's disease
Neuner, S. M., TCW, J., & Goate, A. M. (2020) · Neurobiology of Disease · doi:10.1016/j.nbd.2020.104976 · Cited by 126
“There has been a growing appreciation in recent years that simply assigning a GWAS-identified SNP to the nearest gene in linear genomic space may lead to false associations (Brodie et al., 2016).”
BackgroundPhenomeXcan: Mapping the genome to the phenome through the transcriptome
Pividori, M., Rajagopal, P. S., Barbeira, A., Liang, Y., Melia, O., Bastarache, L. A., Park, Y., Wen, X., & Im, H. K. (2020) · Science Advances · doi:10.1126/sciadv.aba2083 · Cited by 116
An integrative approach for building personalized gene regulatory networks for precision medicine
van der Wijst, M. G. P., de Vries, D. H., Brugge, H., Westra, H.-J., & Franke, L. (2018) · Genome Medicine · doi:10.1186/s13073-018-0608-4 · Cited by 112
Convergence between biological, behavioural and genetic determinants of obesity
Ghosh, S., & Bouchard, C. (2017) · Nature Reviews Genetics · doi:10.1038/nrg.2017.72 · Cited by 110
Larivière, S., Royer, J., Rodríguez‐Cruces, R., Paquola, C., Caligiuri, M. E., Gambardella, A., Concha, L., Keller, S. S., Cendes, F., Yasuda, C. L., et al. (2022) · Nature Communications · doi:10.1038/s41467-022-31730-5 · Cited by 109
Richardson, T. G., Hemani, G., Gaunt, T. R., Relton, C. L., & Smith, G. D. (2020) · Nature Communications · doi:10.1038/s41467-019-13921-9 · Cited by 84
Copley, T. R., Duceppe, M., & O’Donoughue, L. S. (2018) · BMC Genomics · doi:10.1186/s12864-018-4558-4 · Cited by 67
Shah, R. L., & Guggenheim, J. A. (2018) · Human Genetics · doi:10.1007/s00439-018-1942-8 · Cited by 68
Synaptic processes and immune-related pathways implicated in Tourette syndrome
Tsetsos, F., Yu, D., Sul, J. H., Huang, A. Y., Illmann, C., Osiecki, L., Darrow, S. M., Hirschtritt, M. E., Greenberg, E., Müller‐Vahl, K., et al. (2021) · Translational Psychiatry · doi:10.1038/s41398-020-01082-z · Cited by 61
Srikanth, K., Lee, S. H., Chung, K. Y., Park, J., Jang, G.-W., Park, M.-R., Kim, N. Y., Kim, T.-H., Chai, H., Park, W. C., et al. (2020) · Genes · doi:10.3390/genes11030316 · Cited by 68
The MHC in the era of next-generation sequencing: Implications for bridging structure with function
Petersdorf, E. W., & Ó’hUigín, C. (2018) · Human Immunology · doi:10.1016/j.humimm.2018.10.002 · Cited by 61
Selmoni, O. M., Rochat, E., Lecellier, G. J., Berteaux‐Lecellier, V., & Joost, S. (2020) · Evolutionary Applications · doi:10.1111/eva.12944 · Cited by 60
Campa, A., Murube, E., & Fernández, J. J. F. (2018) · Genes · doi:10.3390/genes9110518 · Cited by 54
GWAS of pod morphological and color characters in common bean
García‐Fernández, C., Campa, A., Soler‐Garzón, A., Miklas, P. N., & Fernández, J. J. F. (2021) · BMC Plant Biology · doi:10.1186/s12870-021-02967-x · Cited by 55
Lu, L., Liu, H., Wu, Y., & Yan, G. (2022) · The Crop Journal · doi:10.1016/j.cj.2022.01.005 · Cited by 51
Genome-Wide Association Analysis of the Genetic Basis for Sheath Blight Resistance in Rice
Zhang, F., Zeng, D., Zhang, C.-S., Lu, J., Chen, T.-J., Xie, J.-P., & Zhou, Y. (2019) · Rice · doi:10.1186/s12284-019-0351-5 · Cited by 46
Ahn, E. J. S., Hu, Z., Perumal, R., Prom, L. K., Odvody, G. N., Upadhyaya, H. D., & Magill, C. (2019) · PLoS ONE · doi:10.1371/journal.pone.0216671 · Cited by 44
Endocrinology Meets Metabolomics: Achievements, Pitfalls, and Challenges
Tokarz, J., Haid, M., Cecil, A., Prehn, C. P., Artati, A., Möller, G., & Adamski, J. (2017) · Trends in Endocrinology and Metabolism · doi:10.1016/j.tem.2017.07.001 · Cited by 44
Golovina, E., Fadason, T., Lints, T., Walker, C. G., Vickers, M. H., & O'Sullivan, J. M. (2021) · Scientific Reports · doi:10.1038/s41598-021-95447-z · Cited by 37
Selmoni, O. M., Lecellier, G. J., Magalon, H., Vigliola, L., Oury, N., Benzoni, F., Peignon, C., Joost, S., & Berteaux‐Lecellier, V. (2021) · Molecular Ecology · doi:10.1111/mec.15857 · Cited by 37
Miotto, Y. E., Tessele, C., Czermainski, A. B. C., Porto, D. D., Falavigna, V. D. S., Sartor, T., Cattani, A. M., Delatorre, C. A., de Alencar, S. A., Silva‐Junior, O. B., et al. (2019) · Frontiers in Plant Science · doi:10.3389/fpls.2019.00033 · Cited by 36
Turning genome-wide association study findings into opportunities for drug repositioning
Lau, A., & So, H. (2020) · Computational and Structural Biotechnology Journal · doi:10.1016/j.csbj.2020.06.015 · Cited by 37
SNPeffect: identifying functional roles of SNPs using metabolic networks
Sarkar, D., & Maranas, C. D. (2020) · The Plant Journal · doi:10.1111/tpj.14746 · Cited by 35
Rochat, E., Selmoni, O. M., & Joost, S. (2021) · Diversity and Distributions · doi:10.1111/ddi.13256 · Cited by 33
Giacopuzzi, E., Popitsch, N. P., & Taylor, J. C. (2022) · Nucleic Acids Research · doi:10.1093/nar/gkac130 · Cited by 31
Polonikov, A., Klyosova, E. Y., & Azarova, I. E. (2021) · RESEARCH RESULTS IN BIOMEDICINE · doi:10.18413/2658-6533-2020-7-1-0-2 · Cited by 32
Reynolds, T., Johnson, E. C., Huggett, S. B., Bubier, J. A., Palmer, R. H. C., Arpana Agrawal, A., Baker, E. J., & Chesler, E. J. (2020) · Neuropsychopharmacology · doi:10.1038/s41386-020-00795-5 · Cited by 32
Duruz, S., Sevane, N., Selmoni, O. M., Vajana, E., Leempoel, K., Stucki, S., Orozco‐terWengel, P., Rochat, E., Dunner, S., Bruford, M. W., et al. (2019) · Molecular Ecology Resources · doi:10.1111/1755-0998.13044 · Cited by 30
Cai, Z., Guldbrandtsen, B., Lund, M. S., & Sahana, G. (2019) · BMC Genetics · doi:10.1186/s12863-019-0717-0 · Cited by 32
Lu, L., Liu, H., Wu, Y., & Yan, G. (2020) · Frontiers in Plant Science · doi:10.3389/fpls.2020.01316 · Cited by 29
Li, J., Li, Z., Ouyang, X.-P., & He, P. (2021) · Frontiers in Cardiovascular Medicine · doi:10.3389/fcvm.2021.701279 · Cited by 28
Alzheimer’s Disease Genetics: Review of Novel Loci Associated with Disease
Tábuas‐Pereira, M., Santana, I. J., Guerreiro, R. J., & Brás, J. (2020) · Current Genetic Medicine Reports · doi:10.1007/s40142-020-00182-y · Cited by 26
Mapping genetic variants for nonsense-mediated mRNA decay regulation across human tissues
Sun, B., & Chen, L. (2023) · Genome biology · doi:10.1186/s13059-023-03004-w · Cited by 25
Genome-Wide Association Study to Identify QTL for Carcass Traits in Korean Hanwoo Cattle
Alam, M. Z., Haque, M. A., Iqbal, A., Lee, Y.-M., Ha, J. J., Jin, S., Park, B., Kim, N.-Y., Won, J. I., & Kim, J.-J. (2023) · Animals · doi:10.3390/ani13172737 · Cited by 26
Historical museum samples enable the examination of divergent and parallel evolution during invasion
Stuart, K. C., Sherwin, W. B., Austin, J. J., Melissa Bateson, B., Eens, M., Brandley, M. C., & Rollins, L. A. (2022) · Molecular Ecology · doi:10.1111/mec.16353 · Cited by 26
Large-Scale Multi-Omics Studies Provide New Insights into Blood Pressure Regulation
Kamali, Z., Keaton, J. M., Javanmard, S. H., Program, M. V., Edwards, T. L., Snieder, H., & Vaez, A. (2022) · International Journal of Molecular Sciences · doi:10.3390/ijms23147557 · Cited by 24
Gouin, N., Bertin, A., Espinosa, M. I., Snow, D. D., Ali, J. M., & Kolok, A. S. (2019) · Environmental Pollution · doi:10.1016/j.envpol.2019.113099 · Cited by 24
Kämpe, A. J., Enlund-Cerullo, M., Valkama, S. M., Holmlund-Suila, E. M., Rosendahl, J., Hauta‐alus, H., Pekkinen, M., ANDERSSON, S. M., & Mäkitie, O. (2019) · PLoS Genetics · doi:10.1371/journal.pgen.1008530 · Cited by 23
Functional SNPs in the Human Autoimmunity-Associated Locus 17q12-21
Ustiugova, A. S., Korneev, K. V., Kuprash, D. V., & Afanasyeva, M. A. (2019) · Genes · doi:10.3390/genes10020077 · Cited by 23
Genome-Wide Association Study (GWAS) for Resistance to Sclerotinia sclerotiorum in Common Bean
Campa, A., García‐Fernández, C., & Fernández, J. J. F. (2020) · Genes · doi:10.3390/genes11121496 · Cited by 22
Almeida‐Silva, F., & Venâncio, T. M. (2021) · Scientific Reports · doi:10.1038/s41598-021-03864-x · Cited by 22
Identifying high-confidence capture Hi-C interactions using CHiCANE
Holgersen, E. M., Gillespie, A., Leavy, O. C., Baxter, J. S., Zvereva, A., Muirhead, G., Johnson, N., Sipos, O., Dryden, N. H., Broome, L. R., et al. (2021) · Nature Protocols · doi:10.1038/s41596-021-00498-1 · Cited by 22
Asuri, S., McIntosh, S., Taylor, V., Rokeby, A., Kelly, J. K., Shumansky, K., Field, L. L., Yoshida, E. M., & Arbour, L. T. (2018) · Liver International · doi:10.1111/liv.13686 · Cited by 22
Chromatin landscapes and genetic risk for juvenile idiopathic arthritis
Zhu, L., Jiang, K., Webber, K., Wong, L.-P., Liu, T., Chen, Y., & Jarvis, J. N. (2017) · Arthritis Research & Therapy · doi:10.1186/s13075-017-1260-x · Cited by 21
Implicating candidate genes at GWAS signals by leveraging topologically associating domains
Way, G. P., Youngstrom, D. W., Hankenson, K. D., Greene, C. S., & Grant, S. F. A. (2017) · European Journal of Human Genetics · doi:10.1038/ejhg.2017.108 · Cited by 21
van Riemsdijk, I., Arntzen, J. W., Bucciarelli, G. M., McCartney‐Melstad, E., Rafajlović, M., Scott, P. A., Toffelmier, E. M., Shaffer, H. B., & Wielstra, B. (2023) · Heredity · doi:10.1038/s41437-023-00617-6 · Cited by 25
Germline BRCA mutation in male carriers—ripe for precision oncology?
Leao, R. R. N., Price, A. J., & Hamilton, R. J. (2017) · Prostate Cancer and Prostatic Diseases · doi:10.1038/s41391-017-0018-5 · Cited by 20
Zhang, Y., Liu, H., & Yan, G. (2021) · Molecular Breeding · doi:10.1007/s11032-020-01196-8 · Cited by 19
PhenomeXcan: Mapping the genome to the phenome through the transcriptomePreprint
Pividori, M., Rajagopal, P. S., Barbeira, A., Liang, Y., Melia, O., Bastarache, L. A., Park, Y., Wen, X., & Im, H. K. (2019) · bioRxiv (Cold Spring Harbor Laboratory) · doi:10.1101/833210 · Cited by 18
Takei, R., Cadzow, M. J., Markie, D., Bixley, M., Phipps‐Green, A. J., Major, T. J., Li, C., Choi, H. K., Li, Z., Hu, H., et al. (2020) · Journal of Human Genetics · doi:10.1038/s10038-020-0821-z · Cited by 18
Lu, L., Liu, H., Wu, Y., & Yan, G. (2022) · Plants · doi:10.3390/plants11060729 · Cited by 18
A genome-wide association study of corneal astigmatism: The CREAM Consortium.
Shah, R. L., Li, Q., Zhao, W., Tedja, M. S., Tideman, J. W. L., Khawaja, A. P., Fan, Q., Yazar, S., Williams, K. M., Verhoeven, V. J. M., et al. (2018) · PubMed Central · doi:10.7892/boris.114871 · Cited by 18
Nel, M., Mulder, N., Europa, T. A., & Heckmann, J. M. (2019) · Frontiers in Genetics · doi:10.3389/fgene.2019.00136 · Cited by 17
Halder, T., Liu, H., Chen, Y., Yan, G., & Siddique, K. H. M. (2021) · International Journal of Molecular Sciences · doi:10.3390/ijms22073579 · Cited by 17
Hariharan, P., & Dupuis, J. (2021) · Scientific Reports · doi:10.1038/s41598-021-95637-9 · Cited by 17
Kunene, L. M., Muchadeyi, F. C., Hadebe, K., Mészáros, G., Sölkner, J., Dugmore, T., & Dzomba, E. F. (2022) · Frontiers in Genetics · doi:10.3389/fgene.2022.832702 · Cited by 16
Lin, Y., Weng, Y., Fei, Z., & Grumet, R. (2024) · Horticulture Research · doi:10.1093/hr/uhae340 · Cited by 15
Gene-based association analysis identifies 190 genes affecting neuroticism
Belonogova, N. M., Zorkoltseva, I. V., Tsepilov, Y. A., & Axenovich, T. I. (2021) · Scientific Reports · doi:10.1038/s41598-021-82123-5 · Cited by 16
Farleigh, K., Vladimirova, S. A., Blair, C. N., Bracken, J. T., Koochekian, N., Schield, D. R., Card, D. C., Finger, N., Henault, J. A., Leaché, A. D., et al. (2021) · Molecular Ecology · doi:10.1111/mec.16070 · Cited by 15
Host genetic factors associated with the range limit of a European hantavirus
Saxenhofer, M., Labutin, A., White, T. A., & Heckel, G. (2021) · Molecular Ecology · doi:10.1111/mec.16211 · Cited by 15
Yan, W., Karikari, B., Chang, F., Zhao, F., Zhang, Y., Li, D., Zhao, T., & Jiang, H. (2021) · Frontiers in Genetics · doi:10.3389/fgene.2021.715529 · Cited by 14
Gendron, J., Sauty-Colace, C., Beaume, N., Cartonnet, H., Guégan, J., Ulveling, D., Pardanaud-Glavieux, C., Moszer, I., Cheval, H., & Ravassard, P. (2019) · Scientific Reports · doi:10.1038/s41598-018-37872-1 · Cited by 17
Signatures of selection in Charolais beef cattle identified by genome‐wide analysis
Jahuey‐Martínez, F. J., Parra‐Bracamonte, G. M., Sifuentes‐Rincón, A. M., & Moreno-Medina, V. R. (2019) · Journal of Animal Breeding and Genetics · doi:10.1111/jbg.12399 · Cited by 14
The broken Alzheimer’s disease genome
Roque, C. G., Phatnani, H. P., & Hengst, U. (2024) · Cell Genomics · doi:10.1016/j.xgen.2024.100555 · Cited by 13
Jiang, K., Kessler, H. A., Park, Y., Sudman, M., Thompson, S. D., & Jarvis, J. N. (2020) · PLoS ONE · doi:10.1371/journal.pone.0235857 · Cited by 13
Wang, D. X., Kaur, Y., Alyass, A., & Meyre, D. (2019) · Diabetes · doi:10.2337/db18-0986 · Cited by 13
Maciel-Guerra, A., Babaarslan, K., Baker, M., Rahman, A. S. M. Z., Hossain, M., Sadique, A., Alam, J., Uzzaman, S., Sarker, M. F. R., Sultana, N., et al. (2024) · Nature Communications · doi:10.1038/s41467-024-52238-0 · Cited by 12
Gkagkavouzis, K., Papakostas, S., Maroso, F., Karaiskou, N., Carr, A. R., Nielsen, E. E., Bargelloni, L., & Triantafyllidis, A. (2021) · Diversity · doi:10.3390/d13110563 · Cited by 12
Effects of Maternal Nutrition on Female Offspring Weight Gain and Sexual Development
Cracco, R. C., Bussiman, F. D. O., Polizel, G. H. G., Furlan, É., Garcia, N. P., Poit, D. A. S., Pugliesi, G., & Santana, M. H. D. A. (2021) · Frontiers in Genetics · doi:10.3389/fgene.2021.737382 · Cited by 12
Prospecting genomic regions associated with milk production traits in Egyptian buffalo
Abdel-Shafy, H., Awad, M. A. A., El-Regalaty, H., El‐Assal, S. E., & Abou-Bakr, S. (2020) · Journal of Dairy Research · doi:10.1017/s0022029920000953 · Cited by 12
Expression quantitative trait locus studies in the era of single-cell omics
Luo, J., Wu, X., Cheng, Y., Chen, G., Wang, J., & Song, X. (2023) · Frontiers in Genetics · doi:10.3389/fgene.2023.1182579 · Cited by 11
Baazaoui, I., Bedhiaf‐Romdhani, S., Mastrangelo, S., Lenstra, J. A., Silva, A. D., Benjelloun, B., & Ciani, E. (2024) · Frontiers in Veterinary Science · doi:10.3389/fvets.2024.1339321 · Cited by 11
Strickland, K., Räsänen, K., Kristjánsson, B. K., Phillips, J. S., Einarsson, Á., Snorradóttir, R. G., Bartrons, M., & Jónsson, Z. O. (2023) · Molecular Ecology · doi:10.1111/mec.16845 · Cited by 13
Genetic variants for head size share genes and pathways with cancer
Knol, M. J., Poot, R. A., Evans, T. E., Satizábal, C. L., Mishra, A., Sargurupremraj, M., der Auwera, S. V., Duperron, M., Jian, X., Hostettler, I. C., et al. (2024) · Cell Reports Medicine · doi:10.1016/j.xcrm.2024.101529 · Cited by 14
Timoteo, V. J., Chiang, K.-M., Yang, H., & Pan, W. (2022) · The Journal of Nutritional Biochemistry · doi:10.1016/j.jnutbio.2022.109126 · Cited by 10
Dissecting Meta-Analysis in GWAS Era: Bayesian Framework for Gene/Subnetwork-Specific Meta-Analysis
Chimusa, E. R., & Defo, J. (2022) · Frontiers in Genetics · doi:10.3389/fgene.2022.838518 · Cited by 10
Kurya, B., Mia, M. S., Liu, H., & Yan, G. (2022) · Frontiers in Plant Science · doi:10.3389/fpls.2022.842191 · Cited by 9
Wu, B., 中国水产科学院黄海水产研究所海水养殖生物育种与可持续产出全国重点实验室, 山. 青. 2., Chen, X., Hu, J., Wang, Z., Wang, Y., Xu, D.-Y., Guo, H., Shao, C., Zhou, L., et al. (2023) · 动物学研究 · doi:10.24272/j.issn.2095-8137.2023.021 · Cited by 9
A Genome-Wide Association Study Identifies Novel Risk Loci for Sarcopenia in a Taiwanese Population
Wu, S., & Chen, W. (2021) · Journal of Inflammation Research · doi:10.2147/jir.s338724 · Cited by 11
Almeida‐Silva, F., & Venâncio, T. M. (2022) · in silico Plants · doi:10.1093/insilicoplants/diac018 · Cited by 9
Lert-itthiporn, W., Suktitipat, B., Grove, H., Sakuntabhai, A., Malasit, P., Tangthawornchaikul, N., Matsuda, F., & Suriyaphol, P. (2018) · BMC Medical Genetics · doi:10.1186/s12881-018-0534-8 · Cited by 8
Kaur, Y., Wang, D. X., Liu, H., & Meyre, D. (2018) · Obesity Reviews · doi:10.1111/obr.12806 · Cited by 10
11β-Hydroxylase (CYP11B1) gene variants and new-onset depression in later life
Ancelin, M., Norton, J. L., Ritchie, K. A., Chaudieu, I., & Ryan, J. L. (2021) · Journal of Psychiatry and Neuroscience · doi:10.1503/jpn.190177 · Cited by 10
New Technologies to Study Functional Genomics of Age-Related Macular Degeneration
Nguyen, T., Urrutia-Cabrera, D., Liou, R. H.-C., Luu, C. D., Guymer, R. H., & Wong, R. C. B. (2021) · Frontiers in Cell and Developmental Biology · doi:10.3389/fcell.2020.604220 · Cited by 9
Identification of healthspan-promoting genes in Caenorhabditis elegans based on a human GWAS study
Saul, N., Dhondt, I., Kuokkanen, M., Perola, M., Verschuuren, C., Wouters, B., von Chrzanowski, H., Vos, W. H. D., Temmerman, L., Luyten, W. H. M. L., et al. (2022) · Biogerontology · doi:10.1007/s10522-022-09969-8 · Cited by 11
Crinzi, E. A., Haley, E. K., Poppenberg, K. E., Jiang, K., Tutino, V. M., & Jarvis, J. N. (2022) · Frontiers in Immunology · doi:10.3389/fimmu.2022.913555 · Cited by 9
Cai, Z., Guldbrandtsen, B., Lund, M. S., & Sahana, G. (2018) · BMC Genetics · doi:10.1186/s12863-018-0620-0 · Cited by 10
RetractedCRISPR/Cas9 genome editing demonstrates functionality of the autoimmunity-associated SNP rs12946510
Ustiugova, A. S., Dvorianinova, E. M., Melnikova, N. V., Dmitriev, A. A., Kuprash, D. V., & Afanasyeva, M. A. (2022) · Biochimica et Biophysica Acta (BBA) - Molecular Basis of Disease · doi:10.1016/j.bbadis.2022.166599 · Cited by 8
GWAS and Beyond: Using Omics Approaches to Interpret SNP Associations
Chen, H., Petty, L. E., Bush, W. S., Naj, A. C., & Below, J. E. (2019) · Current Genetic Medicine Reports · doi:10.1007/s40142-019-0159-z · Cited by 8
Tian, H., Xu, W., Wen, L., Tang, L., Zhang, X., Song, T., Yang, C., & Huang, P. (2022) · Frontiers in Genetics · doi:10.3389/fgene.2022.893669 · Cited by 8
Moulistanos, A., Nikolaou, T., Sismanoglou, S., Gkagkavouzis, K., Karaiskou, N., Antonopoulou, E., Triantafyllidis, A., & Papakostas, S. (2023) · Ecology and Evolution · doi:10.1002/ece3.10727 · Cited by 6
Ramlall, V., Thangara, P. M., Tatonetti, N. P., & Shapira, S. D. (2020) · doi:10.21203/rs.3.rs-26451/v1 · Cited by 8
Computational analysis of five neurodegenerative diseases reveals shared and specific genetic loci
Maselli, F., D’Antona, S., Utichi, M., Arnaudi, M., Castiglioni, I., Porro, D., Papaleo, E., Gandellini, P., & Cava, C. (2023) · Computational and Structural Biotechnology Journal · doi:10.1016/j.csbj.2023.10.031 · Cited by 7
Mize, T. J., & Evans, L. M. (2022) · European Journal of Human Genetics · doi:10.1038/s41431-022-01244-1 · Cited by 6
Korbolina, E. E., Bryzgalov, L. O., Устроханова, Д. З., Postovalov, S. N., Poverin, D. V., Damarov, I. S., & Merkulova, T. I. (2021) · International Journal of Molecular Sciences · doi:10.3390/ijms22147240 · Cited by 7
Metadata
- Authors
- Brodie, A., Azaria, J. R., & Ofran, Y.
- Affiliations
- Bar-Ilan University (IL)
- Corresponding author
- Ofran, Yanay
- Venue
- Nucleic Acids Research
- Publisher
- Oxford University Press (OUP)
- Published
- 2016-06-06
- Volume
- 44
- Issue
- 13
- Pages
- 6046-6054
- ISSN
- 0305-1048 (ISSN-L)
- 1362-4962
- PMC
- PMC5291268
- OpenAlex
- W2411890015
- Cited by
- 172
- References
- 43
- Citations by year
- 2026: 14 · 2025: 14 · 2024: 10 · 2023: 18 · 2022: 26 · 2021: 25 · 2020: 21 · 2019: 23 · 2018: 15 · 2017: 5 · 2016: 1
- FWCI
- 11.85
- Type
- journal article
- Language
- en
- Open access
- gold
- doi.org
- Licence
- Locations
- Nucleic Acids Research (publishedVersion, cc-by-nc)
- PubMed Central (publishedVersion, cc-by-nc)
- PubMed (publishedVersion)
- HighWire Press Open Archive (submittedVersion)
- Topics
- Life Sciences › Biochemistry, Genetics and Molecular Biology › Genetics › Genetic Associations and Epidemiology
- Life Sciences › Biochemistry, Genetics and Molecular Biology › Molecular Biology › Bioinformatics and Genomic Networks
- Life Sciences › Biochemistry, Genetics and Molecular Biology › Genetics › Genetic Mapping and Diversity in Plants and Animals
- Keywords
- single nucleotide polymorphisms, disease-associated SNPs, non-coding SNPs, indels, structural variants, disease mechanisms, genetic distance
- MeSH terms
- Genotype, Humans, Phenotype, Linkage Disequilibrium, Genetic Predisposition to Disease, Polymorphism, Single Nucleotide, INDEL Mutation, Genome-Wide Association Study, Genetic Association Studies
About these checks
Registry, retraction, Cites and statistics results are computed, not judged, with one exception: a printed reference that no index lists is read once by a model before it counts as a citation error. Claims are extracted by a model and kept only when their quote appears verbatim in the text; each cited source is then checked, with a model’s help, for whether it says what the claim relies on. Those verdicts can be wrong — read the claim’s quote and the cited source before relying on one.
Statistics and arithmetic are recomputed, not judged.
Confidence bands are shown only for fields calibrated on our annotated test set. None is calibrated yet, so no band is shown.
What counts as a claim ›How we measure confidence ›How we check this ›
Are you an author, or do you see a problem with this page? Request a review
