Cited by 190

The DOI matches its Crossref record; 3 of the 3 references it cites were found in a registry or an index.

TLR4-induced NF-κB and MAPK signaling regulate the IL-6 mRNA stabilizing protein Arid5a

Nyati, Kishan K., Masuda, Kazuya, Zaman, Mohammad Mahabub-Uz, Dubey, Praveen K., Millrine, David, Chalise, Jaya P., Higa, Mitsuru, Li, Songling, Standley, Daron M., Saito, Kazunobu, Hanieh, Hamza, Kishimoto, Tadamitsu·2017·Nucleic Acids Research

Overview

The claims and statistics of this paper haven’t been checked yet.

Run the check — free, no account needed. It reads the open-access text and checks the sources it cites.

A few free checks a day · papers already verified open instantly · results are public

Integrity signals

Registry

Crossref · 10.1093/nar/gkx064

Cites

3 of 3 references verified0 citation errors · 0 not checkable

Statistics

Figures

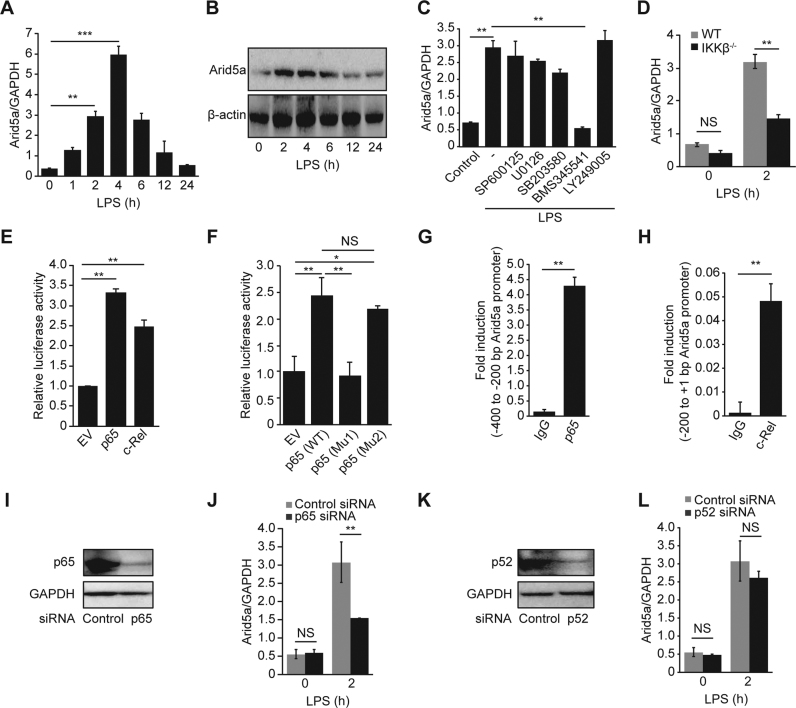
Figure 1. NF-κB induces the expression of Arid5a by binding to its promoter in response to lipopolysaccharide (LPS). (A and B) Expression of Arid5a mRNA and protein in mouse peritoneal macrophages stimulated for 0–24 h with LPS (1 μg/ml). (C) Expression of Arid5a mRNA macrophages that were pretreated with the indicated inhibitors (10 μM) or DMSO (control) for 30 min and then stimulated with LPS for 2 h. (D) Arid5a mRNA expression in the control and IKKβ-deficient MEFs after stimulation with LPS (10 μg/ml). (E and F) HEK293T cells were transfected with a pGL3-luciferase vector encoding an Arid5a promoter (−2000 bp upstream of the TSS) or a pGL3 empty vector. Both were transfected with an empty vector (control) or with expression vectors of p65 or c-Rel (E) or p65 mutants (Mu1 and Mu2) (F). p65 Mu1 and p65 Mu2 refer to the K310R/K314R/K315R and S536A mutants, respectively. Luciferase activity was determined 24 h after transfection and normalized to the activity induced by the pGL3-empty vector. The values are shown relative to those after transfection with the empty vector. (G and H) Peritoneal macrophages were stimulated using LPS for 2 h, and ChIP assays were then performed using anti-p65, anti-c-Rel, and anti-IgG (negative control) antibodies. (I) Immunoblot assays of p65 expression in MEF cells transfected with 20 nM control or p65 siRNA. (J) Arid5a mRNA expression in the control and p65 knockdown MEFs after stimulation with LPS (10 μg/ml). (K) Immunoblot assays of p52 expression in MEF cells transfected with 20 nM control or p52 siRNA. (L) Arid5a mRNA expression in the control and p52 knockdown MEFs after stimulation with LPS (10 μg/ml). All data show the mean ± SD of three independent experiments. Error bars indicate the mean ± SD. NS, not significant; *P < 0.05; **P < 0.01; ***P < 0.001.
Figure 1. NF-κB induces the expression of Arid5a by binding to its promoter in response to lipopolysaccharide (LPS). (A and B) Expression of Arid5a mRNA and protein in mouse peritoneal macrophages stimulated for 0–24 h with LPS (1 μg/ml). (C) Expression of Arid5a mRNA macrophages that were pretreated with the indicated inhibitors (10 μM) or DMSO (control) for 30 min and then stimulated with LPS for 2 h. (D) Arid5a mRNA expression in the control and IKKβ-deficient MEFs after stimulation with LPS (10 μg/ml). (E and F) HEK293T cells were transfected with a pGL3-luciferase vector encoding an Arid5a promoter (−2000 bp upstream of the TSS) or a pGL3 empty vector. Both were transfected with an empty vector (control) or with expression vectors of p65 or c-Rel (E) or p65 mutants (Mu1 and Mu2) (F). p65 Mu1 and p65 Mu2 refer to the K310R/K314R/K315R and S536A mutants, respectively. Luciferase activity was determined 24 h after transfection and normalized to the activity induced by the pGL3-empty vector. The values are shown relative to those after transfection with the empty vector. (G and H) Peritoneal macrophages were stimulated using LPS for 2 h, and ChIP assays were then performed using anti-p65, anti-c-Rel, and anti-IgG (negative control) antibodies. (I) Immunoblot assays of p65 expression in MEF cells transfected with 20 nM control or p65 siRNA. (J) Arid5a mRNA expression in the control and p65 knockdown MEFs after stimulation with LPS (10 μg/ml). (K) Immunoblot assays of p52 expression in MEF cells transfected with 20 nM control or p52 siRNA. (L) Arid5a mRNA expression in the control and p52 knockdown MEFs after stimulation with LPS (10 μg/ml). All data show the mean ± SD of three independent experiments. Error bars indicate the mean ± SD. NS, not significant; *P < 0.05; **P < 0.01; ***P < 0.001.CC BY-NC · PubMed Central
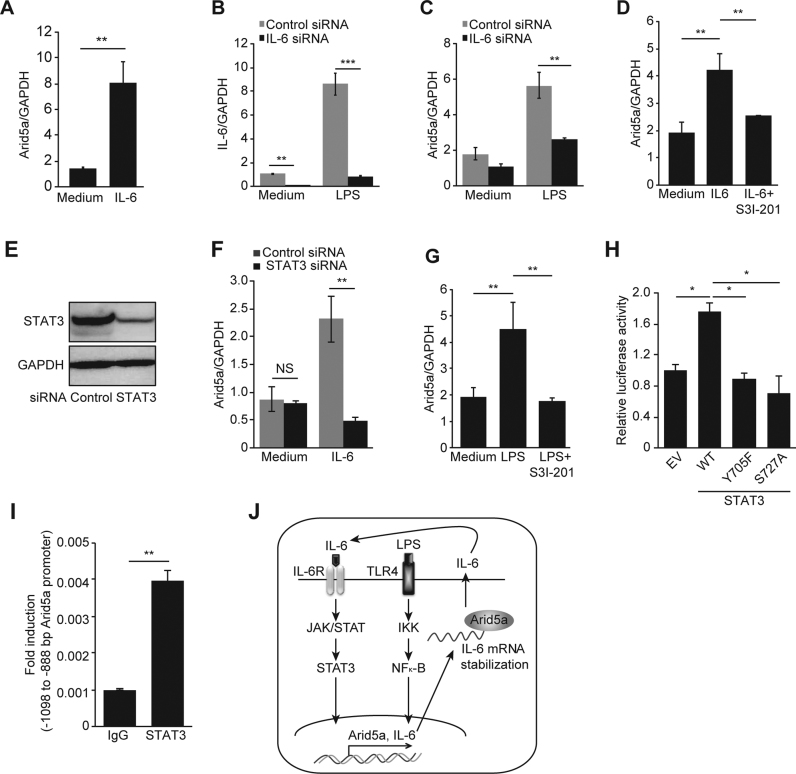
Figure 2. IL-6 stimulates the expression of Arid5a via STAT3 in response to LPS. (A) Arid5a mRNA expression was measured using qPCR in MEFs stimulated with IL-6 (35 ng/ml) for 1 h. (B) IL-6 mRNA expression was knocked down in MEF cells using an IL-6 siRNA followed by stimulation with LPS (10 μg/ml). (C) Expression of Arid5a in LPS-stimulated knockdown MEF cells (10 μg/ml) for 1 h. (D) Expression of Arid5a mRNA in MEFs that were pretreated with a Stat3 inhibitor (50 μM) or DMSO (control) for 45 min and then stimulated with IL-6 (35 ng/ml) for 1 h. (E) Immunoblot assays of Stat3 expression in MEFs transfected with 20 nM control or Stat3 siRNA. (F) Arid5a mRNA expression in the control and Stat3 knockdown MEFs after stimulation with IL-6 (35 ng/ml). (G) Expression of Arid5a mRNA in MEFs that were pretreated with a Stat3 inhibitor (50 μM) or DMSO (control) for 45 min and then stimulated with LPS (10 μg/mL) for 1 h. (H) Luciferase activity of the Arid5a promoter was determined as described above in 1E in combination with the empty vector or WT Stat3 and its phosphorylation site mutants (Y705F and S727A) expression vectors. (I) ChIP assay was performed as described above in 1G using LPS stimulated-macrophages, and chromatins were immunoprecipitated with anti-Stat3 antibody and anti-IgG (negative control). (J) Schematic diagram illustrating the mechanism proposed in this study, in which the TLR4/IKK/NF-κB and IL-6/STAT3 signaling pathways transcriptionally regulate Arid5a gene expression. During LPS signaling, NF-κB upregulates Arid5a, which in turn increases the production of IL-6 by stabilizing its mRNA. IL-6 further stimulates the expression of Arid5a and IL-6 via a positive feedback loop. The values are shown relative to normalized levels after cells were transfected using an empty vector. All data are shown the mean ± SD of three independent experiments. Error bars indicate the mean ± SD. NS, not significant; *P < 0.05; **P < 0.01; ***P < 0.001.
Figure 2. IL-6 stimulates the expression of Arid5a via STAT3 in response to LPS. (A) Arid5a mRNA expression was measured using qPCR in MEFs stimulated with IL-6 (35 ng/ml) for 1 h. (B) IL-6 mRNA expression was knocked down in MEF cells using an IL-6 siRNA followed by stimulation with LPS (10 μg/ml). (C) Expression of Arid5a in LPS-stimulated knockdown MEF cells (10 μg/ml) for 1 h. (D) Expression of Arid5a mRNA in MEFs that were pretreated with a Stat3 inhibitor (50 μM) or DMSO (control) for 45 min and then stimulated with IL-6 (35 ng/ml) for 1 h. (E) Immunoblot assays of Stat3 expression in MEFs transfected with 20 nM control or Stat3 siRNA. (F) Arid5a mRNA expression in the control and Stat3 knockdown MEFs after stimulation with IL-6 (35 ng/ml). (G) Expression of Arid5a mRNA in MEFs that were pretreated with a Stat3 inhibitor (50 μM) or DMSO (control) for 45 min and then stimulated with LPS (10 μg/mL) for 1 h. (H) Luciferase activity of the Arid5a promoter was determined as described above in 1E in combination with the empty vector or WT Stat3 and its phosphorylation site mutants (Y705F and S727A) expression vectors. (I) ChIP assay was performed as described above in 1G using LPS stimulated-macrophages, and chromatins were immunoprecipitated with anti-Stat3 antibody and anti-IgG (negative control). (J) Schematic diagram illustrating the mechanism proposed in this study, in which the TLR4/IKK/NF-κB and IL-6/STAT3 signaling pathways transcriptionally regulate Arid5a gene expression. During LPS signaling, NF-κB upregulates Arid5a, which in turn increases the production of IL-6 by stabilizing its mRNA. IL-6 further stimulates the expression of Arid5a and IL-6 via a positive feedback loop. The values are shown relative to normalized levels after cells were transfected using an empty vector. All data are shown the mean ± SD of three independent experiments. Error bars indicate the mean ± SD. NS, not significant; *P < 0.05; **P < 0.01; ***P < 0.001.CC BY-NC · PubMed Central
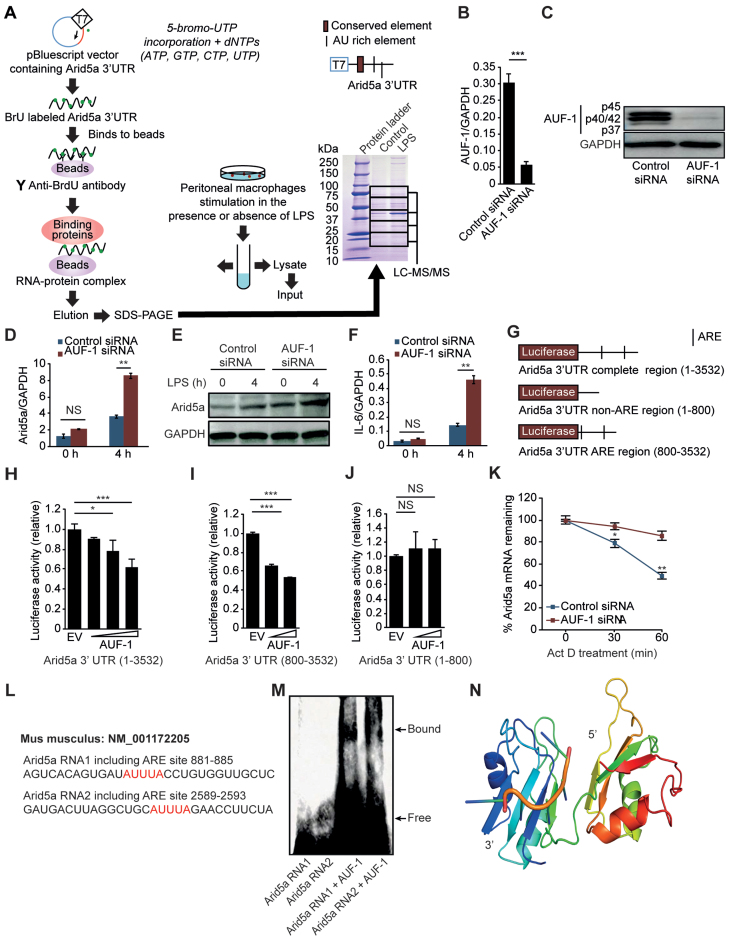
Figure 3. AUF-1 destabilizes the Arid5a mRNA by recognizing the Arid5a 3΄ UTR. (A) Identification of the RNA-binding protein AUF-1 on the Arid5a 3΄ UTR. Peritoneal macrophages were stimulated with or without LPS (1 μg/ml) for 4 h. Whole-cell lysates were then obtained and mixed with binding protein G beads in solution with the Arid5a 3΄ UTR (containing BrdU), and the eluted buffer was then subjected to SDS-PAGE. The gel that was run using the complex containing the Arid5a 3΄ UTR and beads was stained using CBB after SDS-PAGE and then separated into five compartments that were independently analyzed using LC-MS/MS. (B and C) Analysis of AUF-1 mRNA and protein levels in MEF cells that were transfected with control siRNA or AUF-1 siRNA. (D–F) Arid5a mRNA (D) and protein expression (E) and IL-6 mRNA expression (F) in the control and AUF-1 knockdown MEF cells at 4 h after stimulation with LPS (5 μg/ml). (G) Diagram of the region of the pGL3 vector that encodes the Arid5a 3΄ UTR (1–3532), Arid5a 3΄ UTR (1-800), or Arid5a 3΄ UTR (800–3532). The black bar shows the locations of AU-rich elements (AREs). (H–J) The luciferase activities of each of the vectors that encodes one of three different fragments of the Arid5a 3΄ UTR are shown in G. The results were obtained using MEF cells that were transfected for 48 h with an AUF-1 expression vector or an empty vector. (K) Quantitative real-time PCR analysis of the Arid5a mRNA in the control and AUF-1 knockdown MEFs that were stimulated for 2 h with LPS (3 μg/ml). The cells were then treated for 0–60 min with Actinomycin D. (L) A predicted ARE region in the Arid5a 3΄ UTR is shown in red. (M) Electrophoretic mobility shift assay (EMSA) demonstrating the interaction between the AUF-1 recombinant protein and 3΄-biotinylated fragments with the Arid5a 3΄ UTR, as shown in L. (N) Putative binding mode of mouse AUF-1 protein with the homology model of AUF-1 shown as a cartoon with rainbow colors from N (blue) and to C (red). The AUUUA RNA fragment from PDB entry 1g2e is shown as an orange cartoon with light green residues in stick representation and with the flexibly docked RNA models shown as orange backbone traces. All data are shown as the mean ± SD of three independent experiments. Error bars indicate the mean ± SD. *P < 0.05; **P < 0.01; ***P < 0.001.
Figure 3. AUF-1 destabilizes the Arid5a mRNA by recognizing the Arid5a 3΄ UTR. (A) Identification of the RNA-binding protein AUF-1 on the Arid5a 3΄ UTR. Peritoneal macrophages were stimulated with or without LPS (1 μg/ml) for 4 h. Whole-cell lysates were then obtained and mixed with binding protein G beads in solution with the Arid5a 3΄ UTR (containing BrdU), and the eluted buffer was then subjected to SDS-PAGE. The gel that was run using the complex containing the Arid5a 3΄ UTR and beads was stained using CBB after SDS-PAGE and then separated into five compartments that were independently analyzed using LC-MS/MS. (B and C) Analysis of AUF-1 mRNA and protein levels in MEF cells that were transfected with control siRNA or AUF-1 siRNA. (D–F) Arid5a mRNA (D) and protein expression (E) and IL-6 mRNA expression (F) in the control and AUF-1 knockdown MEF cells at 4 h after stimulation with LPS (5 μg/ml). (G) Diagram of the region of the pGL3 vector that encodes the Arid5a 3΄ UTR (1–3532), Arid5a 3΄ UTR (1-800), or Arid5a 3΄ UTR (800–3532). The black bar shows the locations of AU-rich elements (AREs). (H–J) The luciferase activities of each of the vectors that encodes one of three different fragments of the Arid5a 3΄ UTR are shown in G. The results were obtained using MEF cells that were transfected for 48 h with an AUF-1 expression vector or an empty vector. (K) Quantitative real-time PCR analysis of the Arid5a mRNA in the control and AUF-1 knockdown MEFs that were stimulated for 2 h with LPS (3 μg/ml). The cells were then treated for 0–60 min with Actinomycin D. (L) A predicted ARE region in the Arid5a 3΄ UTR is shown in red. (M) Electrophoretic mobility shift assay (EMSA) demonstrating the interaction between the AUF-1 recombinant protein and 3΄-biotinylated fragments with the Arid5a 3΄ UTR, as shown in L. (N) Putative binding mode of mouse AUF-1 protein with the homology model of AUF-1 shown as a cartoon with rainbow colors from N (blue) and to C (red). The AUUUA RNA fragment from PDB entry 1g2e is shown as an orange cartoon with light green residues in stick representation and with the flexibly docked RNA models shown as orange backbone traces. All data are shown as the mean ± SD of three independent experiments. Error bars indicate the mean ± SD. *P < 0.05; **P < 0.01; ***P < 0.001.CC BY-NC · PubMed Central
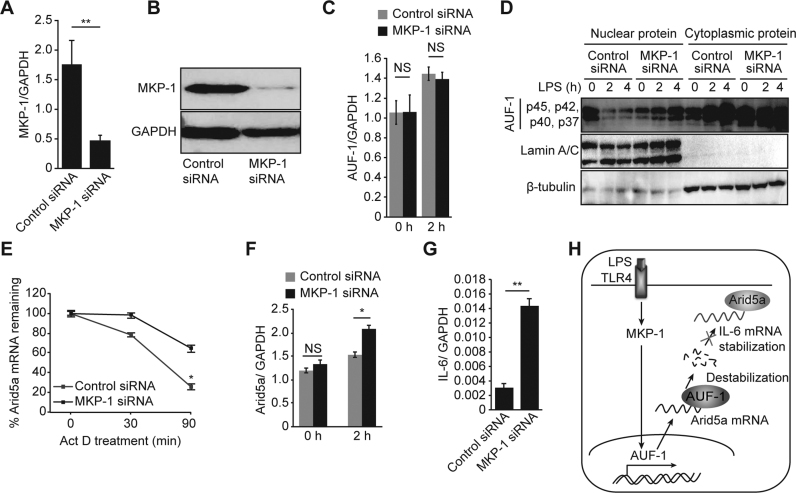
Figure 4. MKP-1 signaling regulates Arid5a mRNA stability by inducing the translocalization of AUF-1 from the nucleus to the cytoplasm. (A and B) Analysis of MKP-1 mRNA and protein levels in MEF cells that were transfected with control siRNA and MKP-1 siRNA. (C) Quantitative real-time PCR analysis of AUF-1 mRNA levels in control and MKP-1 knockdown cells that were stimulated with LPS (3 μg/ml). (D) AUF-1 (p45, p42, p40, p37) levels in the cytoplasm versus the nucleus in control and MKP-1 knockdown MEF cells that were stimulated using LPS for 0–4 h. β-tubulin and Lamin A/C were used as the loading controls for cytoplasmic proteins and nuclear proteins, respectively. (E) Quantitative real-time PCR analysis of mRNA levels of Arid5a in control and MKP-1 knockdown MEFs that were stimulated with LPS and then treated with Actinomycin D for 0–90 min. (F and G) Quantitative real-time PCR analysis of mRNA levels of Arid5a and IL-6 in control and MKP-1 knockdown MEFs that were stimulated with LPS. (H) Schematic diagram illustrating the post-transcriptional regulation of Arid5a mRNA. LPS signaling induces MKP-1, which in turn signals AUF-1 to translocate from the nucleus to the cytoplasm. In the cytoplasm, AUF-1 binds to AU-rich elements on the Arid5a 3΄ UTR to destabilize the Arid5a mRNA. This results in the inhibition of the stabilization of the IL-6 mRNA. All data are shown as the mean ± SD of three independent experiments. N.S., not significant. *P < 0.05; **P < 0.01.
Figure 4. MKP-1 signaling regulates Arid5a mRNA stability by inducing the translocalization of AUF-1 from the nucleus to the cytoplasm. (A and B) Analysis of MKP-1 mRNA and protein levels in MEF cells that were transfected with control siRNA and MKP-1 siRNA. (C) Quantitative real-time PCR analysis of AUF-1 mRNA levels in control and MKP-1 knockdown cells that were stimulated with LPS (3 μg/ml). (D) AUF-1 (p45, p42, p40, p37) levels in the cytoplasm versus the nucleus in control and MKP-1 knockdown MEF cells that were stimulated using LPS for 0–4 h. β-tubulin and Lamin A/C were used as the loading controls for cytoplasmic proteins and nuclear proteins, respectively. (E) Quantitative real-time PCR analysis of mRNA levels of Arid5a in control and MKP-1 knockdown MEFs that were stimulated with LPS and then treated with Actinomycin D for 0–90 min. (F and G) Quantitative real-time PCR analysis of mRNA levels of Arid5a and IL-6 in control and MKP-1 knockdown MEFs that were stimulated with LPS. (H) Schematic diagram illustrating the post-transcriptional regulation of Arid5a mRNA. LPS signaling induces MKP-1, which in turn signals AUF-1 to translocate from the nucleus to the cytoplasm. In the cytoplasm, AUF-1 binds to AU-rich elements on the Arid5a 3΄ UTR to destabilize the Arid5a mRNA. This results in the inhibition of the stabilization of the IL-6 mRNA. All data are shown as the mean ± SD of three independent experiments. N.S., not significant. *P < 0.05; **P < 0.01.CC BY-NC · PubMed Central
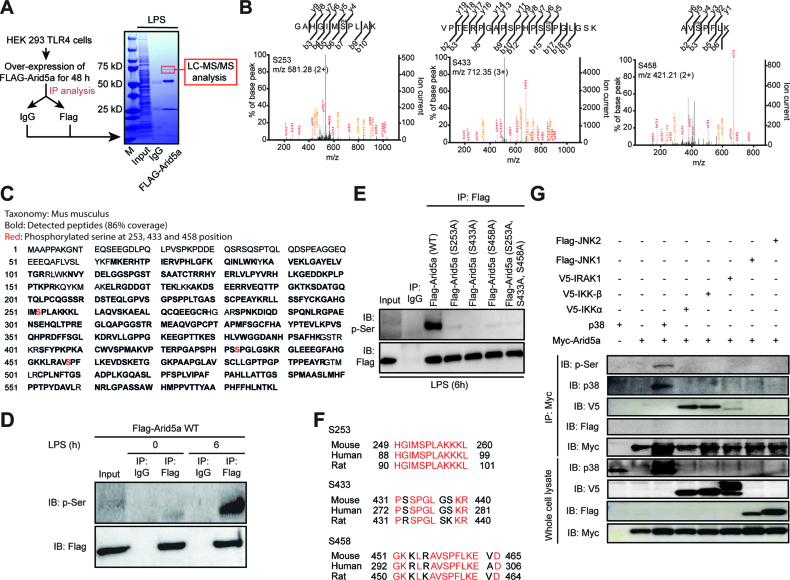
Figure 5. P38 MAPK is essential for Arid5a phosphorylation. (A) Identification of unique phosphorylation sites in the Arid5a protein. HEK293TLR4 cells overexpressing a Flag-Arid5a expression vector (2 μg) for 48 h were then stimulated with LPS (1 μg/ml) for 0 or 6 h. Whole-cell lysates were equally divided and then immunoprecipitated with normal IgG and anti-Flag antibodies in the presence of a phosphatase inhibitor. They were then mixed with protein G beads and eluted. The elution buffers were subjected to SDS-PAGE. The gel was stained using CBB, and the Arid5a region was cut from the gel for analysis using LC-MS/MS. (B) The calculated target ions for serine 253 (left panel), serine 433 (middle panel) and serine 458 (right panel) are shown. (C) The peptides (bold) corresponding to the mouse Arid5a protein were detected. The MS/MS spectra were analyzed using a Mascot Server (Matrix Science). The positions of the phosphorylation sites (red color) in the mouse Arid5a protein (590 aa) were analyzed using mass spectrometry. (D and E) Immunoblot analysis of phosphorylated Arid5a in HEK293TLR4 cells that were transfected with WT and S253A, S433A and S458A-mutant Flag-Arid5a and then stimulated for 0 or 6 h with LPS. The mixtures were then immunoprecipitated to obtain the proteins of interest (Arid5a and its mutant form) from the lysates using anti-Flag and anti-normal IgG and an immunoblot analysis of phosphoserine (with anti-p-Ser) and Arid5a (with anti-Flag). (F) Alignment of phosphorylation sites in the Arid5a protein between humans, mice and rats. The region shown in red indicates the conserved amino acids. (G) Immunoblot analysis of the phosphorylation of Arid5a in HEK293TLR4 cells after it was allowed to interact with several kinases following transfection with WT Myc-Arid5a, V5-IKKα, V5-IKKβ, V5-IRAK1, p38, Flag-JNK-1 and Flag-JNK-2 expression vectors. The cell lysates were prepared and immunoprecipitated to obtain the Arid5a protein using anti-Myc antibodies. This was followed by an immunoblot analysis of Arid5a (with anti-Myc antibodies), p38 (with anti-p38 antibodies), IKKα/β/IRAK1 (with anti-v5 antibodies), JNK-1/2 (with anti-Flag antibodies) and phosphoserine (with anti-p-Ser antibodies). Below, immunoblots of whole cell lysates that were treated with anti-v5, anti-p38, anti-Flag or anti-Myc antibodies. The data are representative of two–three independent experiments.
Figure 5. P38 MAPK is essential for Arid5a phosphorylation. (A) Identification of unique phosphorylation sites in the Arid5a protein. HEK293TLR4 cells overexpressing a Flag-Arid5a expression vector (2 μg) for 48 h were then stimulated with LPS (1 μg/ml) for 0 or 6 h. Whole-cell lysates were equally divided and then immunoprecipitated with normal IgG and anti-Flag antibodies in the presence of a phosphatase inhibitor. They were then mixed with protein G beads and eluted. The elution buffers were subjected to SDS-PAGE. The gel was stained using CBB, and the Arid5a region was cut from the gel for analysis using LC-MS/MS. (B) The calculated target ions for serine 253 (left panel), serine 433 (middle panel) and serine 458 (right panel) are shown. (C) The peptides (bold) corresponding to the mouse Arid5a protein were detected. The MS/MS spectra were analyzed using a Mascot Server (Matrix Science). The positions of the phosphorylation sites (red color) in the mouse Arid5a protein (590 aa) were analyzed using mass spectrometry. (D and E) Immunoblot analysis of phosphorylated Arid5a in HEK293TLR4 cells that were transfected with WT and S253A, S433A and S458A-mutant Flag-Arid5a and then stimulated for 0 or 6 h with LPS. The mixtures were then immunoprecipitated to obtain the proteins of interest (Arid5a and its mutant form) from the lysates using anti-Flag and anti-normal IgG and an immunoblot analysis of phosphoserine (with anti-p-Ser) and Arid5a (with anti-Flag). (F) Alignment of phosphorylation sites in the Arid5a protein between humans, mice and rats. The region shown in red indicates the conserved amino acids. (G) Immunoblot analysis of the phosphorylation of Arid5a in HEK293TLR4 cells after it was allowed to interact with several kinases following transfection with WT Myc-Arid5a, V5-IKKα, V5-IKKβ, V5-IRAK1, p38, Flag-JNK-1 and Flag-JNK-2 expression vectors. The cell lysates were prepared and immunoprecipitated to obtain the Arid5a protein using anti-Myc antibodies. This was followed by an immunoblot analysis of Arid5a (with anti-Myc antibodies), p38 (with anti-p38 antibodies), IKKα/β/IRAK1 (with anti-v5 antibodies), JNK-1/2 (with anti-Flag antibodies) and phosphoserine (with anti-p-Ser antibodies). Below, immunoblots of whole cell lysates that were treated with anti-v5, anti-p38, anti-Flag or anti-Myc antibodies. The data are representative of two–three independent experiments.CC BY-NC · PubMed Central
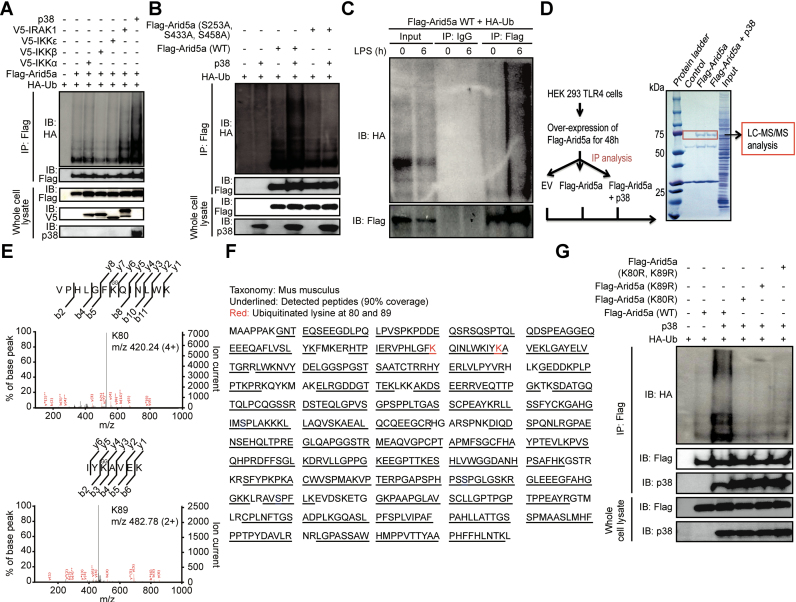
Figure 6. Arid5a is ubiquitinated in response to TLR4-p38 signaling. (A) Arid5a is ubiquitinated by p38. HEK293TLR4 cells were transfected with hemagglutinin-tagged ubiquitin (HA-Ub), Flag-tagged Arid5a and/or the v5-IKKα, v5-IKKβ, v5-IKKε, v5-IRAK1 or p38 expression vector (as indicated above the lanes). Cell lysates were then immunoprecipitated in the presence of MG-132 (1 μM) using anti-Flag antibodies and submitted to an immunoblot analysis of ubiquitin (using anti-HA antibodies) and Arid5a (using anti-Flag antibodies). Below, immunoblots of whole-cell lysates treated with anti-v5, anti-p38 or anti-Flag antibodies. (B) Ubiquitination is impaired in the Arid5a phosphorylation mutant. HEK293TLR4 cells were transfected to express HA-Ub, Flag-tagged Arid5a (WT), S253A, S433A and S458A-mutant Flag-Arid5a and/or a p38 expression vector (as indicated above the lanes). The lysates were then immunoprecipitated in the presence of MG-132 (1 μM) using anti-Flag antibodies and submitted to immunoblot analysis for ubiquitin (using anti-HA antibodies) and Arid5a (using anti-Flag antibodies). Below, an immunoblot of whole cell lysates that was performed using anti-p38 or anti-Flag antibodies is shown. (C) LPS stimulation induces the ubiquitination of Arid5a. Arid5a-deficient MEFs overexpressed WT Flag-Arid5a and hemagglutinin-tagged ubiquitin. The cells were then stimulated with LPS (10 μg/ml) for the indicated times and subsequently immunoprecipitated with Flag and IgG (control) antibodies in the presence of a proteasome inhibitor (MG-132; 1 μM) and analyzed by anti-HA (upper) and anti-Flag (below) antibodies for ubiquitin and Arid5a, respectively. (D–F) Detection of ubiquitination sites in the mouse Arid5a protein using LC-MS/MS analysis. HEK293TLR4 cells were transfected with expression vectors encoding Flag-Arid5a either alone or with p38 and empty vectors. The cells were then treated with MG-132 (1 μM). Flag-Arid5a was immunoprecipitated using Flag, and the eluted samples were subjected to SDS-PAGE. Bands were analyzed using mass spectrometry (D). The calculated target ions for lysine 80 (left panel) and lysine 89 (right panel) are shown (E). The peptides (underlined) corresponding to the mouse Arid5a protein were detected. The positions of the identified ubiquitination sites (red color) in the mouse Arid5a protein sequence (590 aa), as determined using mass spectrometry (F). (G) Ubiquitination of Arid5a is impaired in Arid5a ubiquitination site mutants. HEK293TLR4 cells were transfected with expression vectors containing WT Flag-Arid5a, K80R and K89R mutant Arid5a, or p38 and HA-Ub and then immunoprecipitated using Flag in the presence of MG-132 (1 μM). Immunoblot analyses were performed for ubiquitin (using anti-HA antibodies), Arid5a (using anti-Flag antibodies) and p38 (using anti-p38 antibodies). Below, an immunoblot of whole-cell lysates that was performed using anti-Flag and anti-p38 antibodies is shown. The data are representative of two or three independent experiments.
Figure 6. Arid5a is ubiquitinated in response to TLR4-p38 signaling. (A) Arid5a is ubiquitinated by p38. HEK293TLR4 cells were transfected with hemagglutinin-tagged ubiquitin (HA-Ub), Flag-tagged Arid5a and/or the v5-IKKα, v5-IKKβ, v5-IKKε, v5-IRAK1 or p38 expression vector (as indicated above the lanes). Cell lysates were then immunoprecipitated in the presence of MG-132 (1 μM) using anti-Flag antibodies and submitted to an immunoblot analysis of ubiquitin (using anti-HA antibodies) and Arid5a (using anti-Flag antibodies). Below, immunoblots of whole-cell lysates treated with anti-v5, anti-p38 or anti-Flag antibodies. (B) Ubiquitination is impaired in the Arid5a phosphorylation mutant. HEK293TLR4 cells were transfected to express HA-Ub, Flag-tagged Arid5a (WT), S253A, S433A and S458A-mutant Flag-Arid5a and/or a p38 expression vector (as indicated above the lanes). The lysates were then immunoprecipitated in the presence of MG-132 (1 μM) using anti-Flag antibodies and submitted to immunoblot analysis for ubiquitin (using anti-HA antibodies) and Arid5a (using anti-Flag antibodies). Below, an immunoblot of whole cell lysates that was performed using anti-p38 or anti-Flag antibodies is shown. (C) LPS stimulation induces the ubiquitination of Arid5a. Arid5a-deficient MEFs overexpressed WT Flag-Arid5a and hemagglutinin-tagged ubiquitin. The cells were then stimulated with LPS (10 μg/ml) for the indicated times and subsequently immunoprecipitated with Flag and IgG (control) antibodies in the presence of a proteasome inhibitor (MG-132; 1 μM) and analyzed by anti-HA (upper) and anti-Flag (below) antibodies for ubiquitin and Arid5a, respectively. (D–F) Detection of ubiquitination sites in the mouse Arid5a protein using LC-MS/MS analysis. HEK293TLR4 cells were transfected with expression vectors encoding Flag-Arid5a either alone or with p38 and empty vectors. The cells were then treated with MG-132 (1 μM). Flag-Arid5a was immunoprecipitated using Flag, and the eluted samples were subjected to SDS-PAGE. Bands were analyzed using mass spectrometry (D). The calculated target ions for lysine 80 (left panel) and lysine 89 (right panel) are shown (E). The peptides (underlined) corresponding to the mouse Arid5a protein were detected. The positions of the identified ubiquitination sites (red color) in the mouse Arid5a protein sequence (590 aa), as determined using mass spectrometry (F). (G) Ubiquitination of Arid5a is impaired in Arid5a ubiquitination site mutants. HEK293TLR4 cells were transfected with expression vectors containing WT Flag-Arid5a, K80R and K89R mutant Arid5a, or p38 and HA-Ub and then immunoprecipitated using Flag in the presence of MG-132 (1 μM). Immunoblot analyses were performed for ubiquitin (using anti-HA antibodies), Arid5a (using anti-Flag antibodies) and p38 (using anti-p38 antibodies). Below, an immunoblot of whole-cell lysates that was performed using anti-Flag and anti-p38 antibodies is shown. The data are representative of two or three independent experiments.CC BY-NC · PubMed Central
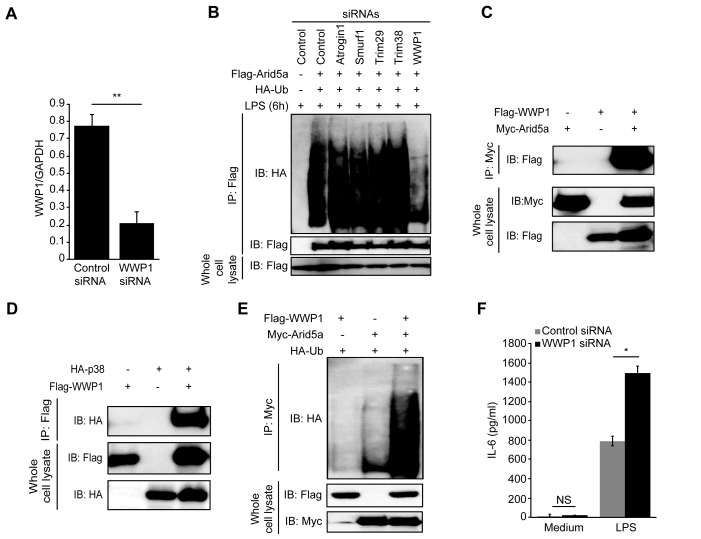
Figure 7. WWP1 E3 ubiquitin ligase mediates Arid5a polyubiquitination. (A) Analysis of WWP1 mRNA expression in MEF cells that were transfected with control siRNA and WWP1 siRNA (20 nM each). (B) MEF cells were treated with 20 nM control and E3 ubiquitin ligase siRNAs (WWP1, Atrogin1, Trim29, Trim38 and Smurf1) for 72 h and transfected to express hemagglutinin-tagged ubiquitin (HA-Ub) and Flag-tagged Arid5a (as indicated above the lanes). The cells were then stimulated for 6 h with LPS (10 μg/ml) and incubated for 6 h with MG-132 (1 μM) followed by immunoprecipitation with anti-Flag antibodies and immunoblot analyses of ubiquitin (using anti-HA) and Arid5a (using anti-Flag). Below, immunoblots of whole-cell lysates treated with anti-Flag antibody. (C and D) Immunoblot analysis of molecular interactions in HEK293TLR4 cells following transfection for 48 h with WT Myc-Arid5a, Flag-WWP1 (C) and HA-p38, Flag-WWP1 (D). The lysates were immunoprecipitated using anti-Myc (C) and anti-Flag (D) antibodies. This was followed by an immunoblot analysis of WWP1 (with anti-Flag antibody), p38 (with anti-HA antibody). Below, immunoblots of whole-cell lysates that were treated with anti-Myc, anti-Flag (C) and anti-HA, anti-Flag (D) antibodies. (E) Immunoassays of HEK293TLR4 cells transfected for 48 h to express HA-tagged Ub, Myc-tagged Arid5a or Flag-tagged WWP1 expression vector (as indicated above the lanes), then incubated for 6 h with MG-132 (1 μM) followed by immunoprecipitation with anti-Myc antibodies and immunoblot analyses of ubiquitin (using anti-HA), Below, immunoblots of whole-cell lysates treated with anti-Flag or anti-Myc antibodies. (F) IL-6 protein levels in the supernatants of control and WWP1 knockdown MEF cells at 24 h after stimulation with LPS (10 μg/ml). The data are representative of two–three independent experiments.
Figure 7. WWP1 E3 ubiquitin ligase mediates Arid5a polyubiquitination. (A) Analysis of WWP1 mRNA expression in MEF cells that were transfected with control siRNA and WWP1 siRNA (20 nM each). (B) MEF cells were treated with 20 nM control and E3 ubiquitin ligase siRNAs (WWP1, Atrogin1, Trim29, Trim38 and Smurf1) for 72 h and transfected to express hemagglutinin-tagged ubiquitin (HA-Ub) and Flag-tagged Arid5a (as indicated above the lanes). The cells were then stimulated for 6 h with LPS (10 μg/ml) and incubated for 6 h with MG-132 (1 μM) followed by immunoprecipitation with anti-Flag antibodies and immunoblot analyses of ubiquitin (using anti-HA) and Arid5a (using anti-Flag). Below, immunoblots of whole-cell lysates treated with anti-Flag antibody. (C and D) Immunoblot analysis of molecular interactions in HEK293TLR4 cells following transfection for 48 h with WT Myc-Arid5a, Flag-WWP1 (C) and HA-p38, Flag-WWP1 (D). The lysates were immunoprecipitated using anti-Myc (C) and anti-Flag (D) antibodies. This was followed by an immunoblot analysis of WWP1 (with anti-Flag antibody), p38 (with anti-HA antibody). Below, immunoblots of whole-cell lysates that were treated with anti-Myc, anti-Flag (C) and anti-HA, anti-Flag (D) antibodies. (E) Immunoassays of HEK293TLR4 cells transfected for 48 h to express HA-tagged Ub, Myc-tagged Arid5a or Flag-tagged WWP1 expression vector (as indicated above the lanes), then incubated for 6 h with MG-132 (1 μM) followed by immunoprecipitation with anti-Myc antibodies and immunoblot analyses of ubiquitin (using anti-HA), Below, immunoblots of whole-cell lysates treated with anti-Flag or anti-Myc antibodies. (F) IL-6 protein levels in the supernatants of control and WWP1 knockdown MEF cells at 24 h after stimulation with LPS (10 μg/ml). The data are representative of two–three independent experiments.CC BY-NC · PubMed Central
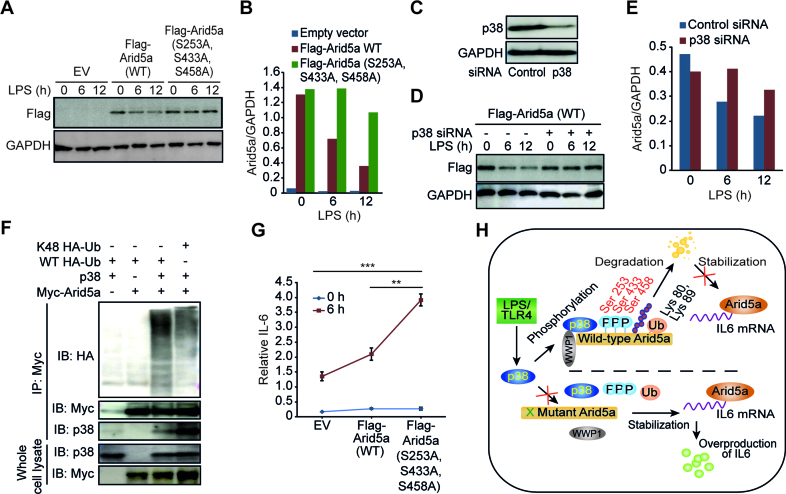
Figure 8. The phosphorylation-mediated degradation of Arid5a affects IL-6 mRNA expression. (A) Immunoblot analysis of lysates obtained from Arid5a-deficient MEF cells that expressed an empty vector (EV) or an expression vector containing WT Flag-tagged Arid5a or S253A, S433A and S458A-mutant Flag-Arid5a. The cells were stimulated for 0–12 h (above lane) with LPS (5 μg/ml) and then probed with anti-Flag or anti-GAPDH antibodies. (B) Densitometry analysis with results presented as the ratio to GAPDH. (C) Immunoblot assay of p38 expression in MEF cells transfected with 20 nM control or p38 siRNA. (D and E) Immunoblot (D) and densitometry analysis (E) of Flag-tagged Arid5a protein expression following LPS stimulation in control and p38 knockdown MEFs as described above in (A and B). (F) Immunoassay of HEK293TLR4 cells transfected for 48 h to express WT HA-tagged ubiquitin (HA-Ub), K48-HA-Ub, Myc-tagged Arid5a or p38 expression vector (as indicated above the lanes), then incubated for 6 h with MG-132 (1 μM) followed by immunoprecipitation with anti-Myc antibodies and immunoblot analyses of ubiquitin (using anti-HA), p38 (using anti-p38) and Arid5a (using anti-Myc). Below, immunoblots of whole-cell lysates treated with anti-p38 or anti-Myc antibodies. (G) Quantitative PCR analysis of the expression level of IL-6 mRNA in total RNA obtained from the cells described in A and presented relative to the level of GAPDH RNA. (H) Schematic diagram representing the regulatory mechanism proposed by which degradation of Arid5a by p38 signaling regulates the stability of IL-6 mRNA. The activation of p38 by LPS resulted in the phosphorylation of Arid5a at serine residues 253, 433 and 458, which leads to its ubiquitination on lysine residues 80 and 89 and its subsequent degradation. The degradation of Arid5a results in the inhibition of the stabilization of IL-6 mRNA. Mutating Arid5a at the above described phosphorylation sites blocked it from being degraded, which resulted in the overproduction of IL-6 because its mRNA remained stabilized. The cross shown in green indicates the phosphorylation sites that were mutated in Arid5a, and the cross shown in red indicates its inhibited function. The data are representative of two–three independent experiments. Error bars indicate the mean ± SD. **P < 0.01; ***P < 0.001.
Figure 8. The phosphorylation-mediated degradation of Arid5a affects IL-6 mRNA expression. (A) Immunoblot analysis of lysates obtained from Arid5a-deficient MEF cells that expressed an empty vector (EV) or an expression vector containing WT Flag-tagged Arid5a or S253A, S433A and S458A-mutant Flag-Arid5a. The cells were stimulated for 0–12 h (above lane) with LPS (5 μg/ml) and then probed with anti-Flag or anti-GAPDH antibodies. (B) Densitometry analysis with results presented as the ratio to GAPDH. (C) Immunoblot assay of p38 expression in MEF cells transfected with 20 nM control or p38 siRNA. (D and E) Immunoblot (D) and densitometry analysis (E) of Flag-tagged Arid5a protein expression following LPS stimulation in control and p38 knockdown MEFs as described above in (A and B). (F) Immunoassay of HEK293TLR4 cells transfected for 48 h to express WT HA-tagged ubiquitin (HA-Ub), K48-HA-Ub, Myc-tagged Arid5a or p38 expression vector (as indicated above the lanes), then incubated for 6 h with MG-132 (1 μM) followed by immunoprecipitation with anti-Myc antibodies and immunoblot analyses of ubiquitin (using anti-HA), p38 (using anti-p38) and Arid5a (using anti-Myc). Below, immunoblots of whole-cell lysates treated with anti-p38 or anti-Myc antibodies. (G) Quantitative PCR analysis of the expression level of IL-6 mRNA in total RNA obtained from the cells described in A and presented relative to the level of GAPDH RNA. (H) Schematic diagram representing the regulatory mechanism proposed by which degradation of Arid5a by p38 signaling regulates the stability of IL-6 mRNA. The activation of p38 by LPS resulted in the phosphorylation of Arid5a at serine residues 253, 433 and 458, which leads to its ubiquitination on lysine residues 80 and 89 and its subsequent degradation. The degradation of Arid5a results in the inhibition of the stabilization of IL-6 mRNA. Mutating Arid5a at the above described phosphorylation sites blocked it from being degraded, which resulted in the overproduction of IL-6 because its mRNA remained stabilized. The cross shown in green indicates the phosphorylation sites that were mutated in Arid5a, and the cross shown in red indicates its inhibited function. The data are representative of two–three independent experiments. Error bars indicate the mean ± SD. **P < 0.01; ***P < 0.001.CC BY-NC · PubMed Central

Verification

Claims the paper makes

The claims and statistics of this paper haven’t been checked yet.

Run the check — free, no account needed. It reads the open-access text and checks the sources it cites.

A few free checks a day · papers already verified open instantly · results are public

Claims other papers make about this one

Each is checked against this paper’s own text: does it say what the citing paper says it does?

Self-check

Percentages, sums and reported differences re-computed from the paper’s own numbers.

The self-check needs the paper’s full text.

Citations

Cites

Research works printed but not linked: 32

  1. 2011, Toll-like receptors and their crosstalk with other innate receptors in infection and immunity, Immunity, 34, 637, 10.1016/j.immuni.2011.05.006 · DOI · Paper page
  2. 2009, Transcriptional control of the inflammatory response, Nat. Rev. Immunol., 9, 692, 10.1038/nri2634 · DOI · Paper page
  3. 2005, INTERLEUKIN-6: from basic science to medicine—40 years in immunology, Annu. Rev. Immunol., 23, 1, 10.1146/annurev.immunol.23.021704.115806 · DOI
  4. 2008, Post-transcriptional control of cytokine production, Nat. Immunol., 9, 353, 10.1038/ni1584 · DOI · Paper page
  5. 2009, The stability of mRNA influences the temporal order of the induction of genes encoding inflammatory molecules, Nat. Immunol., 10, 281, 10.1038/ni.1699 · DOI · Paper page
  6. 2009, Zc3h12a is an RNase essential for controlling immune responses by regulating mRNA decay, Nature, 458, 1185, 10.1038/nature07924 · DOI · Paper page
  7. 2013, Arid5a controls IL-6 mRNA stability, which contributes to elevation of IL-6 level in vivo, Proc. Natl. Acad. Sci. U.S.A., 110, 9409, 10.1073/pnas.1307419110 · DOI · Paper page
  8. 2011, The IκB kinase complex regulates the stability of cytokine-encoding mRNA induced by TLR–IL-1R by controlling degradation of regnase-1, Nat. Immunol., 12, 1167, 10.1038/ni.2137 · DOI
  9. 2006, Dynamic regulation of pro- and anti-inflammatory cytokines by MAPK phosphatase 1 (MKP-1) in innate immune responses, Proc. Natl. Acad. Sci. U.S.A., 103, 2274, 10.1073/pnas.0510965103 · DOI
  10. 2011, MKP-1 regulates cytokine mRNA stability through selectively modulation subcellular translocation of AUF1, Cytokine, 56, 245, 10.1016/j.cyto.2011.06.006 · DOI
  11. 2000, Protein phosphatases and the regulation of mitogen-activated protein kinase signalling, Curr. Opin. Cell Biol., 12, 186, 10.1016/S0955-0674(99)00075-7 · DOI
  12. 2007, MAPK phosphatases — regulating the immune response, Nat. Rev. Immunol., 7, 202, 10.1038/nri2035 · DOI
  13. 2012, MKP-1: a negative feedback effector that represses MAPK-mediated pro-inflammatory signaling pathways and cytokine secretion in human airway smooth muscle cells, Cell. Signal., 24, 907, 10.1016/j.cellsig.2011.12.013 · DOI
  14. 2015, Temporal regulation of cytokine mRNA expression by tristetraprolin: dynamic control by p38 MAPK and MKP-1, Am. J. Physiol. Lung Cell. Mol. Physiol., 308, L973, 10.1152/ajplung.00219.2014 · DOI
  15. 2001, Mitogen-activated protein kinase p38 controls the expression and posttranslational modification of tristetraprolin, a regulator of tumor necrosis factor alpha mRNA stability, Mol. Cell. Biol., 21, 6461, 10.1128/MCB.21.9.6461-6469.2001 · DOI
  16. 2009, p38 mitogen-activated protein kinase- and HuR-dependent stabilization of p21Cip1 mRNA mediates the G1/S checkpoint, Mol. Cell. Biol., 29, 4341, 10.1128/MCB.00210-09 · DOI
  17. 2009, The potential of p38 MAPK inhibitors to modulate periodontal infections, Curr. Drug Metab., 10, 55, 10.2174/138920009787048347 · DOI
  18. 2011, Arid5a cooperates with Sox9 to stimulate chondrocyte-specific transcription, Mol. Biol. Cell, 22, 1300, 10.1091/mbc.E10-07-0566 · DOI
  19. 2016, Arid5a regulates naive CD4 + T cell fate through selective stabilization of Stat3 mRNA, J. Exp. Med., 213, 605, 10.1084/jem.20151289 · DOI · Paper page
  20. 2006, ESPResSo—an extensible simulation package for research on soft matter systems, Comput. Phys. Commun., 174, 704, 10.1016/j.cpc.2005.10.005 · DOI
  21. 2014, Quantifying sequence and structural features of protein-RNA interactions, Nucleic Acids Res., 42, 10086, 10.1093/nar/gku681 · DOI
  22. 1993, Cytoplasmic regulation of mRNA function: the importance of the 3΄ untranslated region, Cell, 74, 9, 10.1016/0092-8674(93)90290-7 · DOI
  23. 2006, Destabilization of interleukin-6 mRNA requires a putative RNA stem-loop structure, an AU-rich element, and the RNA-binding protein AUF1, Mol. Cell. Biol., 26, 8228, 10.1128/MCB.01155-06 · DOI · Paper page
  24. 1998, NF-kappa B and Rel proteins: evolutionarily conserved mediators of immune responses, Annu. Rev. Immunol., 16, 225, 10.1146/annurev.immunol.16.1.225 · DOI
  25. 2008, Autocrine IL-6 signaling: a key event in tumorigenesis, Cancer Cell, 13, 7, 10.1016/j.ccr.2007.12.020 · DOI
  26. 2014, AT-rich-interactive domain-containing protein 5A functions as a negative regulator of retinoic acid receptor-related orphan nuclear receptor γt-induced Th17 cell differentiation, Arthritis Rheumatol., 66, 1185, 10.1002/art.38324 · DOI
  27. 2011, Tristetraprolin regulates interleukin-6 expression through p38 MAPK-dependent affinity changes with mRNA 3΄ untranslated region, J. Interferon Cytokine Res., 31, 629, 10.1089/jir.2010.0154 · DOI
  28. 2008, p38α stabilizes interleukin-6 mRNA via multiple AU-rich elements, J. Biol. Chem., 283, 1778, 10.1074/jbc.M707573200 · DOI
  29. 2005, Phosphorylation-dependent degradation of p300 by doxorubicin-activated p38 mitogen-activated protein kinase in cardiac cells, Mol. Cell. Biol., 25, 2673, 10.1128/MCB.25.7.2673-2687.2005 · DOI
  30. 2013, p38 MAPK- and Akt-mediated p300 phosphorylation regulates its degradation to facilitate nucleotide excision repair, Nucleic Acids Res., 41, 1722, 10.1093/nar/gks1312 · DOI
  31. 2002, MAP kinases in the immune response, Annu. Rev. Immunol., 20, 55, 10.1146/annurev.immunol.20.091301.131133 · DOI
  32. 2013, WW domain containing E3 ubiquitin protein ligase 1 (WWP1) negatively regulates TLR4-mediated TNF-α and IL-6 production by proteasomal degradation of TNF receptor associated factor 6 (TRAF6), PLoS One, 8, e67633, 10.1371/journal.pone.0067633 · DOI

Cited by

Sorted by citations

See all 190

Metadata

Authors
Nyati, K. K., Masuda, K., Zaman, M. M.-U., Dubey, P. K., Millrine, D., Chalise, J. P., Higa, M., Li, S., Standley, D. M., Saito, K., Hanieh, H., & Kishimoto, T.
Venue
Nucleic Acids Research
Published
2017-02-07
Volume
45
Issue
5
Pages
2687-2703
ISSN
  • 0305-1048
  • 1362-4962
Cited by
190
References
3
Language
en

About these checks

Registry, retraction, Cites and statistics results are computed, not judged, with one exception: a printed reference that no index lists is read once by a model before it counts as a citation error. Claims are extracted by a model and kept only when their quote appears verbatim in the text; each cited source is then checked, with a model’s help, for whether it says what the claim relies on. Those verdicts can be wrong — read the claim’s quote and the cited source before relying on one.

Statistics and arithmetic are recomputed, not judged.

Confidence bands are shown only for fields calibrated on our annotated test set. None is calibrated yet, so no band is shown.

What counts as a claim ›How we measure confidence ›How we check this ›

Are you an author, or do you see a problem with this page? Request a review