

The DOI matches its Crossref record; 154 of the 154 references it cites were found in a registry or an index.
Occipital sleep spindles predict sequence learning in a visuo-motor task
Open accessAbstract
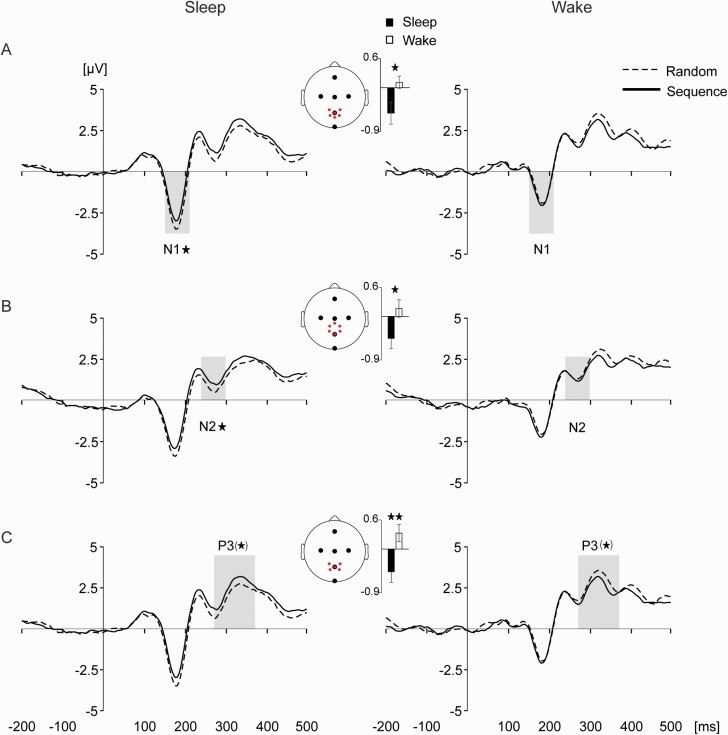
Study Objectives: The brain appears to use internal models to successfully interact with its environment via active predictions of future events. Both internal models and the predictions derived from them are based on previous experience. However, it remains unclear how previously encoded information is maintained to support this function, especially in the visual domain. In the present study, we hypothesized that sleep consolidates newly encoded spatio-temporal regularities to improve predictions afterwards. Methods: We tested this hypothesis using a novel sequence-learning paradigm that aimed to dissociate perceptual from motor learning. We recorded behavioral performance and high-density electroencephalography (EEG) in male human participants during initial training and during testing two days later, following an experimental night of sleep (n = 16, including high-density EEG recordings) or wakefulness (n = 17). Results: Our results show sleep-dependent behavioral improvements correlated with sleep-spindle activity specifically over occipital cortices. Moreover, event-related potential (ERP) responses indicate a shift of attention away from predictable to unpredictable sequences after sleep, consistent with enhanced automaticity in the processing of predictable sequences. Conclusions: These findings suggest a sleep-dependent improvement in the prediction of visual sequences, likely related to visual cortex reactivation during sleep spindles. Considering that controls in our experiments did not fully exclude oculomotor contributions, future studies will need to address the extent to which these effects depend on purely perceptual versus oculomotor sequence learning.
Overview
The claims and statistics of this paper haven’t been checked yet.
Free: it reads the open-access text and checks the first 5 claims that cite a source we can check. Create a free account to check every claim.
Integrity signals
Registry
Cites
Statistics
Figures



Verification
Claims the paper makes
The claims and statistics of this paper haven’t been checked yet.
Free: it reads the open-access text and checks the first 5 claims that cite a source we can check. Create a free account to check every claim.
Self-check
Percentages, sums and reported differences re-computed from the paper’s own numbers.
The self-check needs the paper’s full text.
Citations
Cites
Controlling the False Discovery Rate: A Practical and Powerful Approach to Multiple Testing
Benjamini, Y., & Hochberg, Y. (1995) · Journal of the Royal Statistical Society Series B: Statistical Methodology · doi:10.1111/j.2517-6161.1995.tb02031.x · Cited by 109,482 · cited 1×
“…correct for multiple correlations with the different spindle measures, we used false discovery rate (FDR)-correction following the Benjamini–Hochberg procedure and report FDR-corrected p values for all correlation measures, both for the correlations and the topographical specificity tests [83, 84].”
MethodThe assessment and analysis of handedness: The Edinburgh inventory
Oldfield, R. C. (1971) · Neuropsychologia · doi:10.1016/0028-3932(71)90067-4 · Cited by 35,900
Rechtschaffen, A. (1968) · Medical Entomology and Zoology · Cited by 12,638
Oostenveld, R., Fries, P., Maris, E., & Schoffelen, J.-M. (2011) · Computational Intelligence and Neuroscience · doi:10.1155/2011/156869 · Cited by 10,323 · cited 1×
“We used FieldTrip (RRID:SCR_004849) [81] to filter EEG, EOG and mastoid electrodes between 0.5 and 40 Hz, and EMG electrodes be-tween 5 and 90 Hz (fourth-order two-pass Butterworth bandpass filters).”
MethodInfluentialUpdating P300: An integrative theory of P3a and P3b
Polich, J. (2007) · Clinical Neurophysiology · doi:10.1016/j.clinph.2007.04.019 · Cited by 7,919 · cited 2×
“Effects of sequence learning on P3 have been reported in numerous studies [55–57, 60, 90, 128], in accordance with the component’s role in stimulus-driven memory processing (for reviews, see [53, 129]).”
BackgroundResult(2005) · Cited by 5,977
Whatever next? Predictive brains, situated agents, and the future of cognitive science
Clark, A. (2013) · Behavioral and Brain Sciences · doi:10.1017/s0140525x12000477 · Cited by 5,924
Rao, R. P. N., & Ballard, D. H. (1999) · Nature Neuroscience · doi:10.1038/4580 · Cited by 5,483 · cited 1×
“…involved in generating holistic representations, that is, internal models of critical environmental features, thereby allowing for predictions of future events and adaptive behaviors [3–6, 8, 9, 34, 105, 106] Behaviorally, we found shorter reaction times for sequence compared with random blocks.”
BackgroundA self-assessment questionnaire to determine morningness- eveningness in human circadian rhythms
Home, J. K. (1976) · Medical Entomology and Zoology · Cited by 4,783
Tests for comparing elements of a correlation matrix
Steiger, J. H. (1980) · Psychological Bulletin · doi:10.1037/0033-2909.87.2.245 · Cited by 4,621 · cited 1×
“To test for differences between correlations of Training and Test, we used Steiger’s Z test [85, 86].”
Method
Research works printed but not linked: 1
- Lüthi, 2014, Sleep spindles, Neurosci, 20, 243
Cited by
Sleep—A brain-state serving systems memory consolidation
Brodt, S., Inostroza, M., Niethard, N., & Born, J. (2023) · Neuron · doi:10.1016/j.neuron.2023.03.005 · Cited by 343
Long term effects of cueing procedural memory reactivation during NREM sleep
Rakowska, M., Abdellahi, M. E. A., Bagrowska, P., Navarrete, M., & Lewis, P. A. (2021) · NeuroImage · doi:10.1016/j.neuroimage.2021.118573 · Cited by 50
“The literature reports spindle-related changes over brain areas inolved in learning ( Cox et al., 2014 ) which often predict behavioural mprovements ( Bergmann et al., 2012 ; Lutz et al., 2021 ; Fogel et al., 017 ; Barakat et al., 2013 ).”
BackgroundSpindle-dependent memory consolidation in healthy adults: a meta-analysis
Kumral, D., Matzerath, A., Leonhart, R., & Schönauer, M. (2023) · Neuropsychologia · doi:10.1016/j.neuropsychologia.2023.108661 · Cited by 32
Sleep’s contribution to memory formation
Lutz, N. D., Harkotte, M., & Born, J. (2025) · Physiological Reviews · doi:10.1152/physrev.00054.2024 · Cited by 59
Self-citationSleep shapes the associative structure underlying pattern completion in multielement event memory
Lutz, N. D., Martínez-Albert, E., Friedrich, H., Born, J., & Besedovsky, L. (2024) · Proceedings of the National Academy of Sciences · doi:10.1073/pnas.2314423121 · Cited by 20
“Based on our previous findings (65), our analyses focused on power density in the fast spindle band and fast spindle amplitude (i.e., the mean amplitude of discrete fast spindle events, measured from trough to peak).”
Self-citation
Metadata
- Authors
- Lutz, N. D., Admard, M., Genzoni, E., Born, J., & Rauss, K.
- Affiliations
- University of Tübingen (DE)
- École Polytechnique Fédérale de Lausanne (CH)
- Institute of Medical Psychology and Behavioral Neurobiology, University of Tübingen , Tübingen , Germany
- Corresponding author
- Rauss, Karsten
- Venue
- SLEEP
- Publisher
- Oxford University Press (OUP)
- Published
- 2021-03-20
- Volume
- 44
- Issue
- 8
- ISSN
- 0161-8105 (ISSN-L)
- 1550-9109
- PMC
- PMC8361350
- OpenAlex
- W3136107328
- Cited by
- 12
- References
- 153
- Citations by year
- 2026: 2 · 2025: 1 · 2024: 3 · 2023: 5 · 2021: 1
- FWCI
- 1.18
- Type
- journal article
- Language
- en
- Open access
- hybrid
- doi.org
- Licence
- Locations
- SLEEP (publishedVersion, cc-by-nc)
- PubMed Central (publishedVersion, cc-by-nc)
- PubMed (publishedVersion)
- Site cant be reached (submittedVersion, cc-by-nc)
- PuSH - Publication Server of Helmholtz Zentrum München (submittedVersion, cc-by-nc)
- Funders
- Deutsche Forschungsgemeinschaft (276693517)
- European Research Council (AdG 883098)
- Topics
- Life Sciences › Neuroscience › Cognitive Neuroscience › Sleep and Wakefulness Research
- Life Sciences › Neuroscience › Cognitive Neuroscience › Memory and Neural Mechanisms
- Life Sciences › Neuroscience › Cognitive Neuroscience › Neural dynamics and brain function
- Keywords
- sleep spindles, sequence learning, visuomotor task, sleep-dependent memory consolidation, internal models, prediction, perceptual learning, motor learning, attentional shift, automaticity, event-related potentials
- MeSH terms
- Brain, Electroencephalography, Humans, Learning, Male, Sleep
About these checks
Registry, retraction, Cites and statistics results are computed, not judged, with one exception: a printed reference that no index lists is read once by a model before it counts as a citation error. Claims are extracted by a model and kept only when their quote appears verbatim in the text; each cited source is then checked, with a model’s help, for whether it says what the claim relies on. Those verdicts can be wrong — read the claim’s quote and the cited source before relying on one.
Statistics and arithmetic are recomputed, not judged.
Confidence bands are shown only for fields calibrated on our annotated test set. None is calibrated yet, so no band is shown.
What counts as a claim ›How we measure confidence ›How we check this ›
Are you an author, or do you see a problem with this page? Request a review
How to cite
Cite CoChat for the checks on this page, and the paper for its own findings.
- This page
- CoChat. (2026). Citation check: Occipital sleep spindles predict sequence learning in a visuo-motor task. https://app.cochat.ai/papers/10.1093/sleep/zsab056
- The paper
- Lutz, N. D., Admard, M., Genzoni, E., Born, J., & Rauss, K. (2021). Occipital sleep spindles predict sequence learning in a visuo-motor task. SLEEP. https://doi.org/10.1093/sleep/zsab056
Data sources
Bibliographic data: Semantic Scholar, OpenAlex, Crossref.
Contains information from the Semantic Scholar Academic Graph Datasets, made available under the ODC Attribution License (ODC-BY 1.0).
Semantic Scholar’s data is described in: Kinney, R., et al. (2023). The Semantic Scholar Open Data Platform. arXiv:2301.10140.
