

The DOI matches its Crossref record; 56 of the 56 references it cites were found in a registry or an index.
Sleep stage prediction with raw acceleration and photoplethysmography heart rate data derived from a consumer wearable device
Open accessAbstract
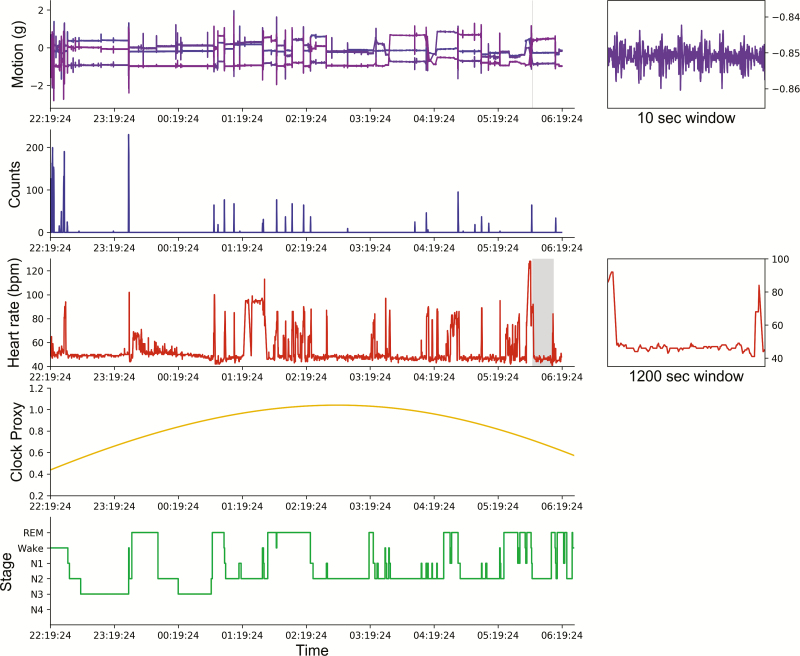
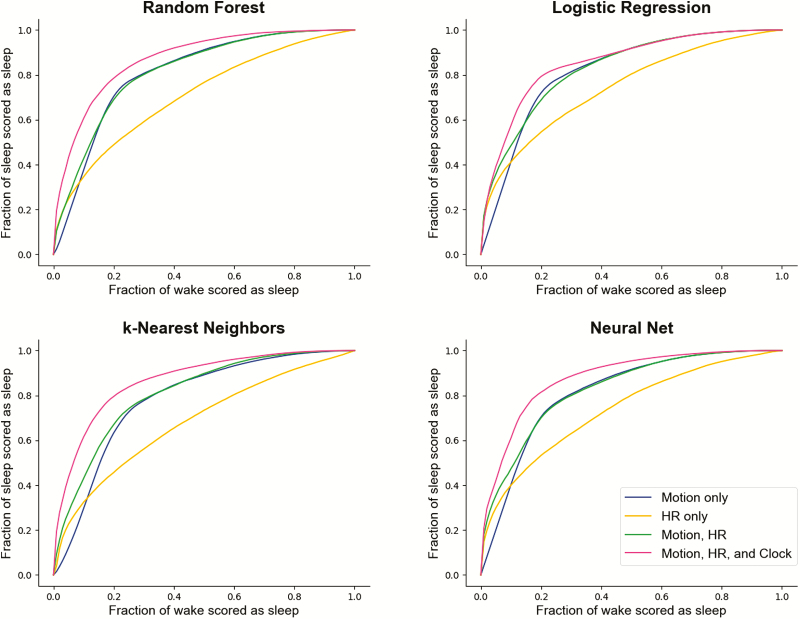
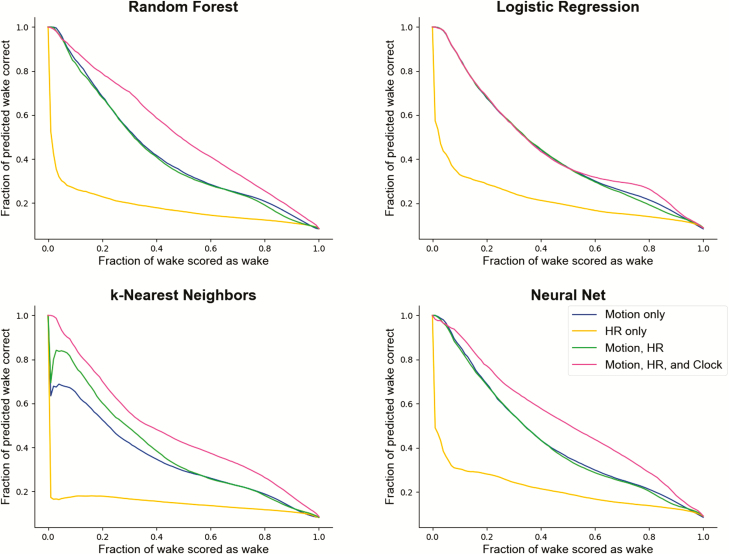
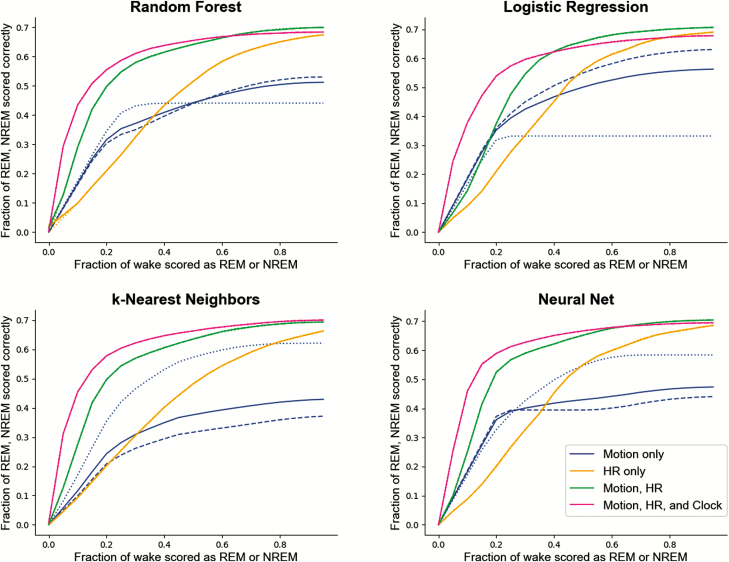
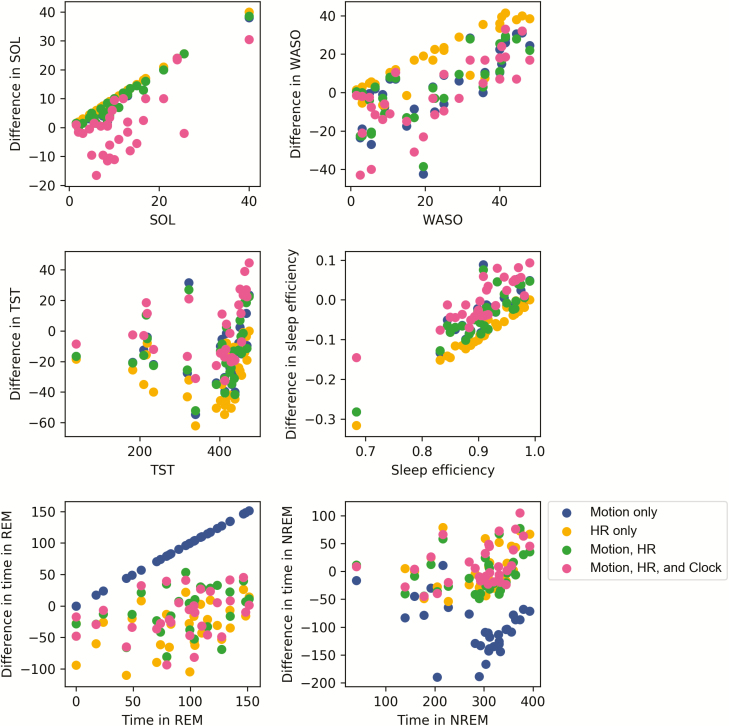
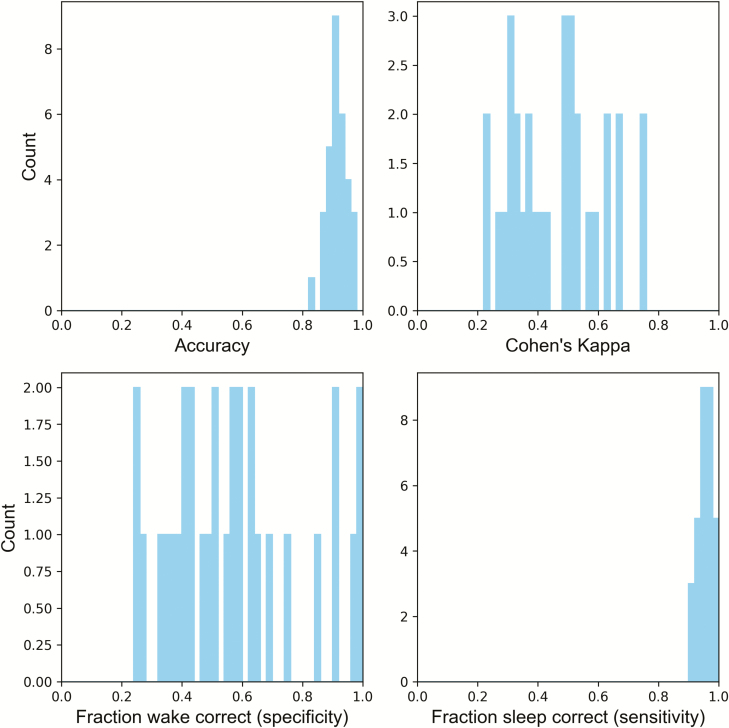
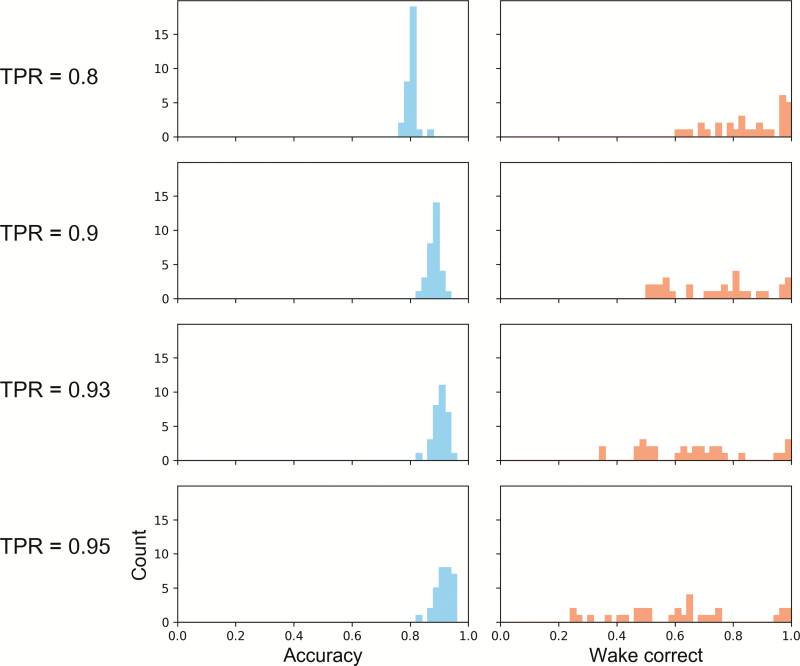
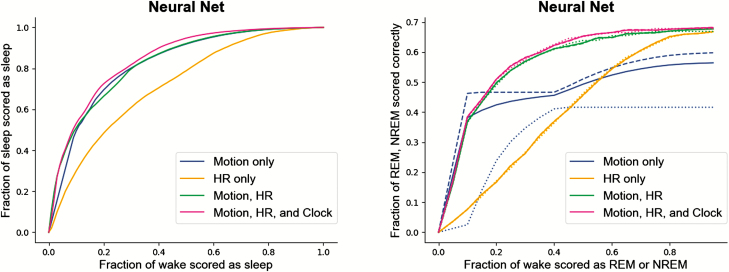
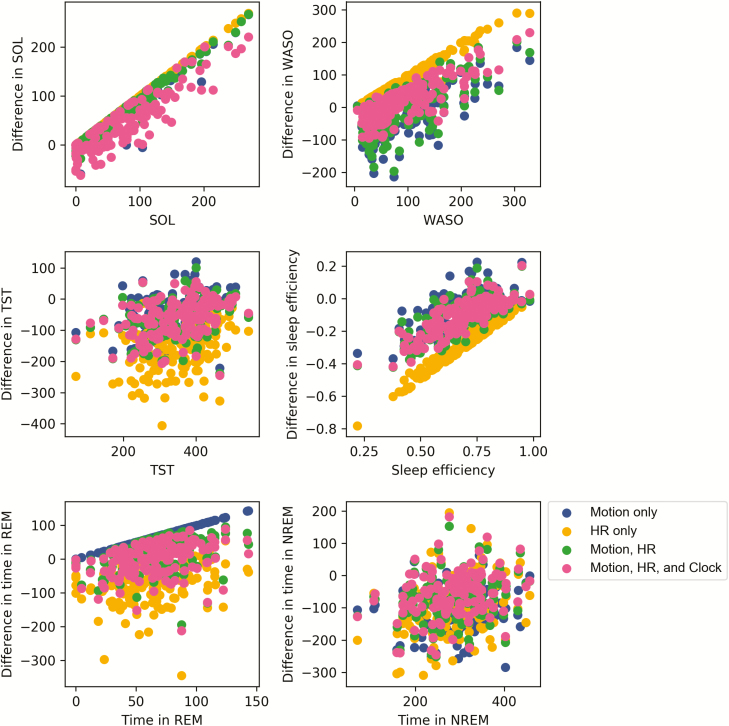
Wearable, multisensor, consumer devices that estimate sleep are now commonplace, but the algorithms used by these devices to score sleep are not open source, and the raw sensor data is rarely accessible for external use. As a result, these devices are limited in their usefulness for clinical and research applications, despite holding much promise. We used a mobile application of our own creation to collect raw acceleration data and heart rate from the Apple Watch worn by participants undergoing polysomnography, as well as during the ambulatory period preceding in lab testing. Using this data, we compared the contributions of multiple features (motion, local standard deviation in heart rate, and “clock proxy”) to performance across several classifiers. Best performance was achieved using neural nets, though the differences across classifiers were generally small. For sleep-wake classification, our method scored 90% of epochs correctly, with 59.6% of true wake epochs (specificity) and 93% of true sleep epochs (sensitivity) scored correctly. Accuracy for differentiating wake, NREM sleep, and REM sleep was approximately 72% when all features were used. We generalized our results by testing the models trained on Apple Watch data using data from the Multi-ethnic Study of Atherosclerosis (MESA), and found that we were able to predict sleep with performance comparable to testing on our own dataset. This study demonstrates, for the first time, the ability to analyze raw acceleration and heart rate data from a ubiquitous wearable device with accepted, disclosed mathematical methods to improve accuracy of sleep and sleep stage prediction.
Overview
The claims and statistics of this paper haven’t been checked yet.
Run the check — free, no account needed. It reads the open-access text and checks the sources it cites.
Integrity signals
Registry
Cites
Statistics
Figures
Verification
Claims the paper makes
The claims and statistics of this paper haven’t been checked yet.
Run the check — free, no account needed. It reads the open-access text and checks the sources it cites.
Claims other papers make about this one
Each is checked against this paper’s own text: does it say what the citing paper says it does?
In the citing paper
“Algorithms have used PPG-derived HR [221], PRV [222], [223], RR [222], pulse wave morphology [223], and accelerometry in combination with PPG [222].”
From Wearable Photoplethysmography for Cardiovascular Monitoring (2022) · cites this paper as [221]
Self-check
Percentages, sums and reported differences re-computed from the paper’s own numbers.
The self-check needs the paper’s full text.
Citations
Cites
Scikit-learn: Machine Learning in Python
Pedregosa, F., Varoquaux, G., Gramfort, A., Michel, V., Thirion, B., Grisel, O., Blondel, M., Müller, A., Nothman, J., Louppe, G., et al. (2012) · arXiv · doi:10.48550/arxiv.1201.0490 · Cited by 71,016
STATISTICAL METHODS FOR ASSESSING AGREEMENT BETWEEN TWO METHODS OF CLINICAL MEASUREMENT
Martin Bland, J., & Altman, D. (1986) · The Lancet · doi:10.1016/s0140-6736(86)90837-8 · Cited by 47,965
The meaning and use of the area under a receiver operating characteristic (ROC) curve.
Hanley, J. A., & McNeil, B. J. (1982) · Radiology · doi:10.1148/radiology.143.1.7063747 · Cited by 21,856
A New Method for Measuring Daytime Sleepiness: The Epworth Sleepiness Scale
Johns, M. W. (1991) · Sleep · doi:10.1093/sleep/14.6.540 · Cited by 17,364
(2007) · Cited by 6,530
Saito, T., & Rehmsmeier, M. (2015) · PLOS ONE · doi:10.1371/journal.pone.0118432 · Cited by 5,309
Multi-Ethnic Study of Atherosclerosis: Objectives and Design
Bild, D. E. (2002) · American Journal of Epidemiology · doi:10.1093/aje/kwf113 · Cited by 3,942
Two-Process Model of Sleep Regulation
Binder, M. D., Hirokawa, N., & Windhorst, U. (2008) · Springer eBooks · doi:10.1007/978-3-540-29678-2_6166 · Cited by 3,900
The Role of Actigraphy in the Study of Sleep and Circadian Rhythms
Ancoli-Israel, S., Cole, R., Alessi, C., Chambers, M., Moorcroft, W., & Pollak, C. P. (2003) · Sleep · doi:10.1093/sleep/26.3.342 · Cited by 2,751 · cited 1×
“The current method accepted by the medical and scientific community for objective, longitudinal sleep measurement in the ambulatory setting is actigraphy [3, 4].”
MethodAutomatic sleep/wake identification from wrist activity.
Cole, R., Kripke, D., Gruen, W., Mullaney, D., & Gillin, J. (1992) · Sleep · doi:10.1093/sleep/15.5.461 · Cited by 1,971
Cited by
Sorted by citations
Items 201–240 of 240
Smartwatch Sleep-Tracking Services Precision Evaluation Using Supervised Domain Adaptation
de la Cal, E., Fáñez, M., Apolo, M. D., Gómez, A. G., & González, V. M. (2022) · Lecture notes in computer science · doi:10.1007/978-3-031-15471-3_2
Sleep-Wake Classification Using Acceleration Data from Wearable Wrist Worn Sensors: REVIEW
Chakraborty, S., Sarkar, A., & Basak, P. (2022) · Communications in computer and information science · doi:10.1007/978-3-031-22485-0_20
Nakari, I., Nakashima, M., & Takadama, K. (2023) · Lecture notes in computer science · doi:10.1007/978-3-031-35132-7_40
Infrastructure and Algorithm for Intelligent Bed Systems
Patel, J., & Jain, S. (2023) · Lecture notes in networks and systems · doi:10.1007/978-981-99-0483-9_28
Ranjandish, R., Gholami, S., & Ahmadizadeh, C. (2023) · International Conference on Electrical, Computer, Communications and Mechatronics Engineering (ICECCME) · doi:10.1109/iceccme57830.2023.10252931
Wearables and sleep tracking in athletics programs
Lujan, M. R., Perez-Pozuelo, I., & Grandner, M. A. (2024) · Elsevier eBooks · doi:10.1016/b978-0-12-822969-9.00013-4
AdvSleepNet: Accelerometer-Based Sleep Stage Detection
Savanur, A. G., Khan, A. M., Biradar, P., Tabib, R. A., Patil, U., & Mudengudi, U. (2024) · Lecture notes in networks and systems · doi:10.1007/978-981-97-6995-7_18
Continuous-time locally stationary wavelet processes
Palasciano, H. A., Knight, M. I., & Nason, G. P. (2025) · Biometrika · doi:10.1093/biomet/asaf015
A Non-Wearable Smart Sleep Monitoring System
Ko, Y., & Lim, H. (2025) · The Journal of Korean Institute of Information Technology · doi:10.14801/jkiit.2025.23.5.49
Synthesizing Research in Sport and Exercise: Transitioning to Real-World Data and Data Science
Hafer, J. F., Whiteside, D., Kozloff, K. M., & Zernicke, R. F. (2025) · Journal of Applied Biomechanics · doi:10.1123/jab.2024-0308
Unraveling the Sandman’s Mystery: Predicting and Explaining Sleep Quality Over Eight Years
Ford, A., Zhang, T., Dong, A., & Bae, S. W. (2025) · International Conference on Activity and Behavior Computing (ABC) · doi:10.1109/abc64332.2025.11118601
Hoang, H., Ha, H., Nguyen, H. T., Watton, P. N., & Ngo, L. T. (2025) · Biomedical Engineering Letters · doi:10.1007/s13534-025-00505-4 · Cited by 2
Hausdorff correlation for interval-valued random objects
Kang, X., Ouyang, X., Liang, H., & Meng, C. (2025) · Statistics and Computing · doi:10.1007/s11222-025-10743-2
Exploring Label Noise Reduction Techniques for Sleep Stage Classification Using Wearable Devices
Moreira, M. Y., de Lira, V. M., Cruz, L. A., & de Macêdo, J. A. F. (2025) · doi:10.5753/bresci.2025.248075
Assessment of children’s sleep using thigh-worn Axivity AX3 accelerometers
Johansen, M. S., Lykke, E. H., Grøntved, A., Kristensen, P. L., Schmidt‐Persson, J., Sørensen, S. O., Mortensen, S. R., Meredith-Jones, K., Taylor, R., & Brønd, J. C. (2026) · Sleep Science and Practice · doi:10.1186/s41606-026-00183-w
Feasibility of sleep assessment modalities in children with Lennox-Gastaut syndrome.
Gupta, G., O'Brien, L. M., Hassan, F., Jun, J. C., Rau, S., Gupta, A., Saeed, R., & Shellhaas, R. (2025) · Seminars in Pediatric Neurology · doi:10.1016/j.spen.2025.101241
Chen, B. C., & Subramanian, S. (2025) · Annual International Conference of the IEEE Engineering in Medicine and Biology Society (EMBC) · doi:10.1109/embc58623.2025.11251724
Sleep Stage Detection from Actigraphy and Heart Rate Using an Attention-Based Model
Sorkhilalehloo, A., & Ghahjaverestan, N. M. (2025) · IEEE-EMBS International Conference on Biomedical and Health Informatics (BHI ...) · doi:10.1109/bhi67747.2025.11269520
A Sleep Staging Algorithm for Children Using PPG and IMU Sensors Based on the Imoo Watch Phone
Liang, J., Yang, Y., Feng, S., Chang, H., Peng, Z., Wang, X., & Cheng, H. (2025) · International Conference on Information Communication and Signal Processing (ICICSP) · doi:10.1109/icicsp66564.2025.11338472
Mechanistically Interpretable Wearable-Based Sleep Staging
Kadem, M., & Zheng, R. (2025) · 2025 IEEE Annual Congress on Artificial Intelligence of Things (AIoT) · doi:10.1109/aiot66900.2025.00055 · Cited by 2
Gautier, A. (2024) · theses.fr (ABES) · doi:10.70675/5827871fz5213z492ez9180z641a7bd710e5
A Grid-Search Framework for Dataset-Specific Calibration of Actigraphy Sleep Detection AlgorithmsPreprint
Rahjouei, A. (2026) · bioRxiv (Cold Spring Harbor Laboratory) · doi:10.64898/2026.04.07.706161
Sharma, M. D., Gupta, D., Telangore, H., Acharya, U. R., & Penzel, T. (2026) · Engineering Applications of Artificial Intelligence · doi:10.1016/j.engappai.2026.114855
Cantón, E., Tavella, F., Drake, C. L., Walch, O., & Cheng, P. (2026) · SLEEP Advances · doi:10.1093/sleepadvances/zpag051
Self-citationChen, P.-W., Cielo︎, C. M., Walch, O., Mcdonald, M., Song, P. X. ‐., Goldstein, C. A., Moreno, J. P., Jansen, E., & Mitchell, J. A. (2026) · medRxiv · doi:10.64898/2026.05.28.26354364
Self-citationWang, S., Yu, J., Yang, X., Liu, D., Bai, Q., Yu, J., Ding, S., Xu, Y., & Zhu, D. (2026) · Frontiers in Digital Health · doi:10.3389/fdgth.2026.1780166
How Wearable Technologies Generate Value in Older Adult Care: An Axiomatic Model
Vasquez, B. A., Maniago, J. D., Soriano, G. P., Elmido, J. J. G., & Calong, K. A. C. (2026) · Scandinavian Journal of Caring Sciences · doi:10.1111/scs.70283
Carter, M. M., Hua, R., O’Brien, M. K., Lee, H., Pitt, J. B., Kwon, S., Manworren, R. C. B., Chen, A., Edobor, A., Holl, J. L., et al. (2026) · Digital Health · doi:10.1177/20552076261453505
Lopes, L. R., Warncke, J. D., Filchenko, I., Shi, K., Bassetti, C. L., & Schaefer, C. (2026) · Journal of Sleep Research · doi:10.1111/jsr.70396
Sleep Diagnostics and Monitoring Technology in Obstructive Sleep Apnea
Lee‐Iannotti, J. K. (2026) · CONTINUUM Lifelong Learning in Neurology · doi:10.1212/cont.0000000000001721
A Multimodal Distillation Framework for Sound-Based Sleep Quality Assessment
Fukui, K., Lu, H., & Kato, T. (2026) · International Journal of Neural Systems · doi:10.1142/s0129065727500250
Tallal, U., Agrawal, R., & Kshirsagar, S. (2026) · Sensors · doi:10.3390/s26185746
Zhang, H., Ruan, G., Xiao, H., Shou, G., Sun, C., & Guan, Y. (2025) · Studies in computational intelligence · doi:10.1007/978-3-032-11999-5_11
Ibrahim, A., Ganglberger, W., Cesari, M., & Stefani, A. (2026) · Sleep Medicine Clinics · doi:10.1016/j.jsmc.2026.08.012
Chen, Z., ZHOU, M., Ma, Y., & Chen, X. (2026) · Journal of Mechanics in Medicine and Biology · doi:10.1142/s0219519426401214
Cross-Dataset Wearable Sleep Staging under Source-Only and Target-Normalized Conditions
Fei, Y., Shen, C., & Xiao, F. (2026) · International Conference on Computer Network, Electronic and Automation (ICCNEA) · doi:10.1109/iccnea70678.2026.11722303
Server-Related Security Bottlenecks and Data Availability in Wearables: A Case Study
Milošević, M., & Miljković, N. (2026) · International Conference on Electrical, Electronic and Computing Engineering (IcETRAN) · doi:10.1109/icetran71739.2026.11727784
Verma, P., & Pallavi, V. (2026) · Asian Journal of Research in Pharmaceutical Sciences · doi:10.52711/2231-5659.2026.00056
Metadata
- Authors
- Walch, O., Huang, Y., Forger, D., & Goldstein, C.
- Affiliations
- University of Michigan (US)
- Dartmouth College (US)
- Corresponding author
- Walch, Olivia
- Venue
- Sleep
- Publisher
- Oxford University Press (OUP)
- Published
- 2019-08-13
- Volume
- 42
- Issue
- 12
- ISSN
- 0161-8105 (ISSN-L)
- 1550-9109
- PMC
- PMC6930135
- OpenAlex
- W2937191485
- Cited by
- 240
- References
- 56
- Citations by year
- 2026: 20 · 2025: 42 · 2024: 33 · 2023: 38 · 2022: 39 · 2021: 40 · 2020: 28
- FWCI
- 9.43
- Type
- journal article
- Language
- en
- Open access
- hybrid
- doi.org
- Licence
- Locations
- SLEEP (publishedVersion, cc-by-nc)
- PubMed Central (publishedVersion, cc-by-nc)
- PubMed (publishedVersion)
- Smith ScholarWorks (Smith College) (submittedVersion, cc-by-nc)
- Funders
- Exercise & Sport Science Initiative University of Michigan (U056400, U049702, NSF DMS 1714094)
- Topics
- Physical Sciences › Engineering › Biomedical Engineering › Non-Invasive Vital Sign Monitoring
- Physical Sciences › Computer Science › Computer Vision and Pattern Recognition › Context-Aware Activity Recognition Systems
- Social Sciences › Psychology › Experimental and Cognitive Psychology › Sleep and related disorders
- Keywords
- wearable devices, Apple Watch, accelerometry, photoplethysmography, heart rate, sleep-wake classification, NREM sleep, REM sleep, polysomnography, artificial neural networks, classifier comparison, MESA, cross-dataset generalization
- MeSH terms
- Acceleration, Wearable Electronic Devices, Adult, Algorithms, Data Interpretation, Statistical, Electroencephalography, Female, Forecasting, Heart Rate, Humans, Male, Middle Aged, Sleep Stages, Photoplethysmography, Polysomnography, Young Adult
About these checks
Registry, retraction, Cites and statistics results are computed, not judged, with one exception: a printed reference that no index lists is read once by a model before it counts as a citation error. Claims are extracted by a model and kept only when their quote appears verbatim in the text; each cited source is then checked, with a model’s help, for whether it says what the claim relies on. Those verdicts can be wrong — read the claim’s quote and the cited source before relying on one.
Statistics and arithmetic are recomputed, not judged.
Confidence bands are shown only for fields calibrated on our annotated test set. None is calibrated yet, so no band is shown.
What counts as a claim ›How we measure confidence ›How we check this ›
Are you an author, or do you see a problem with this page? Request a review
