

The DOI matches its Crossref record; 6 of the 6 references it cites were found in a registry or an index.
Fibromyalgia patients with elevated levels of anti–satellite glia cell immunoglobulin G antibodies present with more severe symptoms
Open accessAbstract
Transferring fibromyalgia patient immunoglobulin G (IgG) to mice induces pain-like behaviour, and fibromyalgia IgG binds mouse and human satellite glia cells (SGCs). These findings suggest that autoantibodies could be part of fibromyalgia pathology. However, it is unknown how frequently fibromyalgia patients have anti-SGC antibodies and how anti-SGC antibodies associate with disease severity. Here, we quantified serum or plasma anti-SGC IgG levels in 2 fibromyalgia cohorts from Sweden and Canada using an indirect immunofluorescence murine cell culture assay. Fibromyalgia serum IgG binding to human SGCs in human dorsal root ganglia tissue sections was also assessed by immunofluorescence. In the cell culture assay, anti-SGC IgG levels were increased in both fibromyalgia cohorts compared with control group. Elevated anti-SGC IgG was associated with higher levels of self-reported pain in both cohorts, and higher fibromyalgia impact questionnaire scores and increased pressure sensitivity in the Swedish cohort. Anti-SGC IgG levels were not associated with fibromyalgia duration. Swedish fibromyalgia (FM) patients were clustered into FM-severe and FM-mild groups, and the FM-severe group had elevated anti-SGC IgG compared with the FM-mild group and control group. Anti-SGC IgG levels detected in culture positively correlated with increased binding to human SGCs. Moreover, the FM-severe group had elevated IgG binding to human SGCs compared with the FM-mild and control groups. These results demonstrate that a subset of fibromyalgia patients have elevated levels of anti-SGC antibodies, and the antibodies are associated with more severe fibromyalgia symptoms. Screening fibromyalgia patients for anti-SGC antibodies could provide a path to personalized treatment options that target autoantibodies and autoantibody production.
Overview
The claims and statistics of this paper haven’t been checked yet.
Run the check — free, no account needed. It reads the open-access text and checks the sources it cites.
Integrity signals
Registry
Cites
Statistics
Figures
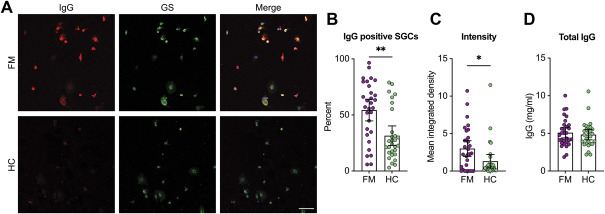
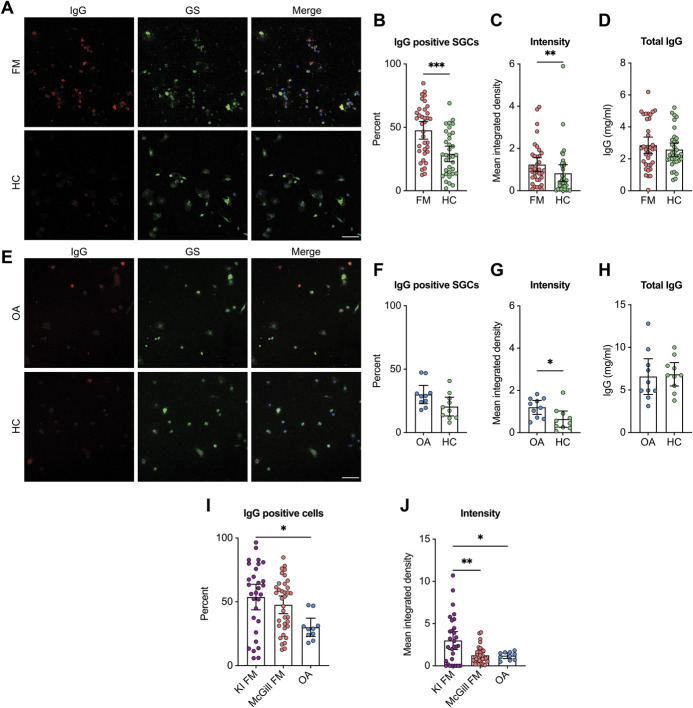
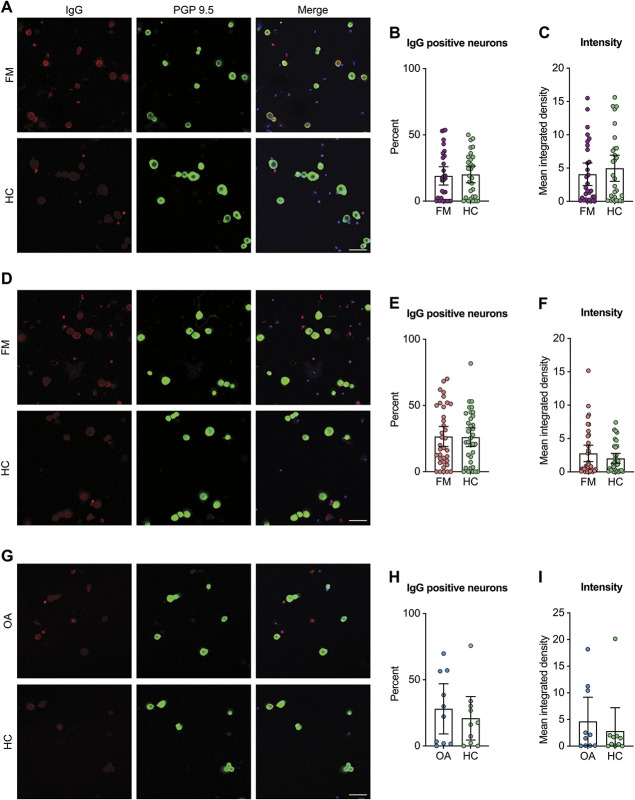
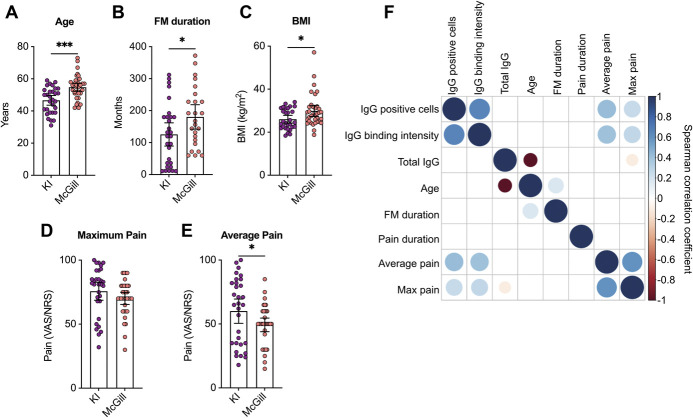
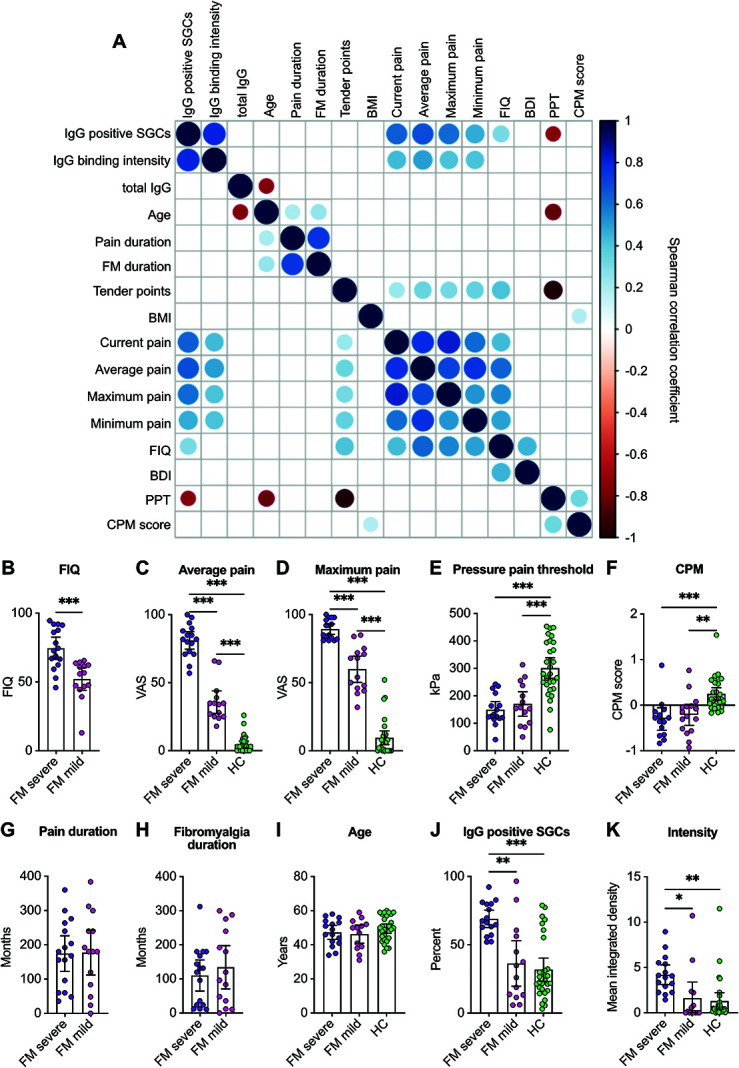
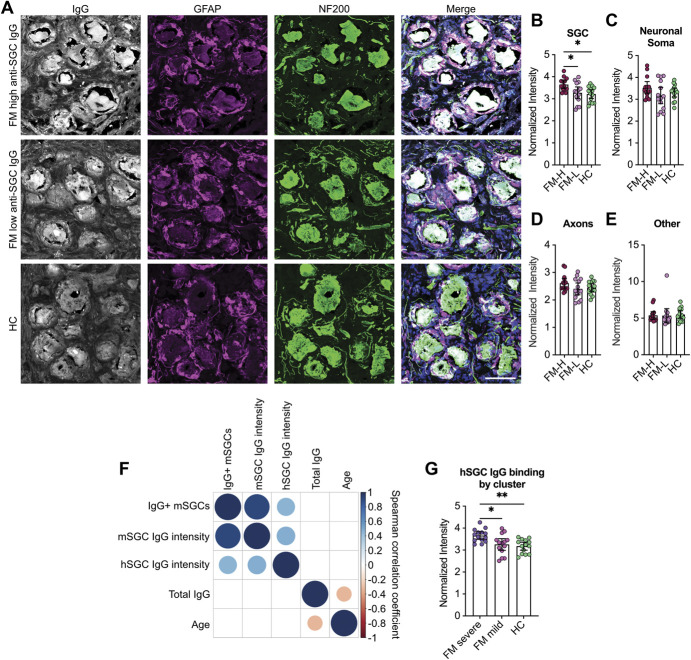
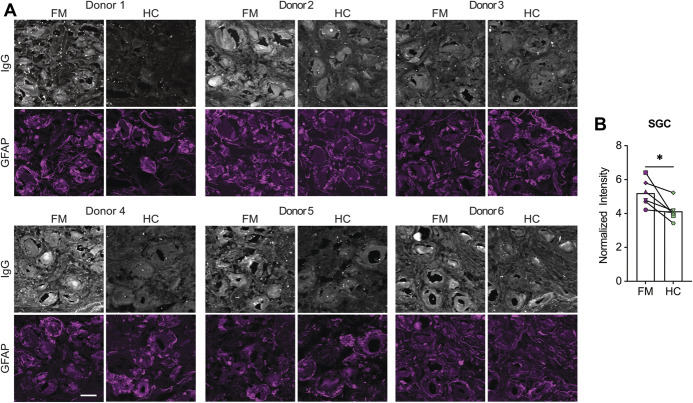
Verification
Claims the paper makes
The claims and statistics of this paper haven’t been checked yet.
Run the check — free, no account needed. It reads the open-access text and checks the sources it cites.
Claims other papers make about this one
Each is checked against this paper’s own text: does it say what the citing paper says it does?
The cited source says what the claim attributes to it.
In the citing paper
“Emerson Krock et al. confirmed these findings in human samples and further demonstrated a positive correlation between anti-satellite IgG levels and pain intensity in FMS”
From Nociplastic pain: the prominent role of non-neuronal cells in central and peripheral sensitization (2026) · cites this paper as [112]
Self-check
Percentages, sums and reported differences re-computed from the paper’s own numbers.
The self-check needs the paper’s full text.
Citations
Cites
Fibromyalgia: A Clinical Review
Clauw, D. J. (2014) · JAMA · doi:10.1001/jama.2014.3266 · Cited by 1,674
Nociplastic pain: towards an understanding of prevalent pain conditions
Fitzcharles, M.-A., Cohen, S. P., Clauw, D. J., Littlejohn, G., Usui, C., & Häuser, W. (2021) · The Lancet · doi:10.1016/s0140-6736(21)00392-5 · Cited by 1,253
Giesecke, T., Williams, D. A., Harris, R. E., Cupps, T. R., Tian, X., Tian, T. X., Gracely, R. H., & Clauw, D. J. (2003) · Arthritis & Rheumatism · doi:10.1002/art.11272 · Cited by 424
Passive transfer of fibromyalgia symptoms from patients to mice
Goebel, A., Krock, E., Gentry, C., Israel, M. R., Jurczak, A., Urbina, C. M., Sandor, K., Vastani, N., Maurer, M., Cuhadar, U., et al. (2021) · Journal of Clinical Investigation · doi:10.1172/jci144201 · Cited by 278
Self-citationReduction of skin innervation is associated with a severe fibromyalgia phenotype
Evdokimov, D., Frank, J., Klitsch, A., Unterecker, S., Warrings, B., Serra, J., Papagianni, A., Saffer, N., Meyer zu Altenschildesche, C., Kampik, D., et al. (2019) · Annals of Neurology · doi:10.1002/ana.25565 · Cited by 152
Pain and fatigue variability patterns distinguish subgroups of Fibromyalgia patients
Bartley, E. J., Robinson, M. E., & Staud, R. (2018) · The Journal of Pain · doi:10.1016/j.jpain.2017.11.014 · Cited by 83 · cited 1×
“Numerous studies have clustered FM patients based on pain reports, and cognitive and psychological questionnaires.(3,8,16,52) In addition, 60% of FM patients”
Background
Research works printed but not linked: 45
- Avraham, 2022, Profiling the molecular signature of satellite glial cells at the single cell level reveals high similarities between rodents and humans, PAIN, 163, 2348, 10.1097/j.pain.0000000000002628 · DOI
- Barsotti, 2018, Current treatment for myositis, Curr Treat Options Rheumatol, 4, 299, 10.1007/s40674-018-0106-2 · DOI
- Bersellini Farinotti, 2019, Cartilage-binding antibodies induce pain through immune complex-mediated activation of neurons, J Exp Med, 216, 1904, 10.1084/jem.20181657 · DOI · Paper page
- Berwick, 2021, A systematic review into the influence of temperature on fibromyalgia pain: meteorological studies and quantitative sensory testing, J Pain, 22, 473, 10.1016/j.jpain.2020.12.005 · DOI
- Blum, 2014, Systemic inflammation alters satellite glial cell function and structure. A possible contribution to pain, Neuroscience, 274, 209, 10.1016/j.neuroscience.2014.05.029 · DOI
- Braun, 2020, Clustering fibromyalgia patients: a combination of psychosocial and somatic factors leads to resilient coping in a subgroup of fibromyalgia patients, PLoS One, 15, e0243806, 10.1371/journal.pone.0243806 · DOI
- Cesare Mannelli, 2013, Morphologic features and glial activation in rat oxaliplatin-dependent neuropathic pain, J Pain, 14, 1585, 10.1016/j.jpain.2013.08.002 · DOI
- Cuhadar, 2019, Autoantibodies produce pain in complex regional pain syndrome by sensitizing nociceptors, PAIN, 160, 2855, 10.1097/j.pain.0000000000001662 · DOI · Paper page
- Fanton, 2022, The translocator protein gene is associated with endogenous pain modulation and the balance between glutamate and γ-aminobutyric acid in fibromyalgia and healthy subjects: a multimodal neuroimaging study, PAIN, 163, 274, 10.1097/j.pain.0000000000002309 · DOI
- Gendelman, 2018, Time to diagnosis of fibromyalgia and factors associated with delayed diagnosis in primary care, Best Pract Res Clin Rheumatol, 32, 489, 10.1016/j.berh.2019.01.019 · DOI
- Guo, 2020, Complex regional pain syndrome patient immunoglobulin M has pronociceptive effects in the skin and spinal cord of tibia fracture mice, PAIN, 161, 797, 10.1097/j.pain.0000000000001765 · DOI
- Hanani, 2005, Satellite glial cells in sensory ganglia: from form to function, Brain Res Rev, 48, 457, 10.1016/j.brainresrev.2004.09.001 · DOI
- Hanani, 2014, Satellite glial cells in dorsal root ganglia are activated in streptozotocin-treated rodents, J Cell Mol Med, 18, 2367, 10.1111/jcmm.12406 · DOI
- Hedin, 1995, The Fibromyalgia Impact Questionnaire, a Swedish translation of a new tool for evaluation of the fibromyalgia patient, Scand J Rheumatol, 24, 69, 10.3109/03009749509099287 · DOI
- Hunt, 2022, DRGquant: a new modular AI-based pipeline for 3D analysis of the DRG, J Neurosci Methods, 371, 109497, 10.1016/j.jneumeth.2022.109497 · DOI
- Hurtig, 2001, Quantitative sensory testing in fibromyalgia patients and in healthy subjects: identification of subgroups, Clin J Pain, 17, 316, 10.1097/00002508-200112000-00005 · DOI
- Jager, 2018, Isolation of satellite glial cells for high-quality RNA purification, J Neurosci Methods, 297, 1, 10.1016/j.jneumeth.2018.01.001 · DOI
- Jurczak, 2022, Antibody-induced pain-like behavior and bone erosion: links to subclinical inflammation, osteoclast activity, and acid-sensing ion channel 3–dependent sensitization, PAIN, 163, 1542, 10.1097/j.pain.0000000000002543 · DOI
- Kosek, 2021, Chronic nociplastic pain affecting the musculoskeletal system: clinical criteria and grading system, PAIN, 162, 2629, 10.1097/j.pain.0000000000002324 · DOI
- Kosek, 1996, Sensory dysfunction in fibromyalgia patients with implications for pathogenic mechanisms, PAIN, 68, 375, 10.1016/S0304-3959(96)03188-0 · DOI · Paper page
- Kosek, 1993, A comparison of pressure pain thresholds in different tissues and body regions. Long-term reliability of pressure algometry in healthy volunteers, Scand J Rehabil Med, 25, 117, 10.2340/165019771993117124 · DOI
- Krock, 2014, Painful, degenerating intervertebral discs up-regulate neurite sprouting and CGRP through nociceptive factors, J Cell Mol Med, 18, 1213, 10.1111/jcmm.12268 · DOI
- Li, 2014, Autoimmunity contributes to nociceptive sensitization in a mouse model of complex regional pain syndrome, PAIN, 155, 2377, 10.1016/j.pain.2014.09.007 · DOI
- Lundberg, 2018, Classification of myositis, Nat Rev Rheumatol, 14, 269, 10.1038/nrrheum.2018.41 · DOI
- Malin, 2007, Production of dissociated sensory neuron cultures and considerations for their use in studying neuronal function and plasticity, Nat Protoc, 2, 152, 10.1038/nprot.2006.461 · DOI
- Malmstrom, 2017, The immunopathogenesis of seropositive rheumatoid arthritis: from triggering to targeting, Nat Rev Immunol, 17, 60, 10.1038/nri.2016.124 · DOI
- Mangus, 2019, SIV-induced immune activation and metabolic alterations in the dorsal root ganglia during acute infection, J Neuropathol Exp Neurol, 78, 78, 10.1093/jnen/nly111 · DOI
- Miller, 2002, Glutamine-glutamine synthetase-glutamate dehydrogenase- and pyruvate carboxylase-immunoreactivities in the rat dorsal root ganglion and peripheral nerve, Brain Res, 945, 202, 10.1016/S0006-8993(02)02802-0 · DOI
- Nascimento, 2014, Satellite glial cells surrounding primary afferent neurons are activated and proliferate during monoarthritis in rats: is there a role for ATF3?, PLoS One, 9, e108152, 10.1371/journal.pone.0108152 · DOI
- Nguyen, 2021, Single-nucleus transcriptomic analysis of human dorsal root ganglion neurons, Elife, 10, e71752, 10.7554/eLife.71752 · DOI
- Poulsen, 2014, Primary culture of trigeminal satellite glial cells: a cell-based platform to study morphology and function of peripheral glia, Int J Physiol Pathophysiol Pharmacol, 6, 1
- Rostock, 2018, Human vs. mouse nociceptors—similarities and differences, Neuroscience, 387, 13, 10.1016/j.neuroscience.2017.11.047 · DOI
- Satoh, 2017, A comprehensive overview on myositis-specific antibodies: new and old biomarkers in idiopathic inflammatory myopathy, Clin Rev Allergy Immunol, 52, 1, 10.1007/s12016-015-8510-y · DOI
- Serra, 2014, Hyperexcitable C nociceptors in fibromyalgia, Ann Neurol, 75, 196, 10.1002/ana.24065 · DOI · Paper page
- Stephenson, 1995, GFAP immunoreactivity in trigeminal ganglion satellite cells after tooth injury in rats, Exp Neurol, 131, 11, 10.1016/0014-4886(95)90003-9 · DOI
- Stringer, 2021, Cellpose: a generalist algorithm for cellular segmentation, Nat Methods, 18, 100, 10.1038/s41592-020-01018-x · DOI · Paper page
- Su, 2022, Pain-like behavior in the collagen antibody-induced arthritis model is regulated by lysophosphatidic acid and activation of satellite glia cells, Brain Behav Immun, 101, 214, 10.1016/j.bbi.2022.01.003 · DOI
- Theoharides, 2019, Mast cells, neuroinflammation and pain in fibromyalgia syndrome, Front Cell Neurosci, 13, 353, 10.3389/fncel.2019.00353 · DOI
- Thompson, 1983, PGP 9.5—a new marker for vertebrate neurons and neuroendocrine cells, Brain Res, 278, 224, 10.1016/0006-8993(83)90241-X · DOI
- Verma, 2022, Unbiased immune profiling reveals a natural killer cell-peripheral nerve axis in fibromyalgia, PAIN, 163, e821, 10.1097/j.pain.0000000000002498 · DOI
- Wang, 2019, Neuronal FcγRI mediates acute and chronic joint pain, J Clin Invest, 129, 3754, 10.1172/JCI128010 · DOI
- Wang, 2019, A novel primary culture method for high-purity satellite glial cells derived from rat dorsal root ganglion, Neural Regen Res, 14, 339, 10.4103/1673-5374.244797 · DOI
- Warwick, 2013, The contribution of satellite glial cells to chemotherapy-induced neuropathic pain, Eur J Pain, 17, 571, 10.1002/j.1532-2149.2012.00219.x · DOI
- Wigerblad, 2016, Autoantibodies to citrullinated proteins induce joint pain independent of inflammation via a chemokine-dependent mechanism, Ann Rheum Dis, 75, 730, 10.1136/annrheumdis-2015-208094 · DOI
- Yim, 2017, Identifying fibromyalgia subgroups using cluster analysis: relationships with clinical variables, Eur J Pain, 21, 374, 10.1002/ejp.935 · DOI
Cited by
Sorted by citations
B cells drive neuropathic pain–related behaviors in mice through IgG–Fc gamma receptor signaling
Lacagnina, M. J., Willcox, K. F., Boukelmoune, N., Bavencoffe, A., Sankaranarayanan, I., Barratt, D. T., Zuberi, Y. A., Dayani, D., Chavez, M. V., Lu, J. T., et al. (2024) · Science Translational Medicine · doi:10.1126/scitranslmed.adj1277 · Cited by 60
Self-citationJakobsson, J. E., Menezes, J., Krock, E., Hunt, M. A., Carlsson, H., Vaivade, A., Emami Khoonsari, P., Agalave, N. M., Sandström, A., Kadetoff, D., et al. (2025) · The Journal of Pain · doi:10.1016/j.jpain.2025.105331 · Cited by 9
Self-citationNociplastic pain: the prominent role of non-neuronal cells in central and peripheral sensitization
Lai, W., Tang, X., Chen, S., Zhou, Y., Qi, Z., Cao, M., Yuan, C., Yu, J., & Wen, C. (2026) · Frontiers in Immunology · doi:10.3389/fimmu.2026.1677310 · Cited by 4
B-cell and plasma cell activation in a mouse model of chronic muscle pain
Lenert, M. E., Green, A. R., Merriwether, E. N., & Burton, M. D. (2024) · Neurobiology of Pain · doi:10.1016/j.ynpai.2024.100169 · Cited by 4
Metadata
- Authors
- Krock, E., Morado-Urbina, C. E., Menezes, J., Hunt, M. A., Sandström, A., Kadetoff, D., Tour, J., Verma, V., Kultima, K., Haglund, L., Meloto, C. B., Diatchenko, L., Kosek, E., & Svensson, C. I.
- Affiliations
- Karolinska Institutet (SE)
- Harvard University (US)
- McGill University (CA)
- Uppsala University (SE)
- Corresponding author
- Svensson, Camilla I.
- ORCID
- Venue
- Pain
- Published
- 2023-03-22
- Volume
- 164
- Issue
- 8
- Pages
- 1828-1840
- ISSN
- 0304-3959 (ISSN-L)
- 1872-6623
- PMC
- PMC10348624
- OpenAlex
- W4328048178
- Cited by
- 84
- References
- 6
- Citations by year
- 2026: 21 · 2025: 40 · 2024: 17 · 2023: 5
- FWCI
- 16.90
- Type
- journal article
- Language
- en
- Open access
- hybrid
- doi.org
- Locations
- Pain (publishedVersion, cc-by)
- PubMed Central (publishedVersion, cc-by)
- PubMed (publishedVersion)
- Funders
- Pfizer
- European Commission (2007–2013, FP7 2007-2013, HORIZON2020, FP7/2007, 764860, 602919)
- Canada Excellence Research Chairs, Government of Canada (CERC09)
- Karolinska Institutet
- Knut och Alice Wallenbergs Stiftelse (018.0161)
- Stockholms Läns Landsting
- Vetenskapsrådet (542-2013-8373, FP7/2007-2013, 2016-01556, 2013-08373)
- Reumatikerförbundet
- Foundation for Research in Rheumatology
- Pfizer Canada
- Canadian Institutes of Health Research (145102_1, CERC09)
- H2020 European Research Council (866075)
- Topics
- Health Sciences › Medicine › Psychiatry and Mental health › Fibromyalgia and Chronic Fatigue Syndrome Research
- Health Sciences › Medicine › Physiology (medical) › Pain Mechanisms and Treatments
- Health Sciences › Medicine › Psychiatry and Mental health › Psychosomatic Disorders and Their Treatments
- Keywords
- fibromyalgia, autoantibodies, disease severity, pressure sensitivity, dorsal root ganglia, IgG, Fibromyalgia Impact Questionnaire, autoantibody detection, personalized treatment
- MeSH terms
- Animals, Autoantibodies, Fibromyalgia, Humans, Immunoglobulin G, Pain, Surveys and Questionnaires, Mice
About these checks
Registry, retraction, Cites and statistics results are computed, not judged, with one exception: a printed reference that no index lists is read once by a model before it counts as a citation error. Claims are extracted by a model and kept only when their quote appears verbatim in the text; each cited source is then checked, with a model’s help, for whether it says what the claim relies on. Those verdicts can be wrong — read the claim’s quote and the cited source before relying on one.
Statistics and arithmetic are recomputed, not judged.
Confidence bands are shown only for fields calibrated on our annotated test set. None is calibrated yet, so no band is shown.
What counts as a claim ›How we measure confidence ›How we check this ›
Are you an author, or do you see a problem with this page? Request a review
