Student or educator? Sign up with your school email and get 6 months of Pro free.
Cited by 0Bacterial Genetics and BiotechnologyGenomics and Chromatin DynamicsDNA Repair Mechanisms

The DOI matches its Crossref record; 51 of the 51 references it cites were found in a registry or an index.

The Bacillus subtilis putative LysR-type transcriptional regulator YybE and its connection to chromosome replication and segregation

Open access
Koh, Alan·2026·Access Microbiology

Published version of a preprint

Abstract

Duplication and segregation of genetic material are vital for cell proliferation. Deletion of DNA replication regulators, such as YabA and ParA, leads to over-initiation of DNA replication. However, the viability of the ΔyabA ΔparA double mutant suggests additional regulatory mechanisms. Using a transposon mutagenesis library, yybE was identified as a potential candidate. Bioinformatic analysis of yybE suggests that it encodes a putative LysR-type transcriptional regulator (LTTR). LTTRs are established regulators of metabolic processes, leading to the hypothesis that YybE might link metabolic processes to DNA replication. However, under the tested conditions, deletion of yybE did not result in detectable changes to DNA replication frequency, origin segregation or chromosome morphology.

Overview

The claims and statistics of this paper haven’t been checked yet.

Run the check — free, no account needed. It reads the open-access text and checks the sources it cites.

A few free checks a day · papers already verified open instantly · results are public

Integrity signals

Registry

Crossref · 10.1099/acmi.0.001000.v4

Cites

51 of 51 references verified0 citation errors · 0 not checkable

Statistics

Figures

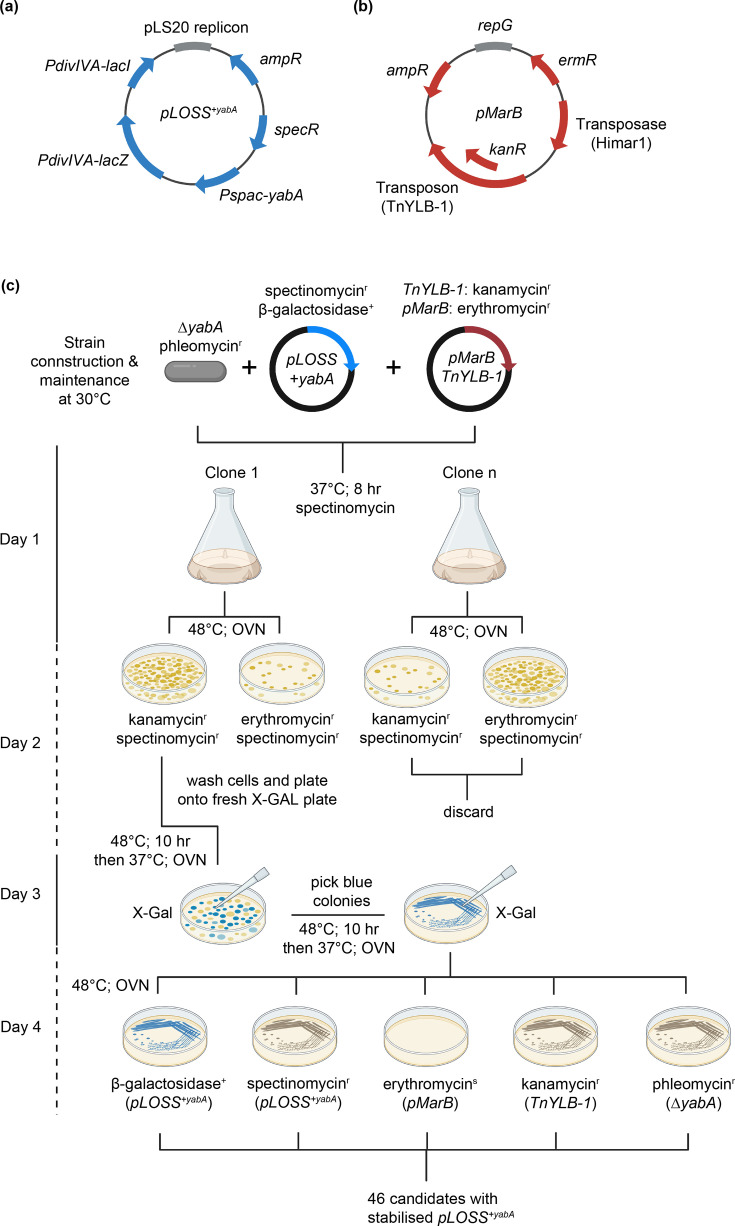
Fig. 1. Synthetic lethal screen. (a) The pLOSS plasmid carries the yabA gene under the IPTG-inducible Pspac promoter and constitutively expresses β-galactosidase (lacZ gene) from the PdivIVA promoter. (b) The pMarB plasmid carries the transposase (Himar1) and transposon (TnYLB-1). (c) Schematic of the synthetic lethal screen. Details are provided in the ‘Experimental procedures’ section. OVN denotes overnight incubation.
Fig. 1. Synthetic lethal screen. (a) The pLOSS plasmid carries the yabA gene under the IPTG-inducible Pspac promoter and constitutively expresses β-galactosidase (lacZ gene) from the PdivIVA promoter. (b) The pMarB plasmid carries the transposase (Himar1) and transposon (TnYLB-1). (c) Schematic of the synthetic lethal screen. Details are provided in the ‘Experimental procedures’ section. OVN denotes overnight incubation.CC BY · PubMed Central
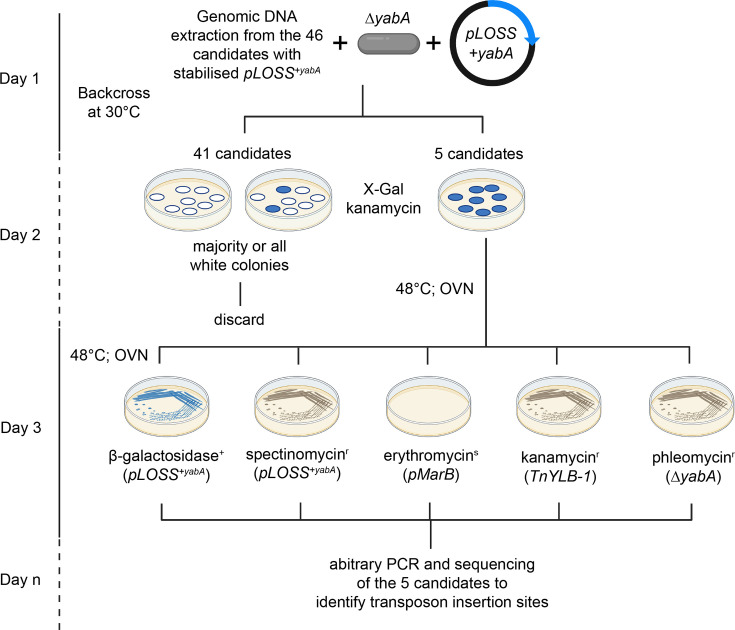
Fig. 2. Validation of candidates from the synthetic lethal screen. Schematic of the validation steps taken after the isolation of candidates from the synthetic lethal screen. Validated candidates undergo arbitrary PCR and sequencing to identify transposon insertion sites. Details are provided in the ‘Experimental procedures’ section. OVN denotes overnight incubation.
Fig. 2. Validation of candidates from the synthetic lethal screen. Schematic of the validation steps taken after the isolation of candidates from the synthetic lethal screen. Validated candidates undergo arbitrary PCR and sequencing to identify transposon insertion sites. Details are provided in the ‘Experimental procedures’ section. OVN denotes overnight incubation.CC BY · PubMed Central
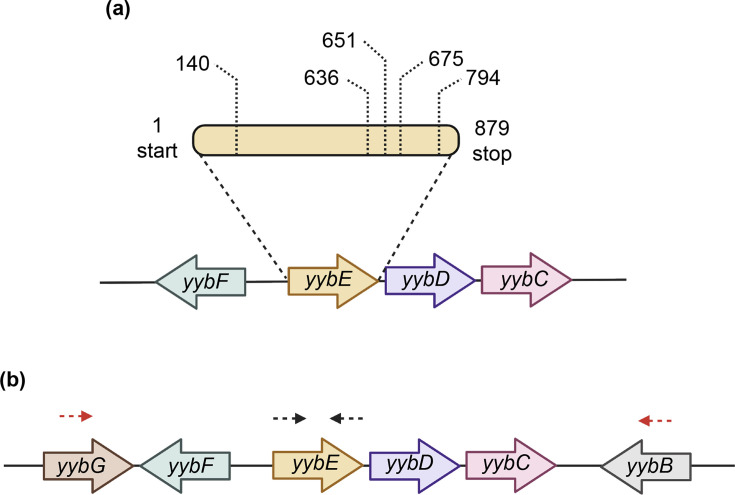
Fig. 3. Identification of YybE as a candidate. (a) Transposon insertions were mapped within the uncharacterized gene yybE at positions 140, 636, 651, 675 and 794. Schematic of the genomic neighbourhood of yybE. yybE forms an operon with yybD and yybC and lies upstream of yybF on the opposite strand. (b) Location of primer pairs designed to confirm transposon insertions within yybE. oAK3A/oAK4A amplifies the entire yybE ORF (black arrow), while oAK3B/oAK4B amplifies the region, including yybF, yybE, yybD and yybC (red arrow).
Fig. 3. Identification of YybE as a candidate. (a) Transposon insertions were mapped within the uncharacterized gene yybE at positions 140, 636, 651, 675 and 794. Schematic of the genomic neighbourhood of yybE. yybE forms an operon with yybD and yybC and lies upstream of yybF on the opposite strand. (b) Location of primer pairs designed to confirm transposon insertions within yybE. oAK3A/oAK4A amplifies the entire yybE ORF (black arrow), while oAK3B/oAK4B amplifies the region, including yybF, yybE, yybD and yybC (red arrow).CC BY · PubMed Central
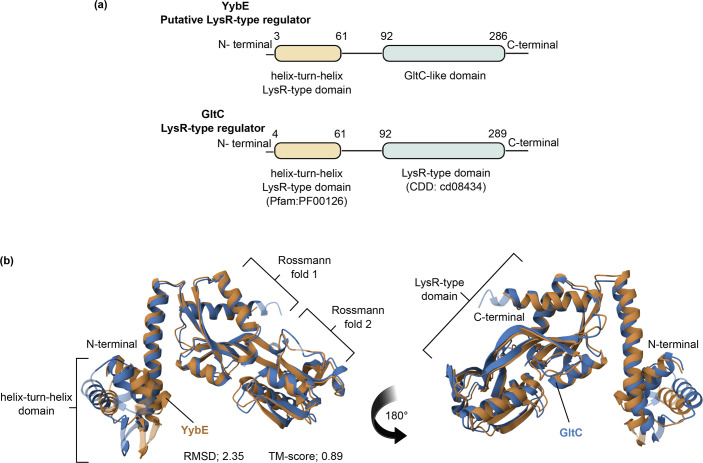
Fig. 4. Functional domain prediction and structural alignment of YybE. (a) Functional domain analysis predicts that YybE contains a helix-turn-helix domain (Pfam: PF00126) from residues 3 to 61 and a GltC-like domain (CDD: cd08434) from residues 92 to 286. Identification of functional domains was performed by InterPro. (b) The structure of YybE (orange) was superimposed onto GltC (blue) revealing a high degree of similarity between the two proteins (RMSD, 2.35; and TM-score, 0.89). Structural alignment was analysed by the RCSB PDB Pairwise Structure Alignment tool using protein homology models generated by AlphaFold (YybE, AF-P37499-F1-v4; and GltC, AF-P20668-F1-v4).
Fig. 4. Functional domain prediction and structural alignment of YybE. (a) Functional domain analysis predicts that YybE contains a helix-turn-helix domain (Pfam: PF00126) from residues 3 to 61 and a GltC-like domain (CDD: cd08434) from residues 92 to 286. Identification of functional domains was performed by InterPro. (b) The structure of YybE (orange) was superimposed onto GltC (blue) revealing a high degree of similarity between the two proteins (RMSD, 2.35; and TM-score, 0.89). Structural alignment was analysed by the RCSB PDB Pairwise Structure Alignment tool using protein homology models generated by AlphaFold (YybE, AF-P37499-F1-v4; and GltC, AF-P20668-F1-v4).CC BY · PubMed Central
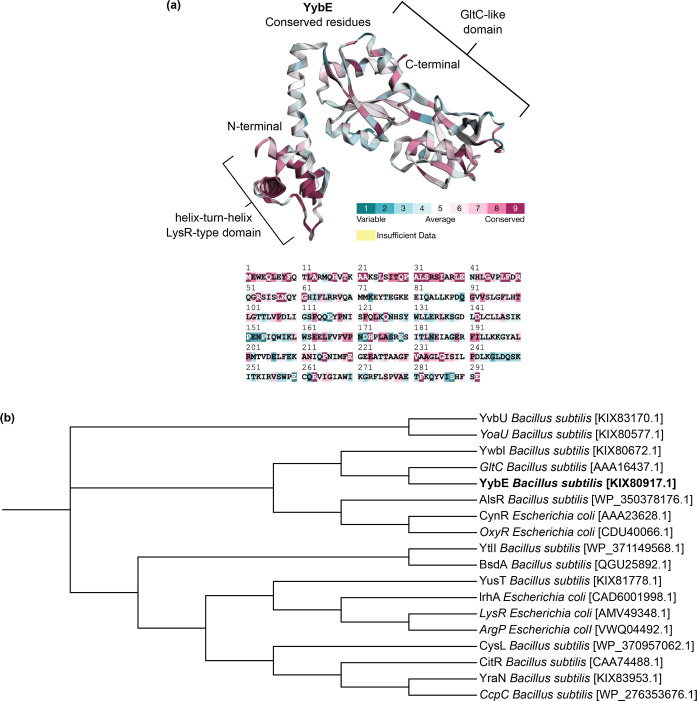
Fig. 5. Conservation and phylogenetic analysis of YybE. (a) The conservation of amino acid residues in YybE was mapped onto its protein structure with conservation scores ranging from 1 (variable, cyan) to 9 (highly conserved, dark red). Highly conserved residues are located across the DNA-binding domain (HTH-domain) and regulatory domain (LysR-type domain). Evolutionary conservation was analysed by Consurf and mapped onto the structure generated by AlphaFold (YybE: AF-P37499-F1-v4). (b) Phylogenetic analysis of YybE (highlighted in bold) clusters it within the LysR-type family of transcriptional regulators. A phylogenetic tree was visualized with iTOL using sequence alignment performed by MAFFT.
Fig. 5. Conservation and phylogenetic analysis of YybE. (a) The conservation of amino acid residues in YybE was mapped onto its protein structure with conservation scores ranging from 1 (variable, cyan) to 9 (highly conserved, dark red). Highly conserved residues are located across the DNA-binding domain (HTH-domain) and regulatory domain (LysR-type domain). Evolutionary conservation was analysed by Consurf and mapped onto the structure generated by AlphaFold (YybE: AF-P37499-F1-v4). (b) Phylogenetic analysis of YybE (highlighted in bold) clusters it within the LysR-type family of transcriptional regulators. A phylogenetic tree was visualized with iTOL using sequence alignment performed by MAFFT.CC BY · PubMed Central
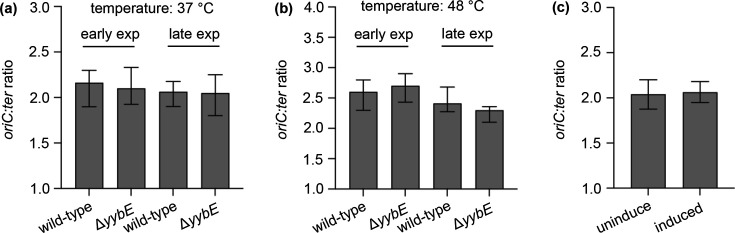
Fig. 6. Normal frequency of DNA replication initiation in the yybE mutant. The frequency of DNA replication initiation was not affected (a) under the different growth phases (early and late exponential phase), (b) temperatures (37 °C and 48 °C) and (c) overexpression of yybE. Overexpression was achieved by induction with 1% xylose. The oriC:ter ratio was determined by quantitative PCR.
Fig. 6. Normal frequency of DNA replication initiation in the yybE mutant. The frequency of DNA replication initiation was not affected (a) under the different growth phases (early and late exponential phase), (b) temperatures (37 °C and 48 °C) and (c) overexpression of yybE. Overexpression was achieved by induction with 1% xylose. The oriC:ter ratio was determined by quantitative PCR.CC BY · PubMed Central
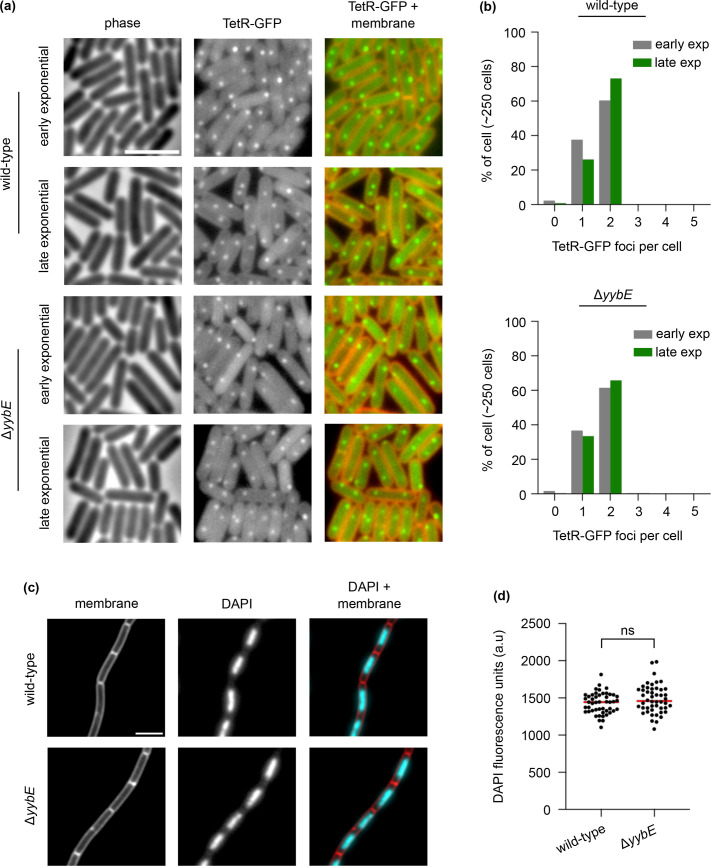
Fig. 7. Normal chromosome origin segregation and chromosome organization in the YybE mutant. (a) Origin localization in a wild-type strain and a yybE mutant during the early and late exponential growth phases. The origin region was labelled with a tetO array (~150 operator sites) bound by TetR-GFP. Phase contrast (left panel), TetR-GFP (middle panel) and membrane dye FM 5-95 overlayed with TetR-GFP (right panel). (b) The majority of cells have two origins per cell, regardless of growth phase. (c) DAPI staining of chromosomal DNA. Membrane dye FM 5-95 (left panel), DAPI stain (middle panel) and membrane dye overlayed with DAPI staining (right panel). (d) DAPI fluorescence intensity remains unchanged in the yybE mutant, n=50 cells. Median intensities are indicated with red lines, together with P-values of an unpaired, two-sided t-test; ns, not significant. Scale bar, 3 µm.
Fig. 7. Normal chromosome origin segregation and chromosome organization in the YybE mutant. (a) Origin localization in a wild-type strain and a yybE mutant during the early and late exponential growth phases. The origin region was labelled with a tetO array (~150 operator sites) bound by TetR-GFP. Phase contrast (left panel), TetR-GFP (middle panel) and membrane dye FM 5-95 overlayed with TetR-GFP (right panel). (b) The majority of cells have two origins per cell, regardless of growth phase. (c) DAPI staining of chromosomal DNA. Membrane dye FM 5-95 (left panel), DAPI stain (middle panel) and membrane dye overlayed with DAPI staining (right panel). (d) DAPI fluorescence intensity remains unchanged in the yybE mutant, n=50 cells. Median intensities are indicated with red lines, together with P-values of an unpaired, two-sided t-test; ns, not significant. Scale bar, 3 µm.CC BY · PubMed Central
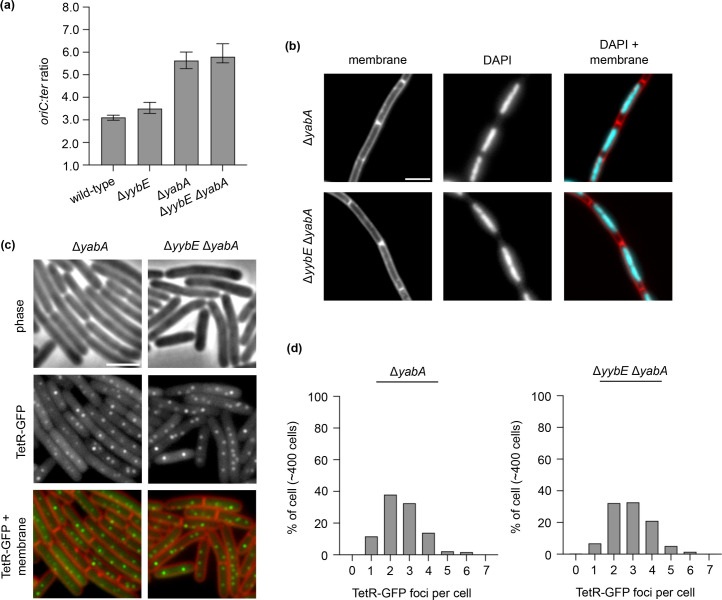
Fig. 8. DNA replication initiation frequency, chromosome organization and chromosome origin segregation were not disrupted in the yybE yabA mutant. (a) The frequency of DNA replication initiation was not affected. The oriC:ter ratio was determined by quantitative PCR. (b) DAPI staining of chromosomal DNA indicates that chromosome organization was not affected. Membrane dye FM 5-95 (left panel), DAPI stain (middle panel) and membrane dye overlayed with DAPI staining (right panel). (c) The origin localization of the mutants. Origin region was labelled with an array of tetO operators bound by TetR-GFP. Phase contrast (top panel), TetR-GFP (middle panel) and membrane dye FM 5-95 overlayed with TetR-GFP (bottom panel). (d) YabA dependent increase in the number of origins per cell. Scale bar, 3 µm.
Fig. 8. DNA replication initiation frequency, chromosome organization and chromosome origin segregation were not disrupted in the yybE yabA mutant. (a) The frequency of DNA replication initiation was not affected. The oriC:ter ratio was determined by quantitative PCR. (b) DAPI staining of chromosomal DNA indicates that chromosome organization was not affected. Membrane dye FM 5-95 (left panel), DAPI stain (middle panel) and membrane dye overlayed with DAPI staining (right panel). (c) The origin localization of the mutants. Origin region was labelled with an array of tetO operators bound by TetR-GFP. Phase contrast (top panel), TetR-GFP (middle panel) and membrane dye FM 5-95 overlayed with TetR-GFP (bottom panel). (d) YabA dependent increase in the number of origins per cell. Scale bar, 3 µm.CC BY · PubMed Central
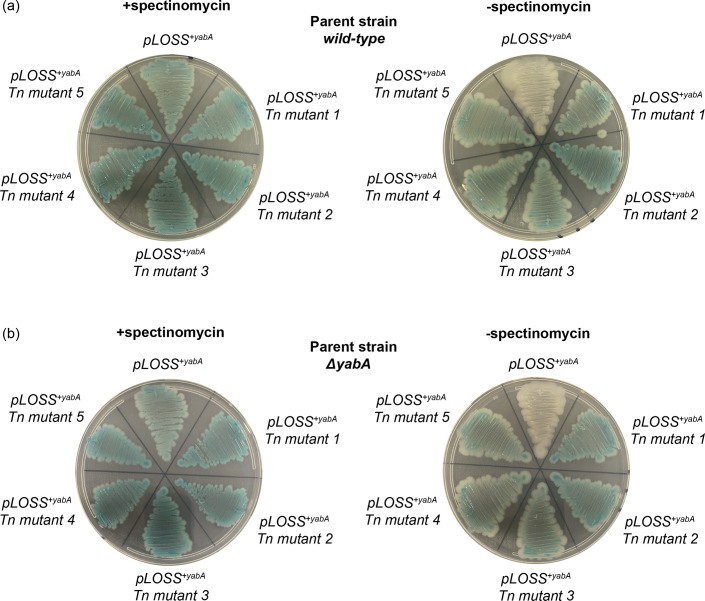
Fig. 9. The isolated transposon insertion mutants were false positives. The pLOSS+yabA plasmid was extracted from the five transposon insertion candidates and transformed into (a) the wild-type B. subtilis strain 168 and (b) the ΔyabA mutant. The resulting transformants were streaked over multiple generations on X-GAL agar plates in the presence or absence of spectinomycin. Transformants that retained the pLOSS+yabA plasmid formed blue colonies.
Fig. 9. The isolated transposon insertion mutants were false positives. The pLOSS+yabA plasmid was extracted from the five transposon insertion candidates and transformed into (a) the wild-type B. subtilis strain 168 and (b) the ΔyabA mutant. The resulting transformants were streaked over multiple generations on X-GAL agar plates in the presence or absence of spectinomycin. Transformants that retained the pLOSS+yabA plasmid formed blue colonies.CC BY · PubMed Central

Verification

Claims the paper makes

The claims and statistics of this paper haven’t been checked yet.

Run the check — free, no account needed. It reads the open-access text and checks the sources it cites.

A few free checks a day · papers already verified open instantly · results are public

Self-check

Percentages, sums and reported differences re-computed from the paper’s own numbers.

The self-check needs the paper’s full text.

Citations

Cites

Show all 51 references

Metadata

Authors
Koh, A.
Affiliations
MRC London Institute of Medical Sciences (GB)
Corresponding author
Koh, Alan
Venue
Access Microbiology
Published
2026-01-01
Volume
8
Issue
1
ISSN
2516-8290 (ISSN-L)
OpenAlex
W7118361241
Cited by
0
References
51
FWCI
0.00
Type
journal article
Language
en
Open access
Locations
  • Access Microbiology (publishedVersion, cc-by)
  • PubMed (publishedVersion)
  • PubMed Central (publishedVersion, cc-by)
Funders
Biotechnology and Biological Sciences Research Council (BB/S00257X/1)
Topics
  • Life Sciences › Biochemistry, Genetics and Molecular Biology › Genetics › Bacterial Genetics and Biotechnology
  • Life Sciences › Biochemistry, Genetics and Molecular Biology › Molecular Biology › Genomics and Chromatin Dynamics
  • Life Sciences › Biochemistry, Genetics and Molecular Biology › Molecular Biology › DNA Repair Mechanisms
Keywords
LysR-type transcriptional regulator, Bacillus subtilis, DNA replication initiation, chromosome segregation, Yaba, Pará, transposon mutagenesis, chromosome morphology, metabolic regulation

About these checks

Registry, retraction, Cites and statistics results are computed, not judged, with one exception: a printed reference that no index lists is read once by a model before it counts as a citation error. Claims are extracted by a model and kept only when their quote appears verbatim in the text; each cited source is then checked, with a model’s help, for whether it says what the claim relies on. Those verdicts can be wrong — read the claim’s quote and the cited source before relying on one.

Statistics and arithmetic are recomputed, not judged.

Confidence bands are shown only for fields calibrated on our annotated test set. None is calibrated yet, so no band is shown.

What counts as a claim ›How we measure confidence ›How we check this ›

Are you an author, or do you see a problem with this page? Request a review

How to cite

Cite CoChat for the checks on this page, and the paper for its own findings.

This page
CoChat. (2026). Citation check: The Bacillus subtilis putative LysR-type transcriptional regulator YybE and its connection to chromosome replication and segregation. https://app.cochat.ai/papers/10.1099/acmi.0.001000.v4
The paper
Koh, A. (2026). The Bacillus subtilis putative LysR-type transcriptional regulator YybE and its connection to chromosome replication and segregation. Access Microbiology. https://doi.org/10.1099/acmi.0.001000.v4

Data sources

Bibliographic data: Semantic Scholar, OpenAlex, Crossref.

Contains information from the Semantic Scholar Academic Graph Datasets, made available under the ODC Attribution License (ODC-BY 1.0).

Semantic Scholar’s data is described in: Kinney, R., et al. (2023). The Semantic Scholar Open Data Platform. arXiv:2301.10140.