PreprintCited by 291Microbial Community Ecology and PhysiologyGenomics and Phylogenetic StudiesAdvanced Proteomics Techniques and Applications

The DOI matches its Crossref record; the references it cites are not checked yet.

Assessing species biomass contributions in microbial communities via metaproteomics

Open access

Preprint — published as 10.1038/s41467-017-01544-x · Paper page

Abstract

Assessment of microbial community composition is the cornerstone of microbial ecology. Microbial community composition can be analyzed by quantifying cell numbers or by quantifying biomass for individual populations. However, as cell volumes can differ by orders of magnitude, these two approaches yield vastly different results. Methods for quantifying cell numbers are already available (e.g. fluorescence in situ hybridization, 16S rRNA gene amplicon sequencing), yet methods for assessing community composition in terms of biomass are lacking. We developed metaproteomics based methods for assessing microbial community composition using protein abundance as a measure for biomass contributions of individual populations. We optimized the accuracy and sensitivity of the method using artificially assembled microbial communities and found that it is less prone to some of the biases found in sequencing-based methods. We applied the method using communities from two different environments, microbial mats from two alkaline soda lakes and saliva from multiple individuals.

Overview

The claims and statistics of this paper haven’t been checked yet.

Run the check — free, no account needed. It reads the open-access text and checks the sources it cites.

A few free checks a day · papers already verified open instantly · results are public

Integrity signals

Registry

Crossref · 10.1101/130575

Cites

Statistics

Figures

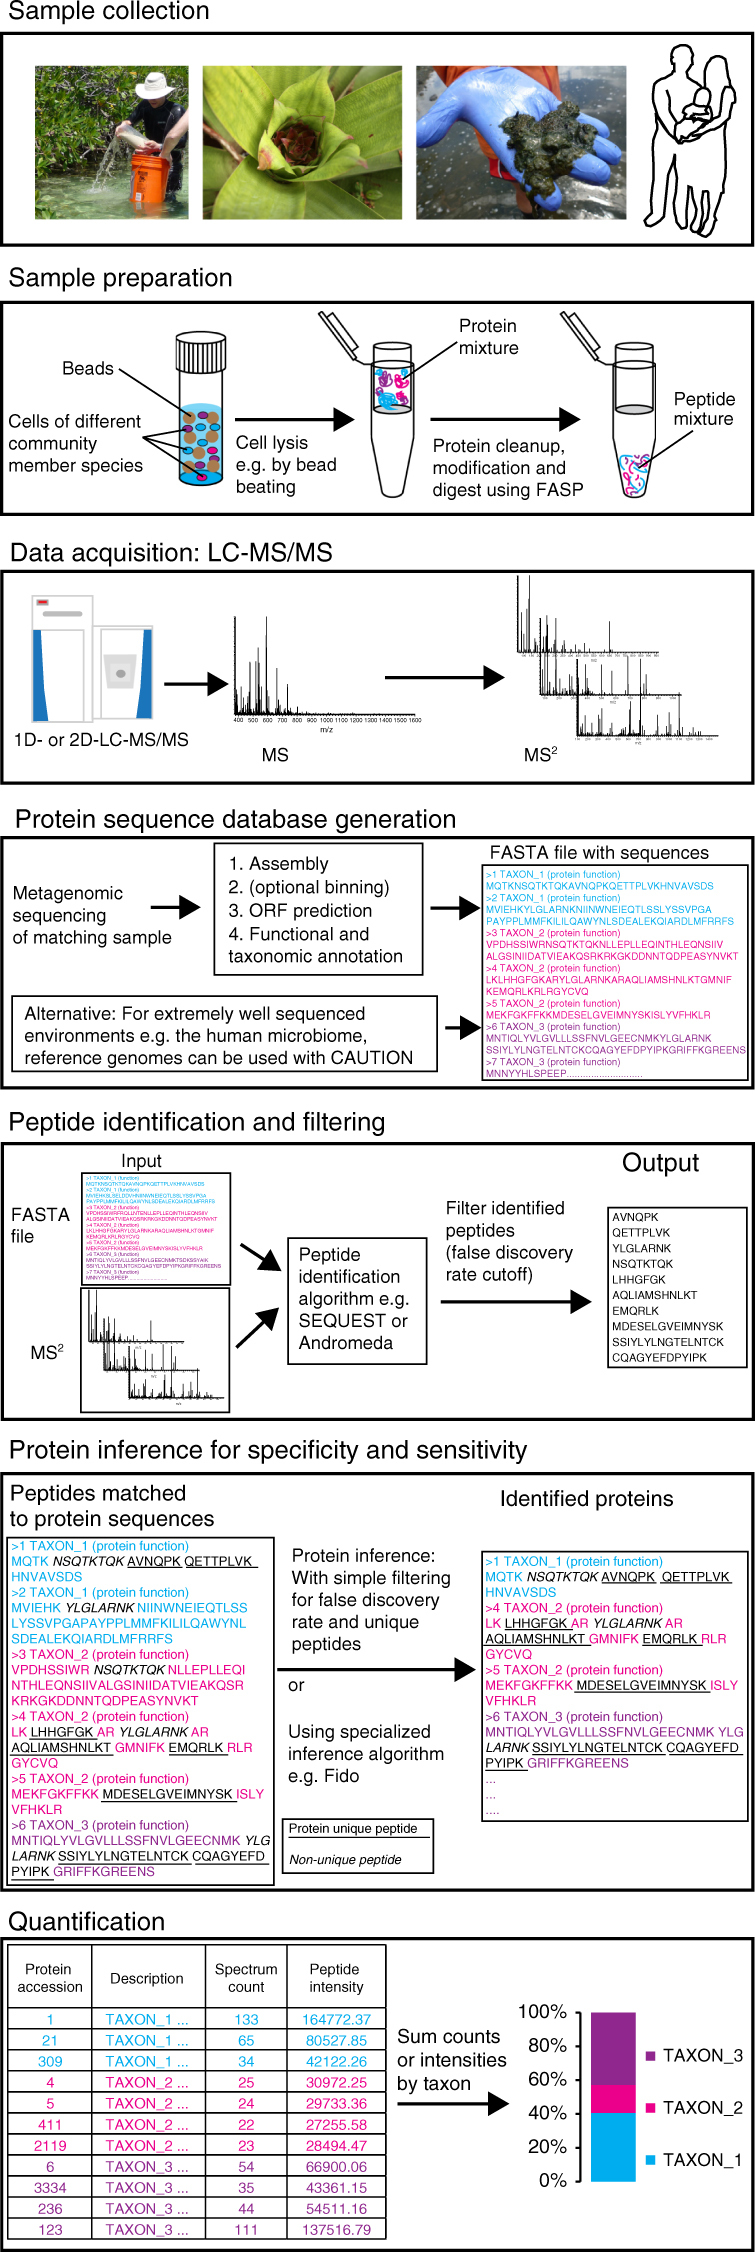
Fig. 1 Workflow for assessing species biomass contributions using metaproteomics. The presented workflow can be adapted to different LC-MS/MS systems and computational tools. The critical considerations for achievement of high accuracy and sensitivity are as follows: (1) use of a protein sequence database derived from a metagenome of a sample matching to the metaproteomic samples; (2) selection and optimization of protein inference parameters with test datasets to achieve sufficient specificity; and (3) quantification of taxa using the sum of PSM counts or peptide intensities based on inferred proteins and not based on peptide inference
Fig. 1 Workflow for assessing species biomass contributions using metaproteomics. The presented workflow can be adapted to different LC-MS/MS systems and computational tools. The critical considerations for achievement of high accuracy and sensitivity are as follows: (1) use of a protein sequence database derived from a metagenome of a sample matching to the metaproteomic samples; (2) selection and optimization of protein inference parameters with test datasets to achieve sufficient specificity; and (3) quantification of taxa using the sum of PSM counts or peptide intensities based on inferred proteins and not based on peptide inferenceCC BY · PubMed Central
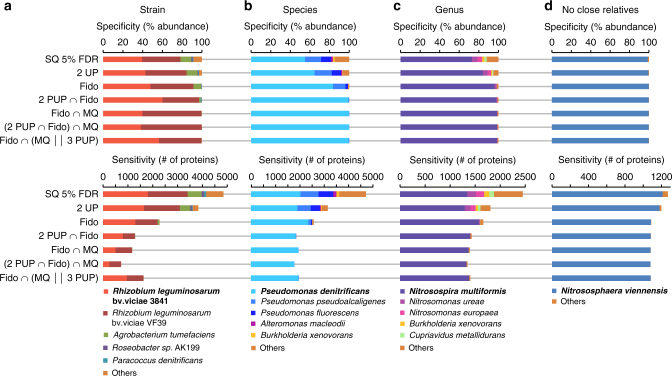
Fig. 2 Specificity and sensitivity of protein identification with different protein inference strategies. The proteomics data for four pure cultures (a R. leg. bv. viciae 3841, b P. denitrificans, c N. multiformis, d N. viennensis) were analyzed in separate runs. For all cultures, proteins were identified with the same simulated metagenomic database containing 30 different species, which included other organisms related at the strain (a), species (b), or genus level (c). For d, no closely related organisms were included. Upper panels show specificity (% abundance of proteins attributed to each organism) and lower panels sensitivity (# of proteins identified). More stringent identification strategies improve specificity at the expense of sensitivity. Protein inference strategies: SQ 5% FDR; SEQUEST search filtered for 5% false discovery rate (FDR) using standard Target-Decoy strategy (implemented as Protein FDR Validator Node in Proteome Discoverer). 2 UP; same as previous, but only the subset of proteins identified with at least two unique peptides (UP). Fido; SEQUEST-Fido results filtered at 5% FDR based on protein q-value. 2 PUP ∩ Fido; same as previous, but only the subset of proteins identified with at least two protein unique peptides (PUP). Fido ∩ MQ; Only proteins identified both by Sequest-Fido (FDR 5%) and MaxQuant (1% protein FDR, at least 2 razor + unique peptides). (2 PUP ∩ SQ Fido) ∩ MQ; Same as previous, but for SEQUEST-Fido only the subset of proteins identified with at least two protein unique peptides. Fido ∩ (MQ || 3 PUP); Only proteins that were identified both by SEQUEST-Fido and MaxQuant. Additionally, SEQUEST-Fido identified proteins were retained even if they were not identified by MaxQuant if they had at least three protein unique peptides
Fig. 2 Specificity and sensitivity of protein identification with different protein inference strategies. The proteomics data for four pure cultures (a R. leg. bv. viciae 3841, b P. denitrificans, c N. multiformis, d N. viennensis) were analyzed in separate runs. For all cultures, proteins were identified with the same simulated metagenomic database containing 30 different species, which included other organisms related at the strain (a), species (b), or genus level (c). For d, no closely related organisms were included. Upper panels show specificity (% abundance of proteins attributed to each organism) and lower panels sensitivity (# of proteins identified). More stringent identification strategies improve specificity at the expense of sensitivity. Protein inference strategies: SQ 5% FDR; SEQUEST search filtered for 5% false discovery rate (FDR) using standard Target-Decoy strategy (implemented as Protein FDR Validator Node in Proteome Discoverer). 2 UP; same as previous, but only the subset of proteins identified with at least two unique peptides (UP). Fido; SEQUEST-Fido results filtered at 5% FDR based on protein q-value. 2 PUP ∩ Fido; same as previous, but only the subset of proteins identified with at least two protein unique peptides (PUP). Fido ∩ MQ; Only proteins identified both by Sequest-Fido (FDR 5%) and MaxQuant (1% protein FDR, at least 2 razor + unique peptides). (2 PUP ∩ SQ Fido) ∩ MQ; Same as previous, but for SEQUEST-Fido only the subset of proteins identified with at least two protein unique peptides. Fido ∩ (MQ || 3 PUP); Only proteins that were identified both by SEQUEST-Fido and MaxQuant. Additionally, SEQUEST-Fido identified proteins were retained even if they were not identified by MaxQuant if they had at least three protein unique peptidesCC BY · PubMed Central
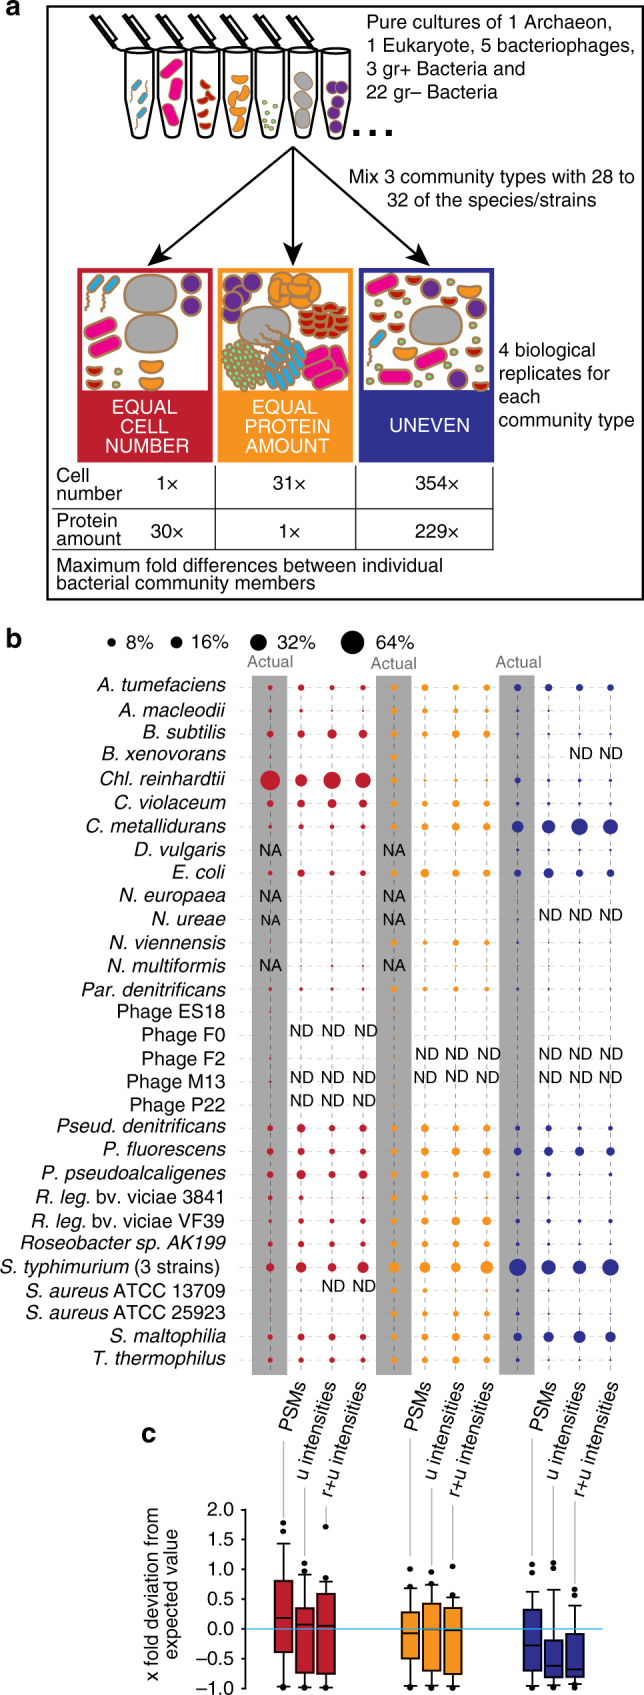
Fig. 3 Quantification of mock community using three proteomic quantification methods. a Illustration of mock community construction. 32 species and strains were used for the construction of three distinct community types. b Comparison of three proteomic quantification methods with the actual protein input amounts. Averages of four biological replicates per community are shown (full data in Supplementary Data 1). The data from two 460 min long 1D-LC-MS/MS runs were used per biological replicate. Three different quantification methods were used including sum of peptide-spectrum matches (PSMs), sum of peptide ion intensities using only unique peptides (u intensities), and sum of peptide ion intensities using razor and unique peptides (r + u intensities) as implemented in MaxQuant. The bacteriophages were mixed at a 1:10 ratio into the “equal protein amount” communities. On the basis of metagenomic sequencing, we found that the B. xenovorans culture was contaminated with S. epidermidis and thus the input protein amounts and cell numbers for B. xenovorans were lower than calculated. We used three Salmonella enterica typhimurium strains in the mock communities that differed only in a small number of genes and thus were de facto indistinguishable on the proteomic and metagenomic level and thus the inputs for the three strains are reported as one species. The bubble plot was generated with the bubble.pl script55. c Box plots show the x-fold deviation of the amounts measured with the three proteomic quantification methods from the actual protein input amounts. The box indicates the 1st and 3rd quartile, the line indicates the median and the whiskers indicate the 10th and 90th percentile. Outliers are indicated as individual points. If measurement and input were equal, then all values would be exactly 0 (indicated by bright blue line). Zeros (species that were not detected i.e., ‘ND’ in b) were removed before plotting. NA: species not added to this mock community; ND: Not detected with this method
Fig. 3 Quantification of mock community using three proteomic quantification methods. a Illustration of mock community construction. 32 species and strains were used for the construction of three distinct community types. b Comparison of three proteomic quantification methods with the actual protein input amounts. Averages of four biological replicates per community are shown (full data in Supplementary Data 1). The data from two 460 min long 1D-LC-MS/MS runs were used per biological replicate. Three different quantification methods were used including sum of peptide-spectrum matches (PSMs), sum of peptide ion intensities using only unique peptides (u intensities), and sum of peptide ion intensities using razor and unique peptides (r + u intensities) as implemented in MaxQuant. The bacteriophages were mixed at a 1:10 ratio into the “equal protein amount” communities. On the basis of metagenomic sequencing, we found that the B. xenovorans culture was contaminated with S. epidermidis and thus the input protein amounts and cell numbers for B. xenovorans were lower than calculated. We used three Salmonella enterica typhimurium strains in the mock communities that differed only in a small number of genes and thus were de facto indistinguishable on the proteomic and metagenomic level and thus the inputs for the three strains are reported as one species. The bubble plot was generated with the bubble.pl script55. c Box plots show the x-fold deviation of the amounts measured with the three proteomic quantification methods from the actual protein input amounts. The box indicates the 1st and 3rd quartile, the line indicates the median and the whiskers indicate the 10th and 90th percentile. Outliers are indicated as individual points. If measurement and input were equal, then all values would be exactly 0 (indicated by bright blue line). Zeros (species that were not detected i.e., ‘ND’ in b) were removed before plotting. NA: species not added to this mock community; ND: Not detected with this methodCC BY · PubMed Central
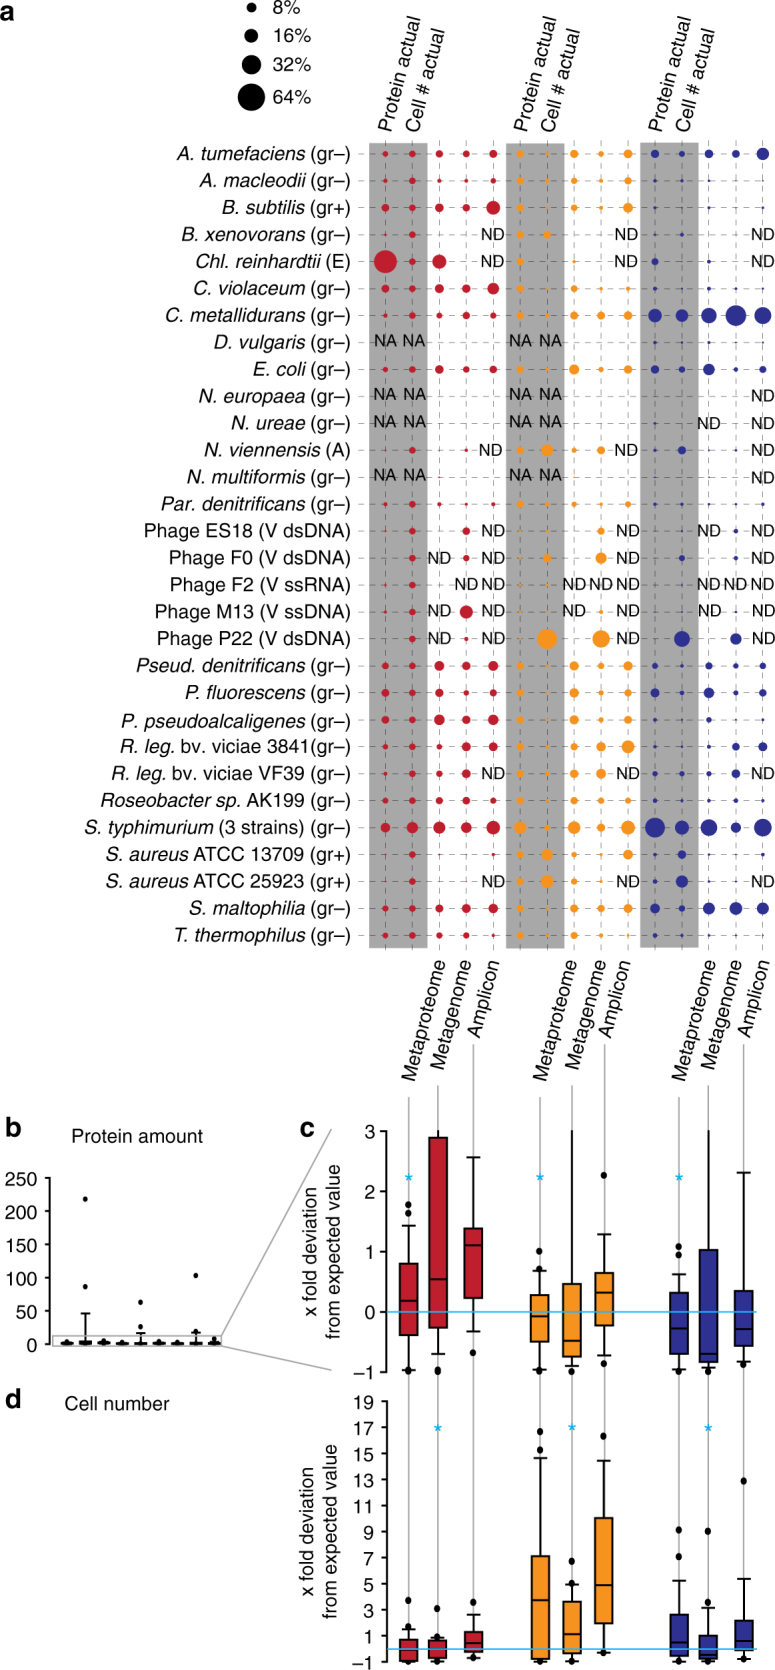
Fig. 4 Comparison of metaproteomic, shotgun metagenomic and 16S rRNA gene amplicon-based quantification of the mock communities. a The same mock communities as in Fig. 3 were used. For 16S rRNA gene amplicons and metaproteomes averages of four biological replicates per community type are shown. For the shotgun metagenomic data averages of three biological replicates are shown. For the metaproteomes the PSM-based quantification is shown (Fig. 3b). (gr − or gr + ) Gram-positive or -negative bacterium, (A) Archaeum, (E) Eukaryote, (V dsDNA, ssDNA or ssRNA) virus specifying nucleic acid type of genome. b–d Box plots show the x-fold deviation of the species abundance quantification with metaproteomics, metagenomics and 16S rRNA gene amplicon sequencing from the actual input amounts for protein (b) and (c), and cell number (d). c is an enlargement of the lower part of (b). If measured and input species abundance were equal, then all values would be exactly 0 (indicated by bright blue line). Zeros (species that were not detected i.e., ‘ND’ in a) were removed before plotting. For each community type and method the method with the significantly lowest x-fold deviation (p-value < 0.01, t test) is indicated with a bright blue ‘*’ (see Supplementary Table 4 for details on statistics). NA species not added to this mock community, ND not detected with this method
Fig. 4 Comparison of metaproteomic, shotgun metagenomic and 16S rRNA gene amplicon-based quantification of the mock communities. a The same mock communities as in Fig. 3 were used. For 16S rRNA gene amplicons and metaproteomes averages of four biological replicates per community type are shown. For the shotgun metagenomic data averages of three biological replicates are shown. For the metaproteomes the PSM-based quantification is shown (Fig. 3b). (gr − or gr + ) Gram-positive or -negative bacterium, (A) Archaeum, (E) Eukaryote, (V dsDNA, ssDNA or ssRNA) virus specifying nucleic acid type of genome. b–d Box plots show the x-fold deviation of the species abundance quantification with metaproteomics, metagenomics and 16S rRNA gene amplicon sequencing from the actual input amounts for protein (b) and (c), and cell number (d). c is an enlargement of the lower part of (b). If measured and input species abundance were equal, then all values would be exactly 0 (indicated by bright blue line). Zeros (species that were not detected i.e., ‘ND’ in a) were removed before plotting. For each community type and method the method with the significantly lowest x-fold deviation (p-value < 0.01, t test) is indicated with a bright blue ‘*’ (see Supplementary Table 4 for details on statistics). NA species not added to this mock community, ND not detected with this methodCC BY · PubMed Central
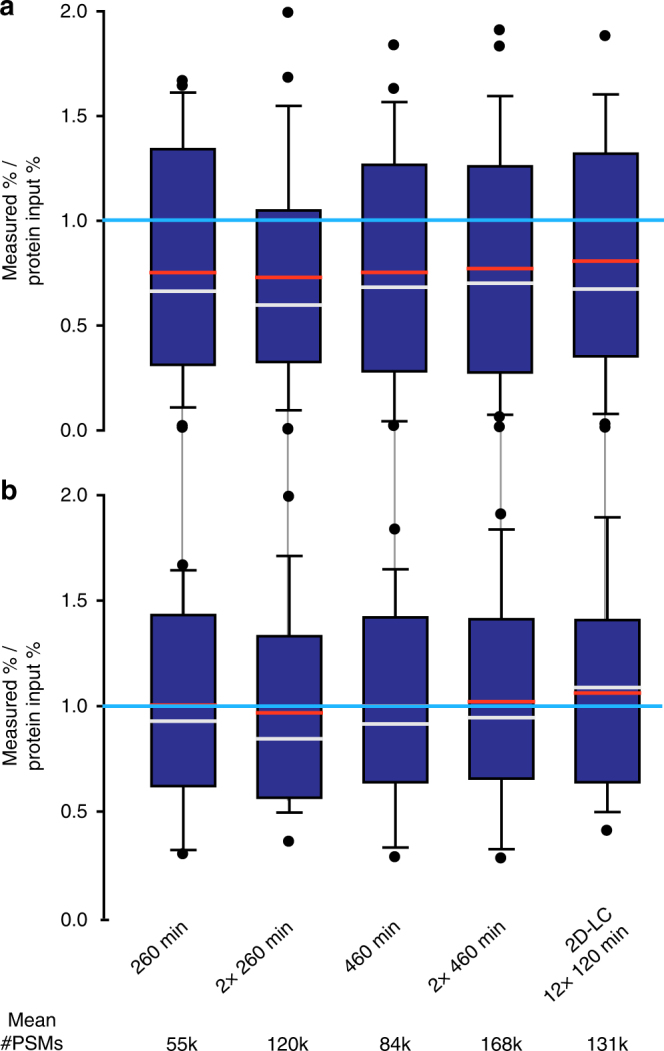
Fig. 5 Comparison of quantification accuracy for the uneven mock community depending on LC method, gradient length and technical replication. Four biological replicates were run for each method and the number of peptide-spectrum matches (PSMs) was averaged per organism. The numbers below the plots give the average total number of PSMs generated for each of the methods. Box plots show the deviation of the amounts measured by summing of PSMs from the actual protein input amounts. The box indicates the 1st and 3rd quartile, the grey line indicates the median, the red line the average and the whiskers indicate the 10th and 90th percentile. If measurement and input were equal, then all values would be exactly 1 (indicated by bright blue line). The first four methods were 1D-LC-MS/MS runs of the given length. The ‘2×’ indicates if technical replicates were run. The fifth method was 2D-LC-MS/MS runs with each of the 12 fractions measured for 120 min (detailed data for this Figure is in Supplementary Table 6). In a, the deviation values for all 27 detected strains and species are shown. In b, the deviation values are only shown for the 18 strains and species that had an abundance > 0.5% based on at least one of the methods
Fig. 5 Comparison of quantification accuracy for the uneven mock community depending on LC method, gradient length and technical replication. Four biological replicates were run for each method and the number of peptide-spectrum matches (PSMs) was averaged per organism. The numbers below the plots give the average total number of PSMs generated for each of the methods. Box plots show the deviation of the amounts measured by summing of PSMs from the actual protein input amounts. The box indicates the 1st and 3rd quartile, the grey line indicates the median, the red line the average and the whiskers indicate the 10th and 90th percentile. If measurement and input were equal, then all values would be exactly 1 (indicated by bright blue line). The first four methods were 1D-LC-MS/MS runs of the given length. The ‘2×’ indicates if technical replicates were run. The fifth method was 2D-LC-MS/MS runs with each of the 12 fractions measured for 120 min (detailed data for this Figure is in Supplementary Table 6). In a, the deviation values for all 27 detected strains and species are shown. In b, the deviation values are only shown for the 18 strains and species that had an abundance > 0.5% based on at least one of the methodsCC BY · PubMed Central
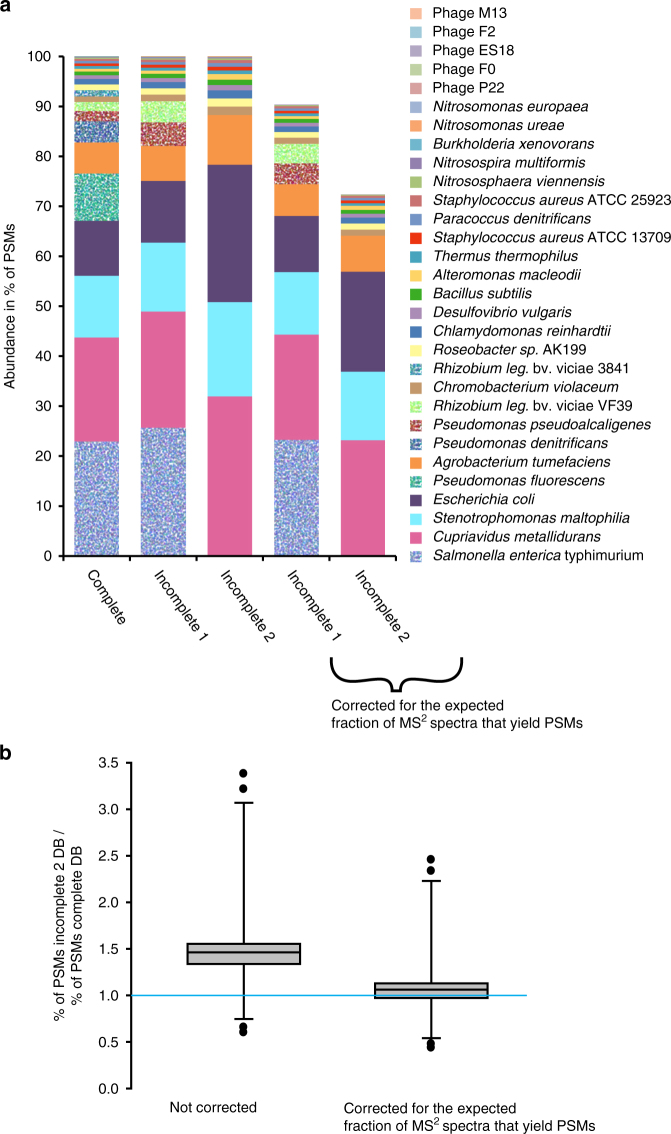
Fig. 6 Effect of using incomplete protein sequence databases on quantification results. Species in the uneven community were quantified using the complete protein sequence database containing the protein sequences of all species in the community for protein identification and two sequence databases of varying incompleteness. In the first incomplete database (incomplete1), the protein sequences for Pseudomonas denitrificans, Pseudomonas fluorescens and Rhizobium leguminosarum bv. viciae (strain 3841) were removed leaving the sequences of the closely related species/strains Pseudomonas pseudoalcaligenes and Rhizobium leguminosarum bv. viciae (strain VF39) in the database. In the second incomplete database (incomplete2) the remaining Pseudomonas and Rhizobium sequences as well as the Salmonella enterica typhimurium LT2 sequences were removed. In a, the average quantification results for the four uneven community biological replicates are shown. For the 4th and 5th bar the quantification results were corrected by considering the percentage of PSMs lost due to database incompleteness, i.e., based on searches with the complete database the expected fraction of MS2 spectra that yielded PSMs was known and thus we could calculate the difference between the expected number of PSMs and actual number of PSMs in the quantification with the incomplete databases. In b, the comparison of the quantification results with the complete and the incomplete2 databases are shown before and after correction of the incomplete2 quantification results. If the quantification results were in perfect agreement then all values would be 1 (indicated by the bright blue line). The box indicates the 1st and 3rd quartile, the line indicates the median and the whiskers indicate the 10th and 90th percentile
Fig. 6 Effect of using incomplete protein sequence databases on quantification results. Species in the uneven community were quantified using the complete protein sequence database containing the protein sequences of all species in the community for protein identification and two sequence databases of varying incompleteness. In the first incomplete database (incomplete1), the protein sequences for Pseudomonas denitrificans, Pseudomonas fluorescens and Rhizobium leguminosarum bv. viciae (strain 3841) were removed leaving the sequences of the closely related species/strains Pseudomonas pseudoalcaligenes and Rhizobium leguminosarum bv. viciae (strain VF39) in the database. In the second incomplete database (incomplete2) the remaining Pseudomonas and Rhizobium sequences as well as the Salmonella enterica typhimurium LT2 sequences were removed. In a, the average quantification results for the four uneven community biological replicates are shown. For the 4th and 5th bar the quantification results were corrected by considering the percentage of PSMs lost due to database incompleteness, i.e., based on searches with the complete database the expected fraction of MS2 spectra that yielded PSMs was known and thus we could calculate the difference between the expected number of PSMs and actual number of PSMs in the quantification with the incomplete databases. In b, the comparison of the quantification results with the complete and the incomplete2 databases are shown before and after correction of the incomplete2 quantification results. If the quantification results were in perfect agreement then all values would be 1 (indicated by the bright blue line). The box indicates the 1st and 3rd quartile, the line indicates the median and the whiskers indicate the 10th and 90th percentileCC BY · PubMed Central
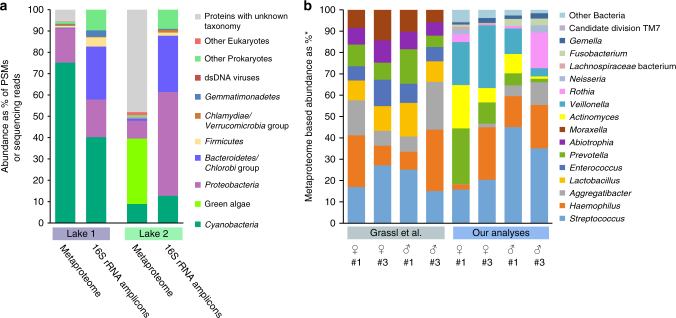
Fig. 7 Two application examples using metaproteomics of estimating species biomass in communities. a Comparison of phylum level quantification of two soda lake biomats using metaproteomics and 16S rRNA gene amplicon sequencing. b Re-analysis of a published saliva metaproteome data set by Grassl et al.9 using our method and comparison with the original analysis. *For the Grassl et al. analyses the abundances are given in % of the summed MS intensities of the 10 most abundant peptides per genus across all samples. For our analyses the abundances are given as % of all PSMs from proteins inferred by FidoCT with an FDR of 5% and at least 2 protein unique peptides
Fig. 7 Two application examples using metaproteomics of estimating species biomass in communities. a Comparison of phylum level quantification of two soda lake biomats using metaproteomics and 16S rRNA gene amplicon sequencing. b Re-analysis of a published saliva metaproteome data set by Grassl et al.9 using our method and comparison with the original analysis. *For the Grassl et al. analyses the abundances are given in % of the summed MS intensities of the 10 most abundant peptides per genus across all samples. For our analyses the abundances are given as % of all PSMs from proteins inferred by FidoCT with an FDR of 5% and at least 2 protein unique peptidesCC BY · PubMed Central

Verification

Claims the paper makes

The claims and statistics of this paper haven’t been checked yet.

Run the check — free, no account needed. It reads the open-access text and checks the sources it cites.

A few free checks a day · papers already verified open instantly · results are public

Self-check

Percentages, sums and reported differences re-computed from the paper’s own numbers.

The self-check needs the paper’s full text.

Citations

The citation lists haven’t been fetched yet

References 54 · Cited by 291

Research works printed but not linked: 43

  1. 10.1021/acsnano.5b07826 · DOI
  2. 10.1038/nrmicro1888 · DOI
  3. 10.1128/mBio.02288-14 · DOI
  4. Daims, H . in Cold Spring Harbor Protocols, Vol. 4 pdb.prot5253 (2009). · DOI
  5. 10.1016/j.mib.2012.04.008 · DOI
  6. 10.1093/nar/gkp889 · DOI · Paper page
  7. 10.1038/nature18297 · DOI
  8. 2016, Ultra-deep and quantitative saliva proteome reveals dynamics of the oral microbiome, Genome Medicine, 8, 44, 10.1186/s13073-016-0293-0 · DOI
  9. 2016, Proteotyping of biogas plant microbiomes separates biogas plants according to process temperature and reactor type, Biotechnology for Biofuels, 9, 155, 10.1186/s13068-016-0572-4 · DOI
  10. 10.1074/mcp.R500012-MCP200 · DOI · Paper page
  11. 2017, Critical decisions in metaproteomics: achieving high confidence protein annotations in a sea of unknowns, ISME J, 11, 309, 10.1038/ismej.2016.132 · DOI
  12. 10.1021/pr0701005 · DOI
  13. 10.1073/pnas.1121198109 · DOI
  14. 10.1038/nprot.2016.136 · DOI
  15. 10.1021/pr100594k · DOI
  16. 2014, The probabilistic convolution tree: efficient exact bayesian inference for faster LC-MS/MS protein inference, PLoS ONE, 9, e91507, 10.1371/journal.pone.0091507 · DOI
  17. 2017, Robust, high-productivity phototrophic carbon capture at high pH and alkalinity using natural microbial communities, Biotechnology for Biofuels, 10, 84, 10.1186/s13068-017-0769-1 · DOI
  18. 10.1093/nar/gks808 · DOI · Paper page
  19. 10.1111/1462-2920.13023:1403-1414 · DOI
  20. 2015, Primer and platform effects on 16S rRNA tag sequencing, Frontiers in Microbiology, 6, 771
  21. Props, R. et al. Absolute quantification of microbial taxon abundances. ISME J. (2016). · DOI
  22. 10.1186/s12864-014-1207-4 · DOI
  23. Sambrook, J. , Fritsch, E.F. & Maniatis, T. in Molecular Cloning, Vol. 1, Edn. second. (ed. C. Nolan) (Cold Spring Harbor Laboratory Press, 1989).
  24. 10.1111/j.1574-6941.2000.tb00746.x · DOI
  25. 10.1038/ismej.2011.41 · DOI · Paper page
  26. Nurk, S. , Meleshko, D. , Korobeynikov, A. & Pevzner, P.A. metaSPAdes: a new versatile metagenomic assembler. Genome Res. Published in Advance (2017). · DOI · Paper page
  27. 10.1093/bioinformatics/btv697 · DOI · Paper page
  28. Strous, M. , Kraft, B. , Bisdorf, R. & Tegetmeyer, H. The binning of metagenomic contigs for microbial physiology of mixed cultures. Frontiers in Microbiology 3 (2012). · DOI
  29. 10.1089/cmb.2012.0021 · DOI
  30. 10.1101/gr.186072.114 · DOI · Paper page
  31. 10.1186/1471-2164-9-75 · DOI
  32. 10.1016/j.ymeth.2016.02.020 · DOI
  33. 10.1186/2047-217X-1-18 · DOI
  34. 10.1093/bioinformatics/bts429 · DOI
  35. 2015, Fast and sensitive protein alignment using DIAMOND, Nat. Meth, 12, 59, 10.1038/nmeth.3176 · DOI · Paper page
  36. 10.1093/nar/gkv1248 · DOI
  37. 10.1093/bioinformatics/btl158 · DOI
  38. 2009, Universal sample preparation method for proteome analysis, Nat. Meth, 6, 359, 10.1038/nmeth.1322 · DOI · Paper page
  39. 10.1021/pr8010099 · DOI
  40. 2016, Chemosynthetic symbionts of marine invertebrate animals are capable of nitrogen fixation, Nature Microbiology, 2, 16195, 10.1038/nmicrobiol.2016.195 · DOI
  41. Chen, T. et al. The Human Oral Microbiome Database: a web accessible resource for investigating oral microbe taxonomic and genomic information. Database (Oxford) 2010 (2010). · DOI · Paper page
  42. 10.1093/nar/gkv1145 · DOI
  43. 10.1111/j.1462-2920.2009.02058.x · DOI

Metadata

Authors
Kleiner, M., Thorson, E., Sharp, C. E., Dong, X., Liu, D., Li, C., & Strous, M.
Affiliations
  • North Carolina State University (US)
  • University of Calgary (CA)
Corresponding author
Kleiner, Manuel
Venue
Nature Communications
Publisher
openRxiv
Published
2017-04-25
Volume
8
Issue
1
Pages
1558-1558
ISSN
2041-1723 (ISSN-L)
OpenAlex
W2950438666
Cited by
291
References
54
Citations by year
2026: 25 · 2025: 36 · 2024: 45 · 2023: 48 · 2022: 30 · 2021: 33 · 2020: 37 · 2019: 29 · 2018: 7 · 2017: 1
FWCI
15.67
Type
journal article
Language
en
Open access
Locations
  • Nature Communications (publishedVersion, cc-by)
  • bioRxiv (Cold Spring Harbor Laboratory) (acceptedVersion, cc-by)
  • PubMed Central (publishedVersion, cc-by)
  • PubMed (publishedVersion)
  • RePEc: Research Papers in Economics (submittedVersion)
  • DOAJ (DOAJ: Directory of Open Access Journals) (submittedVersion, cc-by-sa)
  • DOAJ (DOAJ: Directory of Open Access Journals) (submittedVersion)
Funders
  • University of Calgary
  • Canada First Research Excellence Fund
  • Natural Sciences and Engineering Research Council of Canada
Topics
  • Physical Sciences › Environmental Science › Ecology › Microbial Community Ecology and Physiology
  • Life Sciences › Biochemistry, Genetics and Molecular Biology › Molecular Biology › Genomics and Phylogenetic Studies
  • Physical Sciences › Chemistry › Spectroscopy › Advanced Proteomics Techniques and Applications
Keywords
microbial community structure, species biomass, protein abundance, metaproteomics, microbial mats, saliva microbiota, sequencing bias, population abundance estimation
MeSH terms
Archaea, Bacteria, Bacteriophages, Humans, RNA, Ribosomal, 16S, Saliva, Biomass, Proteome, Genomics, Proteomics, Lakes, Microbiota

About these checks

Registry, retraction, Cites and statistics results are computed, not judged, with one exception: a printed reference that no index lists is read once by a model before it counts as a citation error. Claims are extracted by a model and kept only when their quote appears verbatim in the text; each cited source is then checked, with a model’s help, for whether it says what the claim relies on. Those verdicts can be wrong — read the claim’s quote and the cited source before relying on one.

Statistics and arithmetic are recomputed, not judged.

Confidence bands are shown only for fields calibrated on our annotated test set. None is calibrated yet, so no band is shown.

What counts as a claim ›How we measure confidence ›How we check this ›

Are you an author, or do you see a problem with this page? Request a review

How to cite

Cite CoChat for the checks on this page, and the paper for its own findings.

This page
CoChat. (2026). Citation check: Assessing species biomass contributions in microbial communities via metaproteomics. https://app.cochat.ai/papers/10.1101/130575
The paper
Kleiner, M., Thorson, E., Sharp, C. E., Dong, X., Liu, D., Li, C., & Strous, M. (2017). Assessing species biomass contributions in microbial communities via metaproteomics. Nature Communications. https://doi.org/10.1101/130575